

Abstract
Purpose
Interlukin-29 (IL-29) is a member of the type III interferon (IFN) family that has been shown to have antiviral activity and inhibit cell growth. Melanoma cell lines were tested for the expression of the IL-29R and their response to IL-29.
Methods
Expression of IL-28R1 and IL-10R2, components of the IL-29R, was evaluated using RT-PCR. A combination of immunoblot analysis and flow cytometry was used to evaluate IL-29-induced signal transduction. U133 Plus 2.0 Arrays and real-time PCR were used to evaluate gene expression. Apoptosis was measured using Annexin V/Propridium Iodide staining. In situ PCR for the IL-29R was performed on paraffin-embedded melanoma tumors.
Results
Both IL-28R1 and IL-10R2 were expressed on the A375, 1106 MEL, Hs294T, 18105 MEL, MEL 39, SK MEL 5 and F01 cell lines. Incubation of melanoma cell lines with IL-29 (10–1000 ng/mL) led to phosphorylation of STAT1 and STAT2. Microarray analysis and qRT-PCR showed a marked increase in transcripts of IFN-regulated genes after treatment with IL-29. In the F01 cell line, bortezomib-induced and temozolomide-induced apoptosis was synergistically enhanced following the addition of IL-29. In situ PCR revealed that IL-10R2 and IL-28R1 were present in six of eight primary human melanoma tumors but were not present in benign nevi specimens.
Conclusion
IL-29 receptors are expressed on the surface of human melanoma cell lines and patient samples and treatment of these cell lines with IL-29 leads to signaling via the Jak-STAT pathway, the transcription of a unique set of genes, and apoptosis.
Keywords: IL-29, Interferon-lambda, malignant melanoma, Jak-STAT
Introduction
Interferon-alpha (IFN-α) is commonly used in the treatment of malignant melanoma, both as an adjuvant to surgical resection and in the setting of advanced disease (1). This cytokine enhances the activity of immune effector cells while mediating anti-proliferative and pro-apoptotic effects against tumor cells. The receptor for IFN-α is widely expressed on normal tissues and has been identified on tumor cell lines (2). The binding of IFN-α to its receptor results in the phosphorylation of Janus kinase 1 (Jak1) and tyrosine kinase 2 (Tyk2) on specific tyrosine residues. These phosphor-tyrosine residues provide docking sites for cytoplasmic transcription factors belonging to the signal transducer and activator of transcription (STAT) family of proteins. These STAT proteins (STAT1α, STAT2) are phosphorylated by the Janus kinases and subsequently form high affinity DNA binding complexes that rapidly translocate to the cell nucleus to drive the expression of IFN-responsive genes (3, 4).
Interleukin-29 (IL-29), also known as interferon-lambda (IFN-λ), is a recently discovered cytokine of the type III IFN family (5, 6). It is thought to have biologic properties similar to the type I IFNs. Unlike IFN-α, the receptor for IL-29 is expressed on a limited number of normal cells including dendritic cells, T cells, and intestinal epithelial cells. Leukemia cells and colon, prostate, pancreatic, lung, hepatoma, glioblastoma, and breast cancer cells have also been shown to express this receptor (6–12). In these reports IL-29 elicited signal transduction via activation of the Jak-STAT pathway, p-AKT and the mitogen-activated protein kinase/extracellular signal-regulated kinases (MAPK/ERK) (5, 8, 9, 12, 13).
To date, the biologic effects of IL-29 on human melanoma cells have not been investigated. Because this cytokine is postulated to have anti-tumor properties in other cancer cell lines (12, 14), the direct effects of IL-29 on melanoma cells were investigated. In the present report, we have characterized IL-29 induced signal transduction, gene expression, and apoptosis in melanoma cells. We also demonstrated that IL-29 can act in concert with other anti-tumor agents to enhance apoptosis of melanoma cells.
Materials and Methods
Cell lines and reagents
The A375, Hs294T, and SK MEL 5 human melanoma cell lines were purchased from the American Type Culture Collection (Manassas, VA). The 1106 MEL, 18105 MEL, MEL 39, F01, and 1174 MEL cell lines were a gift from Dr. Soldano Ferrone (Roswell Park Cancer Institute, Buffalo, NY). IL-29 was obtained from ZymoGenetics (Seattle, WA). Cell lines were grown as previously described (15). Human natural killer (NK) cells were isolated directly from fresh peripheral blood leukopacks (American Red Cross) by 25 min incubation with RossetteSep cocktail (Stem Cell Technologies, Vancouver, BC) followed by Ficoll-paque (Sigma, St. Louis, MO) density gradient centrifugation as previously described (16). NK cells were cultured in RPMI 1640 supplemented with 10% heat-inactivated pooled human AB (HAB) serum (Sigma), 100 U/ml penicillin, 100 μg/mL streptomyocin, and 0.25 μg/mL amphotericin B (17).
Flow cytometry of tumor cell lines
Intracellular flow cytometry for phosphorylated STAT1 (P-STAT1) was performed as previously described using alexafluor488-labeled antibodies (18). Briefly, total levels of Tyr701-P-STAT1 were measured by flow cytometry on a FACS Caliber (BD Bioscience, San Jose, CA). A minimum of 10,000 gated events were analyzed for each sample. Data were expressed as specific fluorescence (Fsp=Ft−Fb), where Ft represents the median value of total staining, and Fb represents the median value of background staining with an isotype control Ab (19, 20).
Immunoblot analysis
Lysates were prepared from melanoma cell lines stimulated with PBS or IL-29 and assayed for the expression of Jak-STAT and MAPK proteins by immunoblot as previously described (15, 19) with Abs to p-AKT, p-ERK, pSAPK, PARP, and P-STAT1/2/3/5 (Cell Signaling Technology, Danvers, MA) or β-actin (Sigma).
Cytotoxicity Assays
Purified human NK cells were plated in 96-well V-bottom plates in 10% HAB medium supplemented with 10–1000 ng/ml of IL-29 and incubated overnight at 37°C. 51Cr-labeled cells were added to wells at various effector: target ratios, and following a 4 hour incubation at 37°C, supernatants were harvested for quantification of chromium release. Percentage of cell lysis was determined as previously described (21).
cRNA Preparation and Array Hybridization
Probe sets from U133 Plus 2.0 Arrays (Affymetrix, Santa Clara, CA), which query approximately 47,000 human transcripts, were used in these analyses. The cRNA was synthesized as suggested by Affymetrix. Following lysis of cells in TRIzol (Invitrogen, Carlsbad, CA), total RNA was isolated by RNeasy purification (Qiagen, Valencia, CA). cDNA was generated from 2 μg of total RNA using the Superscript Choice System according to the manufacturer’s instructions (Invitrogen). Biotinylated cRNA was generated using the Bio Array High Yield RNA Transcript Labeling System (Enzo Life Sciences Inc., Farmingdale, NY). The cRNA was purified using the RNeasy RNA purification kit. cRNA was fragmented according to the Affymetrix protocol and the biotinylated cRNA was hybridized to microarrays. Raw data were collected with a GeneChip Scanner 3000 (Affymetrix) (22).
Polymerase chain reaction (PCR)
PCR analysis was conducted to detect transcripts for the IL-28R1 and IL-10R2 (the IL-29 receptor components). Briefly, total RNA was isolated using the RNeasy RNA Isolation Kit (Qiagen) and 2 μg of total cellular RNA was used as a template for RT-PCR with random hexamers (Invitrogen). The following primers were used for the PCR reaction: IL-10R2 F 5′ GGCTGAATT TGCAGATGAGCA 3′ and R 5′ GAAGACCGAGGCCATGAGG 3′; IL-28R1 F 5′ ACCTATTTTGTGGCCTATCAGAGCT 3′ and R 5′ CGGCTCCACTTCAAAAAGGTAAT 3′. The amplification scheme used was as follows: 94°C for 5 minutes, then 35 cycles of 94°C for 45 seconds, 60°C for 45 seconds, and 72°C for 45 seconds, followed by 72°C for 7 minutes and then 4°C.
Real-time PCR
Real-time PCR was used to assess gene expression in melanoma cells that had been stimulated with either PBS or IL-29 (10–1000 ng/ml) for 12 hours. cDNA was prepared as described above and then used as a template for real-time PCR using pre-designed primer/probe sets and TaqMan Universal PCR Master Mix (Applied Biosystems, Foster City, CA) according to the manufacturer’s instructions. Real-time data was analyzed using the Sequence Detector software (version 2.2; Applied Biosystems).
Proliferation Assays and Evaluation of Apoptosis
Cell proliferation was measured using the MTT assay according to manufacturer’s recommendations as previously described (23). Flow cytometric analysis of cells stained with Annexin V/Propidium Iodide staining was used to measure the percentage of apoptotic cells following various treatments (24).
In situ reverse transcription-PCR
Using the primers previously listed, seven benign nevi and eight melanoma lesions were tested for IL-10R2 and IL-28R1 mRNA expression using in situ reverse transcription PCR (RT-PCR) (25, 26). Briefly, optimal protease digestion time was determined using nonspecific incorporation of the reporter nucleotide digoxigenin dUTP. Protease digestion was followed by overnight incubation in RNase-free DNase (10 U per sample, Boehringer Mannheim, Indianapolis, IN) and one step RT PCR using the rTth system and digoxigenin dUTP. Following PCR, nitroblue tetrazolium and bromochloroindolyl phosphate (NBT/BCIP) were used to stain the tissue with nuclear fast red as the counterstain. Controls for the in situ PCR reaction included use of tissues negative for IL-28R1 and IL-10R2 (e.g. benign nevi and normal skin), omission of the primers (negative controls) and the omission of the DNase step which yields an intense nuclear-based signal in all cell types. This is due to amplification of genomic DNA that has been exposed by the protease digestion step and serves as a positive control (25, 26). Images were taken with an Olympus DP-10 camera (Olympus, Center Valley, PA) using a Nikon Labphotomat-2 microscope (Nikon, Melville, NY) and adjusted with Adobe Photoshop CS4 (Adobe, San Jose, CA).
Statistics
Linear mixed effects models were used to compare the levels of phosphorylated STAT1 (as determined by flow cytometry) for the various doses of IL-29 for each of the cell lines. Linear mixed effects models were used to model the dose-response relationship for the IL-29 and bortezomib/temozolomide combination experiments. As each experiment was run in triplicate, a random effect was included for each of the replications allowing for correlation in the response. For the combination experiments, doses were considered as categorical variables and the error was assumed linear in log(E/(1-E)) where E represents the fraction of cells surviving. Synergy was assessed via interaction contrasts at specific dose combinations. In addition, interaction indices were calculated based on Loewe additivity (27) and the median effect equation of Chou and Talalay (28). An index value of one indicates additivity of the two agents, while a value less than one indicates synergism. Fisher’s exact test was used to determine significance of IL-29R expression in melanomas as compared with benign nevi. Results were considered significant if p < 0.05.
Results
Human melanoma cell lines express IL-29 receptor transcripts
The expression of IL-28R1 and IL-10R2 was evaluated by RT-PCR in a panel of eight human melanoma cell lines. Each of the eight cell lines expressed the IL-10R2 mRNA; however, expression of the IL-28R1 subunit was variable between cell lines and was absent in the 1174 MEL cell line (Fig. 1A). These results were confirmed via semi-quantitative real-time PCR. This analysis confirmed that both receptors were expressed in all the cell lines except 1174 MEL, which showed no expression of IL-28R1, and SK MEL 5 which had very low expression of IL-28R1 (Fig. 1B). In addition, real-time PCR was used to evaluate the presence of IL-10R1 and IL-20R1, receptors co-expressed with IL-10R2. Both receptors were found to be present in all 8 melanoma cell lines (data not shown).
Fig. 1.


Melanoma cell lines express components of the IL-29 receptor. (A) mRNA expression of the IL-29 receptor (IL-10R2 and IL-28R1) was evaluated using RT-PCR. 18s was used as a housekeeping gene. (B) mRNA levels were measured by real-time PCR for the expression of the IL-10R2 and IL-28R1on the same cell lines and expression was calculated relative to 18s. The graph depicts a representative experiment of n=2. Columns; mean of triplicate wells, bars; SD.
IL-29 induces Jak-STAT signal transduction in melanoma cells
Melanoma cell lines were stimulated with IL-29 and the activation of downstream signal transduction pathways was evaluated. Following stimulation of melanoma cell lines for 20 minutes with IL-29 (10–1000 ng/ml), phosphorylation of STAT1 (at Tyr 701) and STAT2 (Tyr 690) was induced in all the cell lines tested that expressed both IL-29R components (Fig. 2A). IL-29 induced phosphorylation of STAT1 was confirmed using intracellular flow cytometry (Fig. 2B and Fig. 2C). STAT1 and STAT2 phosphorylation in response to IL-29 was variable across the individual melanoma cell lines. For example, the 1106 MEL cell line exhibited strong induction of P-STAT1 and P-STAT2 following IL-29 treatment, while the A375 cell line required high doses of IL-29 to elicit maximal phosphorylation of STAT1 and STAT2. There was a statistically significant increase in P-STAT1 signaling in the 1106 MEL (p=0.0003), A375 (p=0.0014), and F01 cell lines (p=0.0379) following treatment with 1000 ng/ml IL-29 as compared to media treatment. There was no significant increase in Jak-STAT signaling in the 1174 MEL cell line in response to any dose of IL-29 which is consistent with its lack of the IL-28R1.
Fig. 2.


Melanoma cell lines signal via the Jak-STAT pathway. (A) The human melanoma cell lines 1106 MEL, A375, F01, and 1174 MEL cells were treated with IFN-α at 104 units/ml or IL-29 at 10, 100, or 1000 ng/ml and evaluated by immunoblot analysis for P-STAT1/2/3/5. Membranes were probed with β-actin antibody as a loading control. Human melanoma cell lines 1106 MEL, A375, F01, and 1174 MEL were stimulated with increasing doses of IL-29 (0–1000 ng/ml) for 30 minutes at 37°C and cells were evaluated for P-STAT1 by intracellular flow cytometry. Fluorescence data are presented as Fsp intensity of P-STAT1 staining (Fsp=Ft−Fb). (B) Representative histograms for a single experiment and (C) graph for all cell lines evaluated. Columns; mean from a single experiment, bars; SD. (D) Protein levels of pAKT, pERK, and pSAPK were measured by immunoblot analysis after no treatment (0), or treatment with PMA (50 ng/mL), or IL-29 (10, 100, 1000 ng/mL).
Basal phosphorylation of the STAT3 and STAT5 transcription factors is common in melanoma cell lines and is thought to contribute to the oncogenic phenotype (29–33). As expected, there was basal phosphorylation of STAT3 in all of the cell lines except for 1106 MEL (20). However, in contrast to stimulation with IFN-α, stimulation of cells with IL-29 did not lead to a further increase in P-STAT3 except in the 1106 MEL cell line. Phosphorylation of STAT5 in response to IL-29 treatment was also observed in the 1106 MEL and 1174 MEL cell lines. Although 1174 MEL lacks the IL-28R1 component it does express the IL-10R2 subunit. We hypothesize that the interaction of IL-10R2 component and other cytokine receptor components such as IL-10R1 or IL-20R1 may have led to the increased phosphorylation of STAT5. The ability of IL-29 to modulate the activation of AKT, extracellular signal-regulated kinase (ERK), and stress-activated protein kinase/Jun-amino-terminal kinase (SAPK/JNK) was also investigated in this panel of melanoma cell lines. There was no activation of these pathways irrespective of the dose of IL-29 employed (Fig. 2D).
Microarray analysis of IL-29 induced gene expression
Microarray analysis was conducted to determine the transcriptional profile of melanoma cells following IL-29 stimulation. The 1106 MEL cell line was stimulated for 5 or 18 hr with IL-29 (10 and 1000 ng/ml) or PBS (control). The predominant genes expressed in response to IL-29 stimulation were IFN-stimulated genes (ISGs) (e.g., Mx1, OAS, IFI27) (Table 1). This is consistent with prior studies conducted in IL-29-stimulated somatic cells (34). The number of genes induced increased both with increasing dose of IL-29 and with increasing duration of treatment. At the 18 hr time point there was up-regulation of 60 genes as compared to the 41 genes that were up-regulated at the 5 hr time point. For example, in response to a 5 hr treatment with IL-29 at doses of 10 and 1000 ng/ml expression of radical s-adenosyl methionine domain containing protein 2 (RSAD2) increased by 21.1- and 48.5-fold, respectively, as compared to 19.7- and 84.4-fold following an 18 hr treatment. In response to a 5 hr treatment with 10 and 1000 ng/ml IL-29, expression of 2′-5′-oligoadenylate synthetase 2 (OAS2) increased by 5.3- and 11.3-fold, respectively, as compared to 27.9- and 64-fold at 18 hr. In addition, IL-29 induced the expression of multiple ISGs that regulate transcription and apoptosis (e.g. MX1, IFI6, IFITM1, Pric 285, TLX2, IRF9, IRF7).
Table 1.
Genes up-regulated in response to IL-29 Guenterberg et al.
| Time (Hr) | 5 | 5 | 18 | 18 | |
|---|---|---|---|---|---|
| IL-29 Dose (ng/ml) | 10 | 1000 | 10 | 1000 | |
| Gene | Function | Fold Change | |||
| IFI27 | Immune response | - | 32 | 168.9 | 415.9 |
| RSAD2 | Viral Response | 21.1 | 48.5 | 19.7 | 84.4 |
| DMGDH | Electron Transport, Glycine Catabolic Process | - | - | - | 73.5 |
| IFI44L | Unknown | 7.5 | 11.3 | 34.3 | 64 |
| IFIT1 | Immune response | 22.6 | 48.5 | 32 | 64 |
| OAS2 | Immune response, nucleic acid metabolism | 5.3 | 11.3 | 27.9 | 64 |
| MX1 | Regulation of Apoptosis, immune response | 7.5 | 12.1 | 27.9 | 52 |
| EPSTI1 | Unknown | 2.8 | 6.1 | 21.1 | 42.2 |
| OAS1 | Antiviral response, nucleosidase | 5.7 | 9.2 | 15 | 32 |
| DDX58 | Helicase, Deoxyribonuclease, Ubiquitin Pathway | 5.3 | 11.3 | 10.6 | 26 |
| ISG15 | Immune response | 3 | 5.7 | 13 | 26 |
| IFI6 | Regulator of Apoptosis, immune response | 3.5 | 5.3 | 14.9 | 21.1 |
| IFIT3 | Immune response | 4.3 | 7.4 | 8 | 19.7 |
| IFITM1 | Immune response, negative regulation of proliferation | 2.3 | 3.5 | 10.6 | 19.7 |
| PRIC285 | Regulation of transcription | 4 | 8.6 | 10.6 | 18.4 |
| SULT1C2 | Amine Metabolic Process | - | - | - | 18.4 |
| OASL | Immune response, nucleic acid metabolism | - | 4.6 | 5.3 | 16 |
| XAF1 | Zinc Ion Binding | 4.6 | 11.3 | 7 | 16 |
| TMPRSS3 | Proteolysis, Sensory Reception | - | - | 18.4 | 15 |
| LOC129607 | dTDP/dTTP biosynthetic process | 2.3 | 4 | 5.3 | 13 |
| IFIH1 | Helicase, Deoxyribonuclease | 2.8 | 5.3 | 4.9 | 12.1 |
| HFE2 | GPI Anchor Binding | - | - | - | 11.3 |
| RTP4 | Sensory Reception | - | 3.2 | 5.7 | 11.3 |
| SAMD9L | Unknown | 5.3 | 6.1 | 5.3 | 11.3 |
| PARP9 | Protein ADP Ribosylation, Cell Migration | 3 | 4.3 | 6.1 | 10.6 |
| CCNC | Cell Cycle Regulation | - | - | - | 9.8 |
| IFIT2 | Immune response | - | 3.7 | 3.5 | 9.8 |
| TLX2 | Regulation of Transcription, Negative Regulation of Dendrite Morphogenesis | - | - | - | 9.8 |
| FLJ20035 | Nucleic Acid Binding, Helicase Activity | 2 | 2.5 | 5.7 | 9.2 |
| IRF9 | Regulation of Transcription, Immune Response, Viral Response | 5.7 | 7.5 | 8 | 9.2 |
| STAT1 | Transcription factor, JAK-STAT pathway | 2.6 | 3.5 | 5.3 | 9.2 |
| ACOT11 | Intracellular Signaling Cascade, Response to Temperature Stimulus | - | - | - | 8.6 |
| HERC5 | Regulation of cyclin dependent protein kinase activity, Ubiquitin Pathway | - | 2.3 | 3.5 | 8.6 |
| IRF7 | Transcription factor, antiviral response, Apoptosis | 2.5 | 3.2 | 4.6 | 8.6 |
| TRIM22 | Regulation of Transcription, Immune Response, Response to Virus | - | 2.3 | 3 | 8.6 |
| USP18 | Ubiquitin-dependent protein catabolism | - | 3 | 4 | 8.6 |
| FAM125A | Unknown | - | 2.3 | 4.3 | 7.5 |
| HERC6 | Ubiquitin-protein ligase | - | 2.8 | 4.9 | 7.5 |
| HTRA4 | Proteolysis | - | - | - | 7 |
| IFI44 | Antiviral response | 2.1 | 4.9 | 4.3 | 7 |
| OAS3 | Immune response, nucleosidase | - | 2.6 | 4.6 | 7 |
| LOC646756 | Unknown | - | - | - | 6.5 |
| LBA1 | DNA Repair | - | - | 3 | 6.1 |
| BATF2 | Regualtion of Transcription | - | 2.6 | 2.8 | 5.7 |
| TIPARP | Protein AA ADP-Ribosylation | - | - | - | 5.7 |
| PARP14 | regulation of transcription | - | 2.6 | 3 | 5.3 |
| PLSCR1 | Phospholipid scramblase, platelet activation | 2 | 2.8 | 3.5 | 5.3 |
| SAMHD1 | Immune response | - | 2 | 10.6 | 5.3 |
| SAMD9 | Unknown | 2 | 2.5 | 2.6 | 4.9 |
| ZPLD1 | Unknown | - | - | - | 4.9 |
| BST2 | Immune response, cell-cell signaling, cell proliferation, regulator of I-kappaB kinase/NF-kappa B caspase | - | - | 2.8 | 4.6 |
| SP110 | Regulation of transcription, transcription factor | - | 2 | 2.8 | 4.6 |
| DTX3L | Protein bining | - | 2.5 | 3 | 4.3 |
| CTCFL | Negative regulation of cell cycle progression | - | - | - | 4 |
| CXCL10 | Chemotaxis, monocyte stimulation | - | - | - | 4 |
| DCDC2 | Neuron migration, cellular defense, intracellular signaling | - | - | - | 4 |
| FBN2 | Embryonic/anatomic limb morphogenesis | - | - | - | 4 |
| PARP12 | Protein amino acid ADP-ribosylation | - | - | 2.6 | 4 |
| RNF103 | CNS development | - | - | - | 4 |
IL-29 Induced IFN Stimulated Gene expression
Real-time PCR was performed on three melanoma cell lines to confirm the expression of genes that were most strongly induced by IL-29 on microarray analysis. There was a marked increase in the expression of IFI27, RSAD2, OAS1/2, DDX58, ISG15, IFI6, IFIT3, IFTM1, and Mx1 in response to 10–1000 ng/ml IL-29 for the 1106 MEL, A375, and F01 cell lines (Fig. 3A and Fig. 3B). Based on previous studies showing that overexpression of SOCS-1 protein in neuroendocrine and hepatoma cells abrogate IL-29 induced Jak-STAT signaling (12, 13), the expression of SOCS genes was tested. SOCS-1 was up-regulated 2.0-fold in the F01 cell line in response to IL-29 and SOCS-4 was down-regulated by 0.5-fold. SOCS-6 was induced by 1.0-fold to 1.6 fold in all cell lines (Fig. 3B).
Fig. 3.
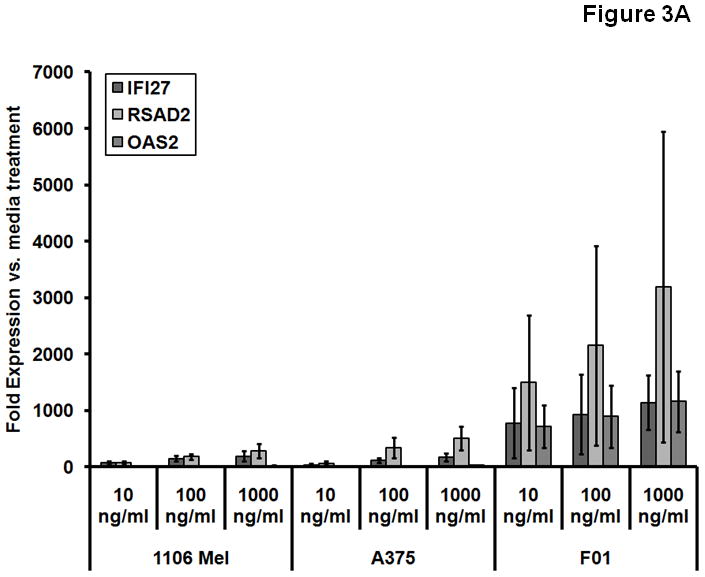

IL-29 induces transcription and protein expression of IFN-stimulated genes. Transcript levels of various genes were measured using real-time PCR analysis after the treatment of 1106 MEL, A375, and F01 human melanoma cell lines with IL-29 at 10–1000 ng/ml for 12 hours (A) or 1000 ng/ml for 12 hours (B). Columns; mean from three separate experiments, bars; SD.
IL-29 does not enhance NK cell cytotoxicity against melanoma target cells
Since immune effector cells are known to express the IL-28R1 and IL-10R2 and respond to IL-29, we postulated that this cytokine could potentially prime NK cells to mediate enhanced lysis of tumor cells. To test this hypothesis, NK cells were treated overnight with IL-29 and tested for their ability to lyse a panel of three melanoma tumor cell lines in a standard 4 hour 51Cr release assay. IL-29 did not enhance NK cytotoxic activity in this setting, despite the fact that NK cells were found to express both the IL-10R2 and IL-28R1 and induce Jak-STAT signal transduction (data not shown). Similar results were found with IL-29 treated peripheral blood mononuclear cells (PBMCs) against the F01 cell line. In addition, melanoma cells pre-treated with 1000 ng/ml of IL-29 exhibited no change in their susceptibility to NK cell mediated cytotoxicity (data not shown).
IL-29 induced apoptosis of melanoma cells is enhanced in the presence of bortezomib (a proteasome inhibitor) or temozolomide
There was no change in the proliferation of melanoma cell lines following a 24–72 hour treatment with IL-29 (10–1000 ng/ml) as assessed by either the MTT or [H3]thymidine incorporation methods (data not shown). The ability of IL-29 to induce apoptosis was next assessed in the F01 melanoma cell line. Flow cytometric analysis by Annexin V/Propidium Iodide staining revealed a dose-dependent increase in apoptosis in response to 48 hour treatment with IL-29 (Fig. 4A). Based on previous work showing that proteasome inhibition could enhance the pro-apoptotic effects of IFN-α in melanoma cells (24), the apoptosis of F01 cells was measured following treatment with IL-29 in combination with bortezomib. As expected, IL-29-induced apoptosis was enhanced following exposure to bortezomib (Fig. 4B). Chou and Talalay interaction indices were calculated for the combination of IL-29 and bortezomib (index values=0.36–1.03). At the 20 nM dose of Bortezomib this combination induced synergistic apoptosis of F01 cells which was statistically significant (p < 0.018 for all dose levels). For example, IL-29 at 10 ng/ml induced 8.8% apoptosis and bortezomib at 20 nM induced 50% apoptosis, whereas the combination caused apoptosis in 83% of the cells. Apoptosis was enhanced in response to these treatment combinations as confirmed by immunoblot analysis for the presence of cleaved PARP (Fig. 4C). A similar synergistic apoptotic effect was observed following treatment of F01 cells with temozolomide plus IL-29 (Fig. 4D). Synergistic apoptosis occurred with IL-29 at concentrations of 100 and 1000 ng/ml at all doses of temozolomide (all interaction contrast p-values < 0.003, interaction indices = 0.003–0.18). For example, single agent IL-29 at 1000 ng/ml caused 15.2% apoptosis and single agent temozolomide at 150 μM caused 15.7% apoptosis. The combination resulted in 52.2% apoptosis, which was greater than the combined effects of both agents. Marginally significant synergy took place in response to IL-29 at 10 ng/ml and temozolomide at 50, 100, and 150 μM (all interaction contrast p-values < 0.056, interaction indices = 0.03–0.82).
Fig. 4.


IL-29 treatment with and without chemotherapy increases apoptosis in the human melanoma cell line F01. (A) The pro-apoptotic effects of IL-29 were evaluated by Annexin V/PI staining in the human melanoma cell line F01 after a 48 hour treatment. Columns; mean from three separate experiments, bars; SEM. (B) F01 cells were cultured with IL-29 (10–1000 ng/ml) combined with bortezomib (10–20 nM) for 48 h. Cells treated with PBS served as a negative control in each assay. Apoptosis was measured using Annexin V/PI staining. Columns, mean of three separate experiments; bars, SEM. (C) Lysates from IL-29 and bortezomib stimulated F01 cells were evaluated for PARP cleavage expression via immunoblot analysis. β-actin served as a loading control. (D) Similarly, treatment with temozolomide (0–150 μM) and IL-29 (100–1000 ng/ml) at 48 h led to synergistic apoptosis as measured by Annexin V/PI staining. Columns; mean from three separate experiments, bars; SEM.
Primary melanomas express the IL-29 receptor
Paraffin-embedded tissue samples of benign nevi and primary melanoma lesions were evaluated for expression of the IL-29R components by in situ PCR (Fig. 5). Seven benign nevi were examined and all were negative for both components of the IL-29R. Six of eight primary melanoma lesions were positive for both receptor components and two primaries were negative for both components of the IL-29R (p=0.007 versus benign nevi). The signal localized primarily to the cytoplasm of the neoplastic cells.
Fig. 5.

Melanoma cells show increased transcription of the IL-29 receptors. The cDNA of the mRNA of IL-10R2 and IL-28R1 were detected via in situ PCR amplification. Benign nevi were negative for IL-10R2 and IL-28R1. Cytoplasmic signal for IL-10R2 and IL-28R1 were present in melanoma lesions but not in benign nevi. Magnification, 40x, scale bars = 25 microns. Left column, receptor staining. Right column, negative control.
Discussion
In the present study it was demonstrated that the receptor components needed for IL-29 signal transduction are present on several human melanoma cell lines. In cells with intact IL-29R signaling machinery (IL-28R1 and IL-10R2), IL-29 treatment led to phosphorylation of STAT1 and STAT2 and an increase in the expression of genes involved with the anti-viral response, immune response, and regulation of transcription. IL-29-induced apoptosis in a melanoma cell line was synergistically enhanced following the addition of temozolomide or bortezomib. Additionally, the receptor for IL-29 was found to be present on human melanoma primaries but not on benign nevi.
The receptor components for IL-29 are present on dendritic cells, T cells, intestinal epithelial cells, and several human cancer cell lines (6–12). Brand et al. evaluated signal transduction of intestinal epithelial cells stimulated with IL-29. They found that IL-29 activated the ERK-1/2, SAPK/c-JUN, AKT, and Jak-STAT pathways (6, 8). Other authors have demonstrated Jak-STAT pathway signaling in neuroendocrine tumors (12), human keratinocytes (35), and hepatoma cells following treatment with IL-29 (9, 36). In a murine model, Sommereyns et al. found that IFN-λ (mouse ortholog of IL-29) was strongly induced in the liver in response to viral infections. They also demonstrated that mice with systemic viral infections expressed IFN-λ and this resulted in a marked increase in IFN-stimulated genes in the stomach, intestines, and lungs (37). The present manuscript is the first to report the presence of the IL-29R in human melanoma cells and delineate the signal transduction pathways that are initiated in response to this cytokine. The induction of P-STAT1, P-STAT2, P-STAT3, and P-STAT5 in response to IL-29 suggests a complex yet robust effect. The lack of MAP-kinase activation in IL-29-treated melanoma cells was unexpected and is being confirmed in additional cell lines.
Prior studies have evaluated the response of lymphoma and hepatocellular carcinoma cells to IL-29 stimulation via microarray analysis and have shown an up-regulation of multiple ISGs (9, 38). Using Affymetrix S130 high-density microarray chip analysis, Zhou et al. demonstrated lower induction of ISGs in IFN-λ-stimulated Raji cells (10 ng/ml) compared to IFN-α stimulated cells (38). In contrast, ISG induction by IL-29 was stronger than that of IFN-α in a human HCV-transfected hepatoma cells (36). Our studies demonstrated an increase in anti-viral proteins such as OAS and Mx1 along with many other immune and anti-proliferative proteins. A prior study by our group evaluating the effects of high-dose IFN-α treatment on the expression levels of genes in PBMCs of patients with malignant melanoma demonstrated a pattern of gene induction that was similar to that observed in the present study (39). These results lend support to the idea that IL-29 and IFN-α induce a similar set of genes and therefore could have similar anti-tumor effects. Several studies have shown that type III IFNs and IFN-α have overlapping anti-viral activity (9, 14, 40, 41). Overall, the anti-viral effects of IL-29 are slower in onset, weaker, and last longer than those of IFN-α (7, 35, 36). IL-29 acts in an additive manner when combined with IFN-α in blocking the replication of vesicular stomatitis and HCV (42). The precise role of IL-29 in host anti-tumor responses and immune surveillance has yet to be defined in the context of malignant melanoma, but the available data suggest that its effects are similar to those of IFN-α. Studies by other groups have demonstrated that IL-29 inhibits proliferation in glioblastoma cells (7) and both inhibits proliferation and induces apoptosis in a human neuroendocrine cell line (12). Whether IL-29 has unique anti-tumor effects or can exert additive effects with IFN-α in the setting of malignant melanoma is currently under investigation.
Only a limited amount of in vivo work has been performed to evaluate the effects of IL-29 in melanoma. In a transient transfection model, Sato and colleagues demonstrated that over-expression of the murine IFN-λ receptor ligand in B16F10 cells caused increased expression of MHC Class I. Additionally, they found that the transfected cell line had lower levels of proliferation and exhibited significantly enhanced activation of caspase 3 and caspase 7 at 36 hours. The induction of p21 and dephosphorylation of Rb was also enhanced (as compared to mock transfected cells) (41). Administration of IFN-λ-expressing B16F10 cells to mice via tail vein injection led to decreased pulmonary metastases at 14 days and reduced mortality as compared to control mice. This effect was dependent on NK cells, but not CD4+ and CD8+ T-cells (41). In a separate study, Sato et al. showed that systemic overexpression of IFN-λ by hydrodynamic injection of IFN-λ cDNA resulted in increased numbers of NK and NKT cells in the livers of mice and resulted in anti-tumor activity against a colon cancer cell line (41). The applicability of these findings to the clinical situation is unclear as there are no reports of IL-29 being produced by human melanoma cells, although it might be present in the tumor microenvironment under certain conditions. Our analysis of primary melanomas indicates that these lesions routinely express the receptor components for IL-29 and would likely respond to IL-29 treatment with the induction of ISG transcription.
Like IFN-α, IL-29 activates several components of the immune system. IL-29 stimulates monocytes and macrophages to release cytokines (e.g., IL-6, IL-8, and IL-10) resulting in a shift from a type two T helper cell response to a type one T helper cell response (11). Similarly, exposure of LPS-treated monocytes to IL-29 enhances the release of IL-12 (43, 44). IFN-λ treatment resulted in increased expression of the MHC class I proteins in human keratinocyte and murine melanoma cell lines (14, 41), an effect which could enhance their recognition by T cells. Of note, IL-29 treatment of NK cells did not enhance their cytotoxicity against melanoma cells nor did IL-29 treatment of melanoma target cells render them more susceptible to lysis by NK cells (data not shown).
We hypothesized that IL-29 could render melanoma cells more susceptible to pro-apoptotic therapies such as chemotherapy or radiation therapy. Temozolomide has documented activity against metastatic melanoma and bortezomib has been tested in this setting as well (24, 45). IL-29 enhanced the apoptotic effects of both drugs which suggests that combination therapies might be clinically effective. Of note, not all melanoma cell lines responded equally well to these combinations. Additional studies are underway to determine the cause of this variation.
We have shown that the receptor for IL-29 is expressed on melanoma cell lines and that activation with this cytokine leads to Jak-STAT signal transduction, expression of multiple genes, and an increase in apoptosis. The addition of either bortezomib or temozolomide resulted in a synergistic enhancement of apoptosis. Primary melanomas demonstrated increased expression of the genes for the IL-29R as compared with benign nevi. The present data suggest that the IL-29 can exert direct effects on melanoma cells.
Acknowledgments
We thank the Ohio State University Comprehensive Cancer Center Analytic Cytometry, Centers for Biostatistics, Microarray, and the Nucleic Acid Shared Resources for their assistance.
This work was supported by NIH Grants P01 CA95426 (M. Caligiuri), P30 CA16058 (M. Caligiuri), CA84402, K24 CA93670 (W.E. Carson, III); K22 CA134551 (G.B. Lesinski), The Valvano Foundation for Cancer Research (G.B. Lesinski), T32 CA009338.
Abbreviations List
- IFN
Interferon
- STAT
Signal Transducer and Activator of Transcription
- IL-29
Interleukin-29
- JAK
Janus kinase
- ISG
Interferon Stimulated Gene
References
- 1.Belardelli F, Ferrantini M, Proietti E, Kirkwood JM. Interferon-alpha in tumor immunity and immunotherapy. Cytokine Growth Factor Rev. 2002;13:119–34. doi: 10.1016/s1359-6101(01)00022-3. [DOI] [PubMed] [Google Scholar]
- 2.Kim SH, Cohen B, Novick D, Rubinstein M. Mammalian type I interferon receptors consists of two subunits: IFNaR1 and IFNaR2. Gene. 1997;196:279–86. doi: 10.1016/s0378-1119(97)00240-0. [DOI] [PubMed] [Google Scholar]
- 3.Haque SJ, Williams BR. Signal transduction in the interferon system. Semin Oncol. 1998;25:14–22. [PubMed] [Google Scholar]
- 4.Darnell JE, Jr, Kerr IM, Stark GR. Jak-STAT pathways and transcriptional activation in response to IFNs and other extracellular signaling proteins. Science. 1994;264:1415–21. doi: 10.1126/science.8197455. [DOI] [PubMed] [Google Scholar]
- 5.Dumoutier L, Lejeune D, Hor S, Fickenscher H, Renauld JC. Cloning of a new type II cytokine receptor activating signal transducer and activator of transcription (STAT)1, STAT2 and STAT3. Biochem J. 2003;370:391–6. doi: 10.1042/BJ20021935. [DOI] [PMC free article] [PubMed] [Google Scholar]
- 6.Kotenko SV, Gallagher G, Baurin VV, et al. IFN-lambdas mediate antiviral protection through a distinct class II cytokine receptor complex. Nat Immunol. 2003;4:69–77. doi: 10.1038/ni875. [DOI] [PubMed] [Google Scholar]
- 7.Meager A, Visvalingam K, Dilger P, Bryan D, Wadhwa M. Biological activity of interleukins-28 and -29: comparison with type I interferons. Cytokine. 2005;31:109–18. doi: 10.1016/j.cyto.2005.04.003. [DOI] [PubMed] [Google Scholar]
- 8.Brand S, Beigel F, Olszak T, et al. IL-28A and IL-29 mediate antiproliferative and antiviral signals in intestinal epithelial cellsand murine CMV infection increases colonic IL-28A expression. Am J Physiol Gastrointest Liver Physiol. 2005;289:G960–8. doi: 10.1152/ajpgi.00126.2005. [DOI] [PubMed] [Google Scholar]
- 9.Doyle SE, Schreckhise H, Khuu-Duong K, et al. Interleukin-29 uses a type 1 interferon-like program to promote antiviral responses inhuman hepatocytes. Hepatology. 2006;44:896–906. doi: 10.1002/hep.21312. [DOI] [PubMed] [Google Scholar]
- 10.Mennechet FJ, Uze G. Interferon-lambda-treated dendritic cells specifically induce proliferation of FOXP3-expressing suppressor T cells. Blood. 2006;107:4417–23. doi: 10.1182/blood-2005-10-4129. [DOI] [PubMed] [Google Scholar]
- 11.Dai J, Megjugorac NJ, Gallagher GE, Yu RY, Gallagher G. IFN-{lambda}1 (IL-29) inhibits GATA3 expression and suppresses Th2 responses in human naive and memory T cells. Blood. doi: 10.1182/blood-2008-09-179507. Epub 2009 Apr 3. [DOI] [PubMed] [Google Scholar]
- 12.Zitzmann K, Brand S, Baehs S, et al. Novel interferon-lambdas induce antiproliferative effects in neuroendocrine tumor cells. Biochem Biophys Res Commun. 2006;344:1334–41. doi: 10.1016/j.bbrc.2006.04.043. [DOI] [PubMed] [Google Scholar]
- 13.Brand S, Zitzmann K, Dambacher J, et al. SOCS-1 inhibits expression of the antiviral proteins 2′, 5′-OAS and MxA induced by the novel interferon-lambdas IL-28A and IL-29. Biochem Biophys Res Commun. 2005;331:543–8. doi: 10.1016/j.bbrc.2005.04.004. [DOI] [PubMed] [Google Scholar]
- 14.Lasfar A, Lewis-Antes A, Smirnov SV, et al. Characterization of the mouse IFN-lambda ligand-receptor system: IFN-lambdas exhibit antitumor activity against B16 melanoma. Cancer Res. 2006;66:4468–77. doi: 10.1158/0008-5472.CAN-05-3653. [DOI] [PubMed] [Google Scholar]
- 15.Lesinski GB, Badgwell B, Zimmerer J, et al. IL-12 pretreatments enhance IFN-alpha-induced Janus kinase-STAT signaling and potentiate the antitumor effects of IFN-alpha in a murine model of malignant melanoma. J Immunol. 2004;172:7368–76. doi: 10.4049/jimmunol.172.12.7368. [DOI] [PubMed] [Google Scholar]
- 16.Kondadasula SV, Roda JM, Parihar R, et al. Colocalization of the IL-12 receptor and FcgammaRIIIa to natural killer cell lipid rafts leads to activation of ERK and enhanced production of interferon-gamma. Blood. 2008;111:4173–83. doi: 10.1182/blood-2007-01-068908. [DOI] [PMC free article] [PubMed] [Google Scholar]
- 17.Roda JM, Joshi T, Butchar JP, et al. The activation of natural killer cell effector functions by cetuximab-coated, epidermal growth factor receptor positive tumor cells is enhanced by cytokines. Clin Cancer Res. 2007;13:6419–28. doi: 10.1158/1078-0432.CCR-07-0865. [DOI] [PubMed] [Google Scholar]
- 18.Lesinski GB, Benninger K, Kreiner M, Quimper M, Young G, Carson WE., 3rd Bortezomib pre-treatment prolongs interferon-alpha-induced STAT1 phosphorylation in melanoma cells. Cancer Immunol Immunother. doi: 10.1007/s00262-009-0710-y. Epub 2009 Apr 26. [DOI] [PMC free article] [PubMed] [Google Scholar]
- 19.Lesinski GB, Kondadasula SV, Crespin T, et al. Multiparametric flow cytometric analysis of inter-patientvariation in STAT1 phosphorylation following interferon Alfa immunotherapy. J Natl Cancer Inst. 2004;96:1331–42. doi: 10.1093/jnci/djh252. [DOI] [PubMed] [Google Scholar]
- 20.Lesinski GB, Trefry J, Brasdovich M, et al. Melanoma cells exhibit variable signal transducer and activator of transcription 1 phosphorylation and a reduced response to IFN-alpha compared with immune effector cells. Clin Cancer Res. 2007;13:5010–9. doi: 10.1158/1078-0432.CCR-06-3092. [DOI] [PubMed] [Google Scholar]
- 21.Roda JM, Parihar R, Lehman A, Mani A, Tridandapani S, Carson WE., 3rd Interleukin-21 enhances NK cell activation in response to antibody-coated targets. J Immunol. 2006;177:120–9. doi: 10.4049/jimmunol.177.1.120. [DOI] [PubMed] [Google Scholar]
- 22.Zimmerer JM, Lesinski GB, Ruppert AS, et al. Gene expression profiling reveals similarities between the in vitro and in vivo responses of immune effector cells to IFN-alpha. Clin Cancer Res. 2008;14:5900–6. doi: 10.1158/1078-0432.CCR-08-0846. [DOI] [PMC free article] [PubMed] [Google Scholar]
- 23.Andersen BL, Farrar WB, Golden-Kreutz DM, et al. Psychological, behavioral, and immune changes after a psychological intervention: a clinical trial. J Clin Oncol. 2004;22:3570–80. doi: 10.1200/JCO.2004.06.030. [DOI] [PMC free article] [PubMed] [Google Scholar]
- 24.Lesinski GB, Raig ET, Guenterberg K, et al. IFN-alpha and bortezomib overcome Bcl-2 and Mcl-1 overexpression in melanoma cells by stimulating the extrinsic pathway of apoptosis. Cancer Res. 2008;68:8351–60. doi: 10.1158/0008-5472.CAN-08-0426. [DOI] [PMC free article] [PubMed] [Google Scholar]
- 25.Nuovo G, Lee EJ, Lawler S, Godlewski J, Schmittgen T. In situ detection of mature microRNAs by labeled extension on ultramer templates. Biotechniques. 2009;46:115–26. doi: 10.2144/000113068. [DOI] [PMC free article] [PubMed] [Google Scholar]
- 26.Nuovo GJ. In situ detection of precursor and mature microRNAs in paraffin embedded, formalin fixed tissues and cell preparations. Methods. 2008;44:39–46. doi: 10.1016/j.ymeth.2007.10.008. [DOI] [PubMed] [Google Scholar]
- 27.Loewe S, Muischnek H. Effect of combinations: mathematical basis of problem. Arch Exp Pathol Pharmakol. 1926;114:313–26. [Google Scholar]
- 28.Chou TC, Talalay P. Quantitative analysis of dose-effect relationships: the combined effects of multiple drugs or enzyme inhibitors. Adv Enzyme Regul. 1984;22:27–55. doi: 10.1016/0065-2571(84)90007-4. [DOI] [PubMed] [Google Scholar]
- 29.Burdelya L, Kujawski M, Niu G, et al. Stat3 activity in melanoma cells affects migration of immune effector cells and nitric oxide-mediated antitumor effects. J Immunol. 2005;174:3925–31. doi: 10.4049/jimmunol.174.7.3925. [DOI] [PMC free article] [PubMed] [Google Scholar]
- 30.Wang T, Niu G, Kortylewski M, et al. Regulation of the innate and adaptive immune responses by Stat-3 signaling in tumor cells. Nat Med. 2004;10:48–54. doi: 10.1038/nm976. [DOI] [PubMed] [Google Scholar]
- 31.Wellbrock C, Weisser C, Hassel JC, et al. STAT5 contributes to interferon resistance of melanoma cells. Curr Biol. 2005;15:1629–39. doi: 10.1016/j.cub.2005.08.036. [DOI] [PubMed] [Google Scholar]
- 32.Xie TX, Huang FJ, Aldape KD, et al. Activation of stat3 in human melanoma promotes brain metastasis. Cancer Res. 2006;66:3188–96. doi: 10.1158/0008-5472.CAN-05-2674. [DOI] [PubMed] [Google Scholar]
- 33.Xie TX, Wei D, Liu M, et al. Stat3 activation regulates the expression of matrix metalloproteinase-2 and tumor invasion and metastasis. Oncogene. 2004;23:3550–60. doi: 10.1038/sj.onc.1207383. [DOI] [PubMed] [Google Scholar]
- 34.Uze G, Monneron D. IL-28 and IL-29: newcomers to the interferon family. Biochimie. 2007;89:729–34. doi: 10.1016/j.biochi.2007.01.008. [DOI] [PubMed] [Google Scholar]
- 35.Maher SG, Sheikh F, Scarzello AJ, et al. IFN-alpha and IFN-lambda differ in their antiproliferative effects and duration of JAK/STAT signaling activity. Cancer Biol Ther. 2008;7:1–16. doi: 10.4161/cbt.7.7.6192. [DOI] [PMC free article] [PubMed] [Google Scholar]
- 36.Marcello T, Grakoui A, Barba-Spaeth G, et al. Interferons alpha and lambda inhibit hepatitis C virus replication with distinct signal transduction and gene regulation kinetics. Gastroenterology. 2006;131:1887–98. doi: 10.1053/j.gastro.2006.09.052. [DOI] [PubMed] [Google Scholar]
- 37.Sommereyns C, Paul S, Staeheli P, Michiels T. IFN-lambda (IFN-lambda) is expressed in a tissue-dependent fashion and primarily acts on epithelial cells in vivo. PLoS Pathog. 2008;4:1–12. doi: 10.1371/journal.ppat.1000017. [DOI] [PMC free article] [PubMed] [Google Scholar]
- 38.Zhou Z, Hamming OJ, Ank N, Paludan SR, Nielsen AL, Hartmann R. Type III interferon (IFN) induces a type I IFN-like response in a restricted subset of cells through signaling pathways involving both the Jak-STAT pathway and the mitogen-activated protein kinases. J Virol. 2007;81:7749–58. doi: 10.1128/JVI.02438-06. [DOI] [PMC free article] [PubMed] [Google Scholar]
- 39.Zimmerer JM, Lehman AM, Ruppert AS, et al. IFN-alpha-2b-induced signal transduction and gene regulation in patient peripheral blood mononuclear cells is not enhanced by a dose increase from 5 to 10 megaunits/m2. Clin Cancer Res. 2008;14:1438–45. doi: 10.1158/1078-0432.CCR-07-4178. [DOI] [PubMed] [Google Scholar]
- 40.Sheppard P, Kindsvogel W, Xu W, et al. IL-28, IL-29 and their class II cytokine receptor IL-28R. Nat Immunol. 2003;4:63–8. doi: 10.1038/ni873. [DOI] [PubMed] [Google Scholar]
- 41.Sato A, Ohtsuki M, Hata M, Kobayashi E, Murakami T. Antitumor activity of IFN-lambda in murine tumor models. J Immunol. 2006;176:7686–94. doi: 10.4049/jimmunol.176.12.7686. [DOI] [PubMed] [Google Scholar]
- 42.Pagliaccetti NE, Eduardo R, Kleinstein SH, Mu XJ, Bandi P, Robek MD. Interleukin-29 functions cooperatively with interferon to induce antiviral gene expression and inhibit hepatitis C virus replication. J Biol Chem. 2008;283:30079–89. doi: 10.1074/jbc.M804296200. [DOI] [PMC free article] [PubMed] [Google Scholar]
- 43.Jordan WJ, Eskdale J, Boniotto M, Rodia M, Kellner D, Gallagher G. Modulation of the human cytokine response by interferon lambda-1 (IFN-lambda1/IL-29) Genes Immun. 2007;8:13–20. doi: 10.1038/sj.gene.6364348. [DOI] [PubMed] [Google Scholar]
- 44.Jordan WJ, Eskdale J, Srinivas S, et al. Human interferon lambda-1 (IFN-lambda1/IL-29) modulates the Th1/Th2 response. Genes Immun. 2007;8:254–61. doi: 10.1038/sj.gene.6364382. [DOI] [PubMed] [Google Scholar]
- 45.Quirt I, Verma S, Petrella T, Bak K, Charette M. Temozolomide for the treatment of metastatic melanoma: a systematic review. Oncologist. 2007;12:1114–23. doi: 10.1634/theoncologist.12-9-1114. [DOI] [PubMed] [Google Scholar]