

Abstract
Spatial patterning of biochemical cues on the micro- and nanometer scale controls numerous cellular processes such as spreading, adhesion, migration, and proliferation. Using force microscopy we show that the lateral spacing of individual integrin receptor-ligand bonds determines the strength of cell adhesion. For spacings ≥90 nm, focal contact formation was inhibited and the detachment forces as well as the stiffness of the cell body were significantly decreased compared to spacings ≤50 nm. Analyzing cell detachment at the subcellular level revealed that rupture forces of focal contacts increase with loading rate as predicted by a theoretical model for adhesion clusters. Furthermore, we show that the weak link between the intra- and extracellular space is at the intracellular side of a focal contact. Our results show that cells can amplify small differences in adhesive cues to large differences in cell adhesion strength.
Abbreviations used: AFM, atomic force microscopy; ECM, extracellular matrix; FBS, fetal bovine serum; PEG, polyethylene glycol; REF, rat embryonic fibroblasts; RGD, arginine-glycine-aspartate
Introduction
Cell adhesion is the central mechanism that ensures the structural integrity of tissue. It is usually studied in cell culture, where the most prominent cell-matrix adhesion structures are so-called focal contacts (1). Focal contacts consist of large patches of transmembrane adhesion receptors from the integrin-family (2). These integrin patches in the cell membrane can reach lateral sizes of several micrometers. On the extracellular side, integrin binds to ligands such as the ECM protein fibronectin (3). On the intracellular side, the receptors are linked to the actin cytoskeleton via a cytoplasmic plaque composed of many different proteins, including talin, vinculin, paxillin, and α-actinin (4). This connection to the cytoskeleton, which is often organized in the form of stress fibers, allows transmitting forces between cells and the ECM through focal contacts.
Cells use focal contacts to integrate biochemical and mechanical information about their environment and to regulate the organization of the cytoskeleton. In particular, cell behavior is profoundly affected by the mechanical properties of the ECM and extracellular mechanical signals. For example, the stiffness of elastic substrates determines focal contact formation, cell elasticity, cell migration and cell differentiation (5–8). If intracellular force generation is inhibited, e.g., by the myosin II inhibitor blebbistatin, these effects are abolished (5). On the other hand, stimulating cells by an external shear force can induce a substantial growth of focal contacts (9,10). These observations show the mechanosensitive nature of focal contacts and their importance for cellular decision-making. Mechanosensing through focal contacts is probably based on a mechanobiochemical feedback loop involving force-induced signaling through small GTPases from the Rho-family and activation of force generation in the actin cytoskeleton (11,12). However, the molecular basis of mechanosensing is still not fully understood. Recent evidence suggests that the integrin-fibronectin bond as well as talin, one of the integrin binding partners in the cytoplasmic plaque, undergo conformational changes on stretch (13,14). Thus, investigating the mechanical properties of focal contacts is an important step toward a complete understanding of mechanosensing.
Micro- and nanopatterned substrates with a controlled distribution and density of binding sites for integrin receptors have emerged as a valuable tool for investigating the impact of the ECM structure on cell behavior. For instance, the forces that cells actively apply at focal contact sites (15,16) and the dependence of cell spreading, polarization, motility, proliferation, and focal contact formation on the ECM pattern (17,18) as well as on the nano-scale density (19–21) of integrin binding sites has been investigated. It has been shown recently that it is not only the average density of integrin binding sites under the cell body but also the details of their lateral spacing at the nano-scale that controls focal contact formation and cell behavior at the microscale. For an integrin binding site spacing ≥73 nm, focal contact formation is inhibited and cells do not spread. For a spacing ≤58 nm, in contrast, focal contacts and actin stress fibers form and cells adopt a well-spread, pancake-like shape (22,23). On surfaces with a nano-scale gradient of binding site spacing, cells are able to sense effective differences in binding site spacing as small as 1 nm over the cell diameter (24). These results show that cell adhesion is extremely sensitive to the organization of molecular binding sites at the nano-scale.
We investigate the role of the nano-scale spacing of individual integrin binding sites for the detachment strength of adhered cells and the stability of focal contacts under load. We use nanopatterned substrates prepared by diblock copolymer nanolithography that are functionalized with the cyclic RGD peptide c[RGDfK(Ahx-Mpa)] that binds to the αvβ3 integrin with high affinity (25,26). In this way, we control the minimal spacing of individual αVβ3-integrin molecules bound to the surface. This, in turn, controls the structure and formation of focal contacts and the spreading of cells. To quantify cell adhesion and focal contact strength, we used an AFM in conjunction with phase contrast and fluorescence microscopy, making it possible to study the force-induced detachment of spread cells and focal contacts. Over the last years, the AFM has become a standard tool to investigate adhesion strength of specific receptor-ligand bonds, both for single molecules and for multiple bonds in the context of single cells (27,28). However, in most studies on cell adhesion the contact time between cell and substrate is restricted to a few minutes (29–31). Studies on long-term adhesion strength with contact times of several hours have been carried mainly out with techniques such as the spinning disk apparatus (32) and centrifugation assays (33), which can only provide information about the average adhesion strength in cell ensembles. Thus, the AFM-based method for studying long term adhesion that we present here significantly extends timescale and precision for probing the adhesion strength of individual cells. Furthermore, it allows, for the first time, to study the stability of subcellular components such as focal contacts, which only develop after long adhesion time.
Previous studies have shown the cooperative effect of integrin spacing for cell adhesion strength during the initial cell-substrate contact (34), that is, before mature focal contacts form. Using what we believe to be a novel method, we studied the role of integrin spacing for the long-term stability of cell adhesion and the elasticity of the cell body. We find that focal contact formation plays the key role in controlling local cell adhesion strength and cell stiffness. Interestingly, our experiments reveal that focal contacts preferentially break at their intracellular side. This suggests that the weak link between cell and ECM is the one between integrin receptors and cytoskeleton rather than the cell-ECM connection. We further investigate the dependence of the rupture force of focal contacts on loading rate. Applying a theoretical model for the rupture of parallel bonds under shared load, we identify two different scaling regimes for the dependence of cluster stability on loading rate. The quantitative information obtained from analyzing focal contact stability on substrates with different integrin binding site spacing indicates that there is a maximum packing density for the proteins in the cytoplasmic plaque. The results presented in this study show that the intermolecular spacing of integrins at the nanometer scale plays an essential role for cell adhesion strength and elasticity.
Materials and Methods
Biofunctionalized nanopatterns
Hexagonal patterns of gold nanoparticles were prepared on glass slides by self-assembly of diblock-copolymer micelles (35). The core of the micelles was enriched with a gold nanoparticle precursor and after dip-coating onto glass slides the particles were deposited by a hydrogen plasma treatment. The details of this substrate preparation are described elsewhere (22). The spacing between adjacent gold nanoparticles, i.e., the hexagonal lattice parameter, is determined by the diameter of the micelles and is fixed for each substrate. Here, we used substrates with spacings of 28 ± 7, 50 ± 11, 90 ± 15 and 103 ± 15 nm. Scanning electron micrographs of the hexagonal nanoparticle pattern on glass slides are shown in Fig. 1, A and B. The area in between the gold dots was filled with PLL(20)-g[3.5]-PEG(2) (SurfaceSolution, Dübendorf, Switzerland) to prevent nonspecific adhesion to the glass (36,37). Specific integrin binding to the gold particles was allowed by functionalizing them with the c[RGDfK(Ahx-Mpa)] peptide, which binds with high affinity to αVβ3 integrin (25,26). Fig. 1 C shows the final surface configuration used in the experiments. Binding is sterically restricted to a single integrin per gold particle because the diameter of the integrin head domain is 9 nm (38), the diameter of a gold nanoparticle is 6–8 nm and the thickness of the hydrated PLL-g-PEG layer is ∼8.2 nm (39). Consequently, each gold particle provides a binding site for at most one integrin.
Figure 1.
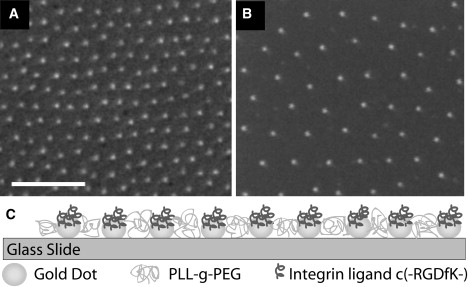
Nanopatterned surface template. (A and B): Scanning electron micrographs of hexagonally ordered gold nanopatterns on glass substrates with distances of 50 and 90 nm, respectively. Scale bar = 200 nm. (C) Sketch of the biofunctionalized nanopattern system used for integrin binding.
Cell culture
REF52, stably transfected with YFP-paxillin (40) were maintained in Dulbecco's modified Eagle's medium, supplemented with 10% FBS and 2 mM L-glutamine (all from Gibco Laboratories, Karlsruhe, Germany) at 37°C and 5% CO2.
Cell detachment experiments
Cells were seeded on biofunctionalized nanopatterned substrates in FBS-reduced medium (Dulbecco's modified Eagle's medium, 2% FBS, 2% L-glutamine, 100 μg/mL penicillin-streptomycin) at 37°C and 5% CO2 for 5–7 h. For the cell detachment experiments, the sample was transferred to a heated fluid chamber (BioCell, JPK Instruments, Berlin, Germany). The temperature was adjusted to 36°C and the cell medium was changed to CO2 independent medium (Invitrogen product 18045088) supplemented with 10% FBS, 2% L-glutamine and 100 μg/mL penicillin-streptomycin (all from Gibco Laboratories, Germany).
The experiments were carried out with a commercial AFM, which has been specially developed for life science applications (Nanowizard and CellHesion Systems, JPK Instruments, Germany). The AFM was set up in conjunction with an inverted microscope (Axiovert 200, Zeiss, Göttingen, Germany). Tipless cantilevers were delivered from Mikromasch (Tallinn, Estonia) (NSC12, rectangular shape) and Veeco (NP-020, V-shape) (Veeco Probes, Camarillo, CA). To facilitate data analysis, only rectangular cantilevers were used in quantitative experiments.
To detach a cell from a surface, the connection between cantilever and cell must be at least as strong as the connection between cell and surface. Hence, we functionalized the cantilevers with fibronectin (41), which provides binding sites for at least six different integrins (42). Furthermore, the fibronectin can induce the formation of focal contacts at the cell-cantilever interface, providing a cytoskeletal connection between the cantilever and the substrate. Hence, we do not apply a force to the cell membrane but directly to the cytoskeleton, so that the force exerted by the cantilever is transmitted to the cell body via the focal contact and not by the cell membrane.
Without viable cytoskeletal elements between cantilever and the cell-nanopattern interface, e.g., if the membrane was connected to the cantilever with glutaraldehyde, a several micron-thick membrane tube can be pulled out from the cell without inducing cell detachment, as described by Gladilin et al. (43).
In a detachment experiment, a cantilever was carefully lowered to the dorsal side of a cell so that the free end of the cantilever touched the cell surface (Fig. 2 and Fig. S3 in the Supporting Material). Typically, the cantilever was firmly attached to the cell after 10–15 min so that the cell was influenced by the cantilever for a relatively short time relative to the time (5–7 h) it adhered at the substrate before any external mechanical stimulus. To avoid cell damage, e.g., by a rupture of the membrane during cantilever retraction, slow cantilever retraction speeds between 0.33 and 0.83 μm/s were used. With this procedure cells remained viable after detachment.
Figure 2.
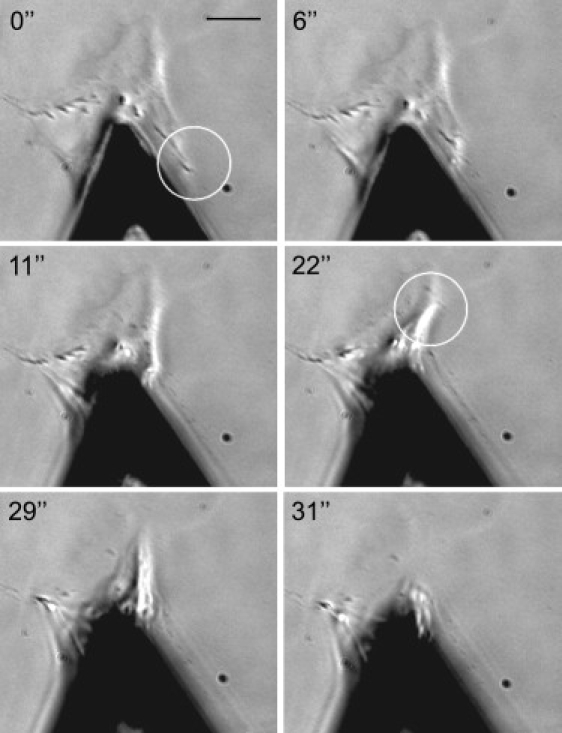
Series of phase contrast images showing the detachment of a well-spread cell from a glass surface by an AFM cantilever. The cell was allowed to adhere for several hours before the experiment. In the images, it is clearly visible that the adhesion pins of the cell (circles) are successively detached. Scale bar = 20 μm.
In all experiments, the cell spreading area before detachment was determined with phase contrast microscopy. Cell detachment was followed with fluorescence microscopy using a 40× objective (EC Plan-Neofluar, NA = 0.75; Zeiss) and a high-resolution camera (ORCA-ER, Hamamatsu Photonics, Herrsching, Germany) at a frame rate of 2 Hz.
Force and image analysis
Cantilevers were calibrated as presented in Movie S1 in the Supporting Material. Force-extension curves were analyzed with a custom-made MATLAB program (The MathWorks, Natick, MA) that calculates the total detachment forces and the force magnitudes corresponding to single rupture events. Cell boundaries, detached areas and focal contact sizes were determined with ImageJ (44). In the analysis, we only took into account such cell detachment events in which all force steps could be identified with rupture events at the cell-nanopattern interface. This procedure guaranteed that cell-cantilever rupture events were not mistaken for rupture events at the cell-nanopattern interface.
For the interpretation of cell detachment forces on different substrates, several measures can be defined. We define the “total detachment force” as the sum of all measured force steps in a detachment trajectory (Fig. 3 A). Importantly, this total detachment force is not necessarily equal to the maximum force in a detachment trajectory, because additional force can be built up during the detachment process. The total detachment force divided by the cell spreading area we call “global detachment force density”. Dividing a single force step in the force curve by the corresponding detached area gives the “local cell detachment force density”. In the presence of focal contacts, the detached area was identified clearly with the area of the ruptured focal contacts because the area in between the focal contacts was lifted from the surface without a detectable force response. For integrin binding site spacings ≥90 nm, no focal contacts were formed and force steps coincided with the detachment of extended cell-surface contact zones (Movie S2).
Figure 3.
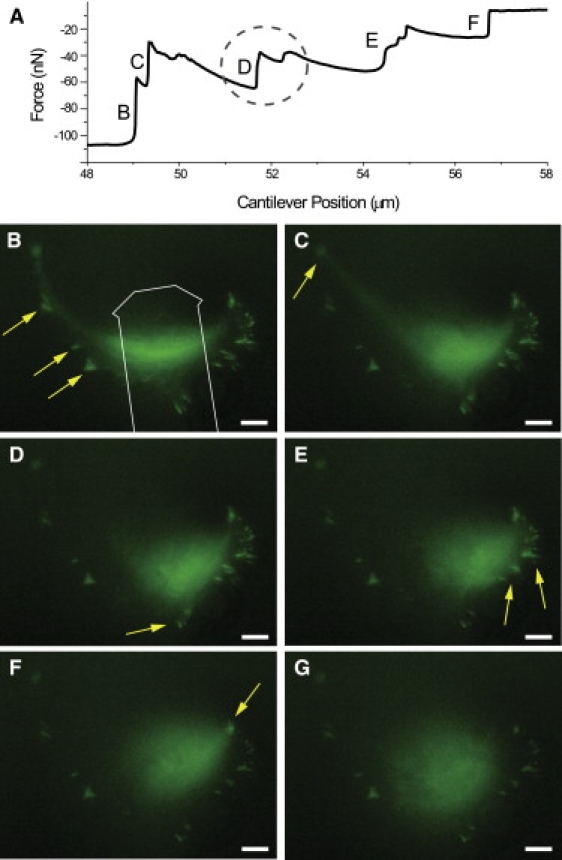
(A) Force-extension curve for the detachment of a cell from a nanopattern (integrin binding site spacing 50 nm) showing the force measured as function of cantilever position. (B–F) Series of YFP-fluorescence images during the detachment of the cell used for the force curve in A. Detached areas are marked with yellow arrows, corresponding force steps are marked in A. In B, the outline of the cantilever is indicated. By comparing the force curve with the fluorescence images the ruptures of focal contacts can be resolved. The rupture event in D is in detail considered in Fig. 4. In the cell shown here we identified 24 paxillin clusters on a cell spreading area of 2804 μm2. The ratio of focal contact area to cell spreading area was 5%.
Theoretical description of adhesion clusters
In a focal contact, the force transmitted through the actin cytoskeleton is applied to the adhesion bonds via the cytoplasmic plaque. Although the exact distribution of forces and also the exact positioning of the weakest links inside the focal contact are unknown, the simplest model assumption is that there exists a layer of parallel bonds that share the load equally. The rupture behavior of such an adhesion cluster under a linear increase of the pulling force F(t) = rt has been modeled previously (45,46). Following the seminal work of Bell (47), our model assumes that the instantaneous rate at which a bond breaks increases exponentially with the force Fb(t) exerted on the bond, koff = k0 exp(Fb(t)/F0). The unstressed off-rate k0 and the intrinsic force scale F0 are molecular properties of the bond. Due to the assumption of equal load sharing, Fb(t) = rt/N(t), where N(t) is the number of closed bonds at time t. As long as closed bonds still exist and ensure spatial proximity, open bonds can rebind with a constant on-rate kon. The average force needed to break the adhesion cluster is determined mainly by two parameters: the maximum number of bonds in the cluster, Nt, and the loading rate applied at the whole cluster, r (in nN/s). The model predicts two distinct scaling regimes of slow and fast loading:
| (1) |
Here, pln(a) denotes the product logarithm, which is defined as the solution x of xexp(x) = a, and e is the Euler number. Neq= Nt k0/(k0 + kon) < Nt is the number of closed bonds in the unstressed steady-state. The product k0F0 sets the characteristic scale for loading. At slow loading the rupture force increases linearly with the number of bonds in the cluster and is independent of loading rate. For fast loading, rebinding becomes irrelevant and the rupture force scales with the logarithm of loading rate, similar to single bond rupture under linear loading (48,49). Equation 1 also shows that in both scaling regimes the rupture force depends on the maximum number of molecules in the cluster, Nt, which can be assumed to be proportional to the area of the adhesion cluster, Nt = A/A0. Here A0 is the molecular area occupied by one bond. The controlled binding site spacing, d, in our experiments sets the lower limit . Expressing Eq. 1 in terms of the area, yields for the rupture force of focal contacts per focal contact area:
| (2) |
Results
Elastic deformations and abrupt rupture during cell detachment
Fibroblasts spread out and maximize their adhesion area on a ligand-coated surface. For sufficiently large adhesion time and sufficient ligand density on the surface, mature focal contacts form that serve as discrete contact points pinning the cell to the surface. Consequently, detaching a cell from a surface is not a continuous peeling process, but proceeds in discrete steps in which the pins detach. Fig. 2 shows a typical example of cell detachment with the AFM, where the cell body is significantly stretched before the adhesion pins are successively detached. Fig. 3 shows an exemplary cell detachment and the corresponding force-extension curve. While the cell is stretched, the force increases nearly linearly. Each abrupt drop of force corresponds to the rupture of adhesion clusters. After a rupture event, force is redistributed over the remaining contacts and increases again due to retraction of the cantilever until the next adhesion cluster fails.
Adhesion bonds are not the weak links of mature focal contacts
To investigate the cell detachment process on a subcellular level, we recorded the fluorescence signal of YFP-paxillin, which is incorporated into the cytoplasmic plaque and can be used as a marker for focal contacts. In general, the number of focal contacts per cell and the focal contact area varied strongly from one cell to the other. In most situations, the cells had three to five areas where they were pinned to the surface.
An example of a cell detachment from a substrate with 50 nm integrin spacing is shown in Fig. 3, B–G. Often, several focal contacts were located close to each other in a pinning area so that they ruptured in the same detachment event. Surprisingly, we found that large parts of the fluorescent paxillin content of focal contacts can still be detected on the substrate after detachment of the cell body (Fig. 4, A and B). This indicates that focal contacts preferentially rupture at their intracellular side whereas the integrin remains bound to the substrate. The amount of paxillin remaining on the substrate varied strongly from one focal contact to the other (Fig. 4, A and B, and the Supporting Material section S4). Nevertheless, an internal rupture of focal contacts as a result of vertical pulling force appears to be a universal property of focal contacts and was observed throughout the experiments. Due to the internal rupture of the focal contacts it is important to note that all measured rupture forces characterize the cohesion strength of the focal contacts rather than the direct cell-substrate interaction.
Figure 4.
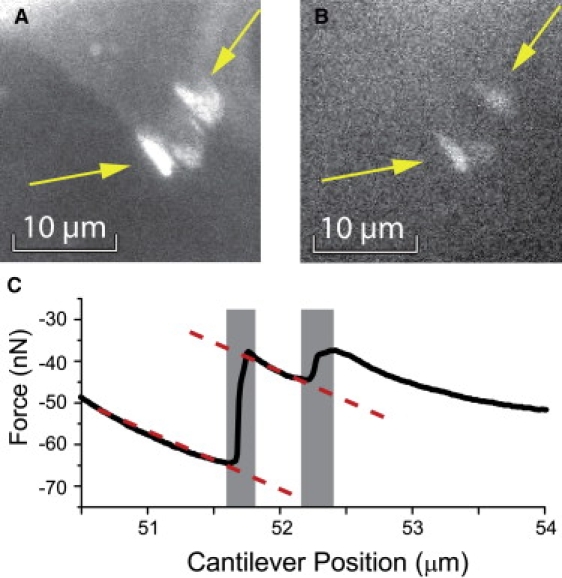
Paxillin fluorescence (A) before and (B) after the detachment of the region that ruptured in Fig. 3D. Arrows mark the focal contacts. Comparison of A and B shows that the focal contacts remain partly on the substrate after detachment of the cell body. (C) Excerpt of a force curve. The steps shaded in gray correspond to the rupture of the focal contacts in A and the dashed line represents the elastic elongation of the cell body before focal contact detachment.
Integrin spacing controls cell detachment forces
In our experiments, focal contacts were only formed on nanopatterned substrates with an integrin binding site spacing of 28 ± 7 and 50 ± 11 nm, in agreement with the work of Arnold et al. (22). Cells exposed to an integrin binding site spacing of 90 ± 15 and 103 ± 15 nm showed extended adhesion zones. Hence, we used the integrin spacing to control focal contact formation to evaluate its impact on cell detachment force. We compared the total detachment force (Fig. 5 A), the global detachment force density (Fig. 5 B) and the local detachment force density (Fig. 5 C). Fig. 5, A–C, show that all three measures of detachment force increase with increasing binding site density. Interestingly, the local detachment force density increases by a factor of 14.3 between 90 and 50 nm binding site spacing, where the binding site density increases only by a factor of 3.2. As focal contacts are only present for spacings ≤50 nm, the local detachment force density appears to be cooperatively increased by the presence of focal contacts for spacings ≤50 nm.
Figure 5.
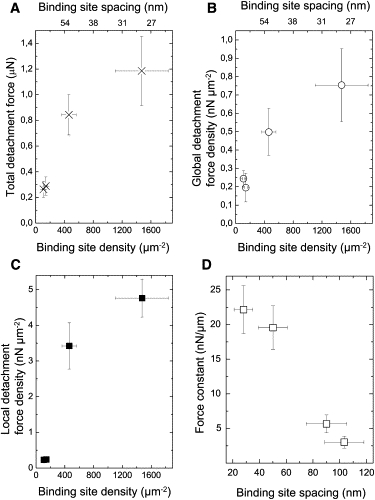
(A) Total cell detachment forces. (B) Global detachment force density. (C) Local detachment force density. All values are plotted versus the binding site density. Error bars in the density of integrin binding sites denote the SD. Error bars in the detachment force denote the SE. (D) Dependence of the cellular force constant on the spacing of integrin binding sites and, as focal contacts are only formed for spacings ≤50 nm, there is also a dependence on focal contact formation. Error bars denote the SE.
Cell elasticity depends on the presence of focal contacts
As reported by Arnold et al. (22), integrin spacing is an important parameter for the formation of actin stress fibers and might consequently also influence cell elasticity. To evaluate the elasticity of the cells as a function of integrin spacing, we analyzed the slopes in the force-extension curves before detachment events (Fig. 4 C). In this analysis, the cell is regarded as a Hookian spring and the cellular force constant is an effective parameter to describe the stiffness of that part of the cell that is predominantly loaded before rupture. Results for the averaged cellular force constants as a function of integrin spacing are given in Fig. 5 D. Cell stiffness drops considerably between spacings of 50 nm and 90 nm, but does not change significantly with integrin spacing for spacings ≥90 nm and ≤50 nm, respectively. This result supports the idea that integrin spacing also induces a reorganization of the cytoskeleton, which may be linked to focal contact formation.
Cell detachment forces differ for slow and fast loading
The results described above indicate that focal contact formation induces significant changes in the organization of the cytoskeleton and stability of local detachment force density. On nanopatterned substrates with an integrin binding site spacing of 28 ± 7 and 50 ± 11 nm, the local detachment force density, F/A, is calculated from the rupture forces of focal contacts. To examine how the rupture forces of focal contacts are influenced by integrin binding site spacing, we carried out a force spectroscopic analysis. The loading rate applied to the complete cell before a detachment event was calculated by multiplying the cellular force constant (in nN/μm, Fig. 4 C) with the cantilever retraction speed (in μm/s). To calculate the loading rate, r, applied to a focal contact, we assume parallel loading of focal contacts and that load is distributed among the loaded focal contacts in direct proportion to their size. However, due to the anisotropic cell geometry and the tilt of the cantilever, corrections must be applied. In particular, focal contacts were often not loaded in parallel, but successively so that some focal contacts were unloaded whereas others were already detached. Such unloaded “loose contacts” can be identified by comparing the cellular force constants in several detachment events; in the absence of loose contacts, the measured force constant decreases in subsequent detachment steps, because less and less cellular material is strained. If in contrast the force constant increases after a detachment step, more cellular material is strained after the detachment than before. This indicates that one or more contacts that are pulled on after a detachment were loose before. The loose contacts can in detail be verified by comparing fluorescence images, where the background fluorescence of the cell body shows if a particular part of the cell is under tension or not, e.g., by showing changes in the cell shape and the fluorescence intensity. Using this strategy, we only distribute the loading rate among the actually loaded focal contacts to receive the loading rate r applied to an individual focal contact.
As the cytoskeletal connections of focal contacts differ from one contact to the next, the cellular force constant and hence the loading rate is different for each focal contact. The loading rates applied to focal contacts thus varied over more than two orders of magnitude, although the cantilever retraction speed was not changed by more than a factor of three. By not significantly changing the cantilever retraction speed, we avoided errors that could arise from probing different cellular timescales and inducing different viscoelastic relaxation responses of the cell.
Fig. 6 shows results for the local detachment force density in focal contacts, F/A, on substrates with integrin binding site spacings of 28 nm (Fig. 6 A) and 50 nm (Fig. 6 B) as a function of the area-normalized loading rate, r/A, i.e., the loading rate applied at a focal contact divided by its size. In agreement with our theoretical expectations, two scaling regimes can be identified in both graphs, which were fitted with Eq. 2. The data show that the rupture forces are independent of loading rate for the regime of slow loading (Fig. 6, dashed line). For fast loading (Fig. 6 full line), rupture forces show a logarithmic dependence on loading rate. The presence of the two scaling regimes shows that the adhesion clusters are large enough for applying our theory, which does not include stochastic effects. Fitting the two regimes with Eq. 2 allowed us to estimate the molecular stress, F0/A0, the rebinding rate, kon, and the unstressed unbinding rate, k0 (Table 1).
Figure 6.
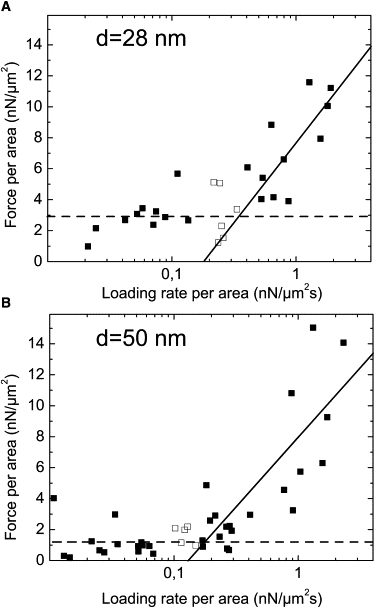
Dependence of the rupture forces of focal contacts on the loading rate, normalized to the cluster area. The values are shown for (A) 28 nm and (B) 50 nm integrin binding site spacing. The scaling functions were fitted to the data and the two regimes of slow loading (dashed line) and fast loading (line) can be identified. The empty squares were not taken into account for the fit to exclude values that are too close to the transition between the loading rate regimes. The error of a single data point is estimated to be ∼10% both in rupture force and loading rate.
Table 1.
Fit values obtained by using the theoretical analysis of adhesion cluster stability
| Integrin binding site spacing | 28 nm | 50 nm |
| Integrin binding site density | 1473 μm−2 | 461 μm−2 |
| F0/A0 | 9.4 nN/μm2 | 5.9 nN/μm2 |
| k0 | 0.04 s−1 | 0.03 s−1 |
| kon | 0.044 s−1 | 0.015 s−1 |
The results obtained by this analysis are consistent. The rupture force per area, F0/A0, decreases with increasing integrin binding site spacing. The unbinding rate of single bonds, k0, is of the same order of magnitude for the two substrate types, as expected for an intrinsic property of the bond. The rebinding rate kon increases with increasing binding site density, in agreement with the increase in binding sites on the surface.
Discussion
We have used RGD-functionalized nanopatterns that provide binding sites for individual integrin molecules to investigate the role of integrin binding site spacing for cell elasticity, cell adhesion strength, and focal contact stability in mature cell adhesion. Such long-term adhesion requires very different experiments than initial adhesion because the cells are spread out on the substrates and have formed stable, micrometer-sized adhesion clusters. Due to the large adhesion strength at this timescale, standard protocols as they are normally used in AFM-based single-cell force microscopy experiments (29–31,34,50) have to be adapted to this new situation.
We have developed a method that is capable of investigating cell adhesion forces at adhesion timescales of 5–7 h by using AFM in conjunction with optical microscopy. The AFM cantilever is functionalized with fibronectin so that a cytoskeletal connection between the adhesion points at the cantilever and at the surface forms and the cytoskeleton can transmit forces from the dorsal side of the cell to the adhesion zones at the surface. As fibronectin also binds αvβ3 integrins—as does the RGD on the substrates—the cell-cantilever contact could diminish the cell-substrate binding strength by a depletion of the integrin contacts. However, this effect is limited in our experiments because the cantilever was touching the dorsal side of the cell for no longer than 10–15 min before cell detachment. Moreover, fibronectin is also binding to other integrins in the cell membrane (42) and a large excess of fibronectin-binding molecules is available in the membrane (51).
Observing the fluorescence of YFP-marked paxillin molecules in the cytoplasmic plaque during cell detachment, we found that only part of the paxillin is removed. This indicates that focal contacts break predominantly on their intracellular side, that is, the link between receptors and cytoskeleton breaks instead of the receptor-ECM bonds. This result is reminiscent of studies on cell migration, where an integrin release at the rear end of the cell has been reported (52–54). An intracellular breakage of focal contacts has also been observed by Franz and Müller (55), who de-roofed cells with short ultrasonic bursts. They report that the remaining parts of the focal contacts on the surface contain paxillin and F-actin and that the structure of the focal contact remained intact even in the rare event of actin stress fiber rupture. The inhomogeneous distribution of actin in a focal contact (56) can be a possible reason for the partial detachment of paxillin.
A well-known reaction of focal contacts stimulated by an external force with a tangential component is that they grow in the direction of the applied force (9,10,57). In our experiments, we never observed a lateral growth of focal contacts. This might have several reasons. First, the detachment process was probably too fast for the cell to significantly alter the focal adhesion area, in particular as stress was gradually built up so that the effective time where high stress was applied to the cells was <1 min. Second, force was applied to the cell in the vertical direction so that the tangential component was possibly too small to induce a lateral growth of the focal contact. It would be of great interest to further elucidate the mechanisms of focal contact growth and rupture as a function of the direction and magnitude of applied load.
It is well-known that cells adapt their stiffness to the environment, mainly through reorganization of the actin cytoskeleton (8). We determined the stiffness of the cell body before each detachment step by measuring the slope of the force-extension curve (Fig. 4 C). We found that, on average, this stiffness is increased by a factor of four due to focal contact formation and that binding site density seems to play a minor role in determining this parameter (Fig. 5 D). This result is plausible, as the state of the actin cytoskeleton is tightly coupled to focal contact formation. Without the presence of focal contacts, the actin forms a loose network of fibers in the intracellular space, while it tends to condensate close to focal contacts to form stress fibers (22,58).
Our experimental approach was complemented by a theoretical investigation of focal contact stability. We applied a mean field description to determine the rupture strength of the adhesion clusters. Although the determination of loading rate on a focal contact was based on a number of assumptions, the experimental results reproduced the theoretically predicted two scaling regimes very well and gave reasonable values for the parameter values (Fig. 6). Interestingly, the focal contact rupture force density (F0/A0) does not increase in direct proportion to the binding site density (Table 1). As the focal contact rupture forces are measures of the cohesion strength of the focal contact plaque rather than of the strength of the extracellular connection, this observation indicates the existence of a maximum packing density of the adhesion plaque. Our data show that this maximum packing density is already reached on substrates with integrin spacings of 28 nm. This observation should be further investigated, for example by studying the fluorescence intensity of different focal contact proteins as a function of binding site density. However, the hierarchical organization of the focal contact plaque suggests a well-defined spacing and orientation of its proteins and hence the existence of a maximum packing density is not surprising.
In conclusion, we have shown that the intermolecular spacing of integrins at the nanometer scale plays a crucial role for cell adhesion strength, cell elasticity, and focal contact stability and that it is possible to study the detachment forces of well-adhered individual cells. We believe the results and the method presented in this study are a starting point for further experiments studying related questions concerning the mechanical properties of focal contacts, the role and mechanism of focal contact rupture and growth, and the influence of intermolecular spacings at different timescales.
Supporting Material
Supporting material is available at http://www.biophysj.org/biophysj/supplemental/S0006-3495(09)01689-0.
Supporting Material
Acknowledgments
We thank B. Geiger (Weizman Institute of Science) for providing the REF52 cell line, and also thank him as well as E. Sackmann (TU München) and J. Vörös for helpful discussions. M. Kapp, M. Sycha and I. Grigoridis at the MPI for Metals Research are acknowledged for their kind preparation of nanopatterned substrates. C.S.-U. was supported by a PhD stipend from the Boehringer Ingelheim Fonds, and M.L.-G. holds a postdoctoral fellowship from the Alexander-von-Humboldt Foundation. J.P.S. holds a Weston Visiting Professorship at the Weizmann Institute, Department of Molecular Cell Biology.
This work was supported by the Landesstiftung Baden-Württemberg (Spitzenprogramm Baden-Württemberg), European Union-STREP NanoCues, the Alfried-Krupp von Bohlen und Halbach-Stiftung, and the Max-Planck-Society. At Heidelberg, we were also supported by the Center for Modelling and Simulation in the Biosciences (BIOMS) and the Cluster of Excellence CellNetworks.
References
- 1.Gumbiner B.M. Cell adhesion: the molecular basis of tissue architecture and morphogenesis. Cell. 1996;84:345–357. doi: 10.1016/s0092-8674(00)81279-9. [DOI] [PubMed] [Google Scholar]
- 2.Critchley D.R. Focal adhesions—the cytoskeletal connection. Curr. Opin. Cell Biol. 2000;12:133–139. doi: 10.1016/s0955-0674(99)00067-8. [DOI] [PubMed] [Google Scholar]
- 3.Ruoslahti E. RGD and other recognition sequences for integrins. Annu. Rev. Cell Dev. Biol. 1996;12:697–715. doi: 10.1146/annurev.cellbio.12.1.697. [DOI] [PubMed] [Google Scholar]
- 4.Zamir E., Geiger B. Molecular complexity and dynamics of cell-matrix adhesions. J. Cell Sci. 2001;114:3583–3590. doi: 10.1242/jcs.114.20.3583. [DOI] [PubMed] [Google Scholar]
- 5.Discher D.E., Janmey P., Wang Y.L. Tissue cells feel and respond to the stiffness of their substrate. Science. 2005;310:1139–1143. doi: 10.1126/science.1116995. [DOI] [PubMed] [Google Scholar]
- 6.Engler A.J., Griffin M.A., Discher D.E. Myotubes differentiate optimally on substrates with tissue-like stiffness: pathological implications for soft or stiff microenvironments. J. Cell Biol. 2004;166:877–887. doi: 10.1083/jcb.200405004. [DOI] [PMC free article] [PubMed] [Google Scholar]
- 7.Pelham R.J., Wang Y. Cell locomotion and focal adhesions are regulated by substrate flexibility. Proc. Natl. Acad. Sci. USA. 1997;94:13661–13665. doi: 10.1073/pnas.94.25.13661. [DOI] [PMC free article] [PubMed] [Google Scholar]
- 8.Solon J., Levental I., Janmey P.A. Fibroblast adaptation and stiffness matching to soft elastic substrates. Biophys. J. 2007;93:4453–4461. doi: 10.1529/biophysj.106.101386. [DOI] [PMC free article] [PubMed] [Google Scholar]
- 9.Paul R., Heil P., Schwarz U.S. Propagation of mechanical stress through the actin cytoskeleton toward focal adhesions: model and experiment. Biophys. J. 2008;94:1470–1482. doi: 10.1529/biophysj.107.108688. [DOI] [PMC free article] [PubMed] [Google Scholar]
- 10.Riveline D., Zamir E., Bershadsky A.D. Focal contacts as mechanosensors: externally applied local mechanical force induces growth of focal contacts by an mDia1-dependent and ROCK-independent mechanism. J. Cell Biol. 2001;153:1175–1186. doi: 10.1083/jcb.153.6.1175. [DOI] [PMC free article] [PubMed] [Google Scholar]
- 11.Geiger B., Bershadsky A. Exploring the neighborhood: adhesion-coupled cell mechanosensors. Cell. 2002;110:139–142. doi: 10.1016/s0092-8674(02)00831-0. [DOI] [PubMed] [Google Scholar]
- 12.Besser A., Schwarz U.S. Coupling biochemistry and mechanics in cell adhesion: a model for inhomogeneous stress fiber contraction. N. J. Phys. 2007;9:425. [Google Scholar]
- 13.del Rio A., Perez-Jimenez R., Sheetz M.P. Stretching single talin rod molecules activates vinculin binding. Science. 2009;323:638–641. doi: 10.1126/science.1162912. [DOI] [PMC free article] [PubMed] [Google Scholar]
- 14.Friedland J.C., Lee M.H., Boettiger D. Mechanically activated integrin switch controls alpha5beta1 function. Science. 2009;323:642–644. doi: 10.1126/science.1168441. [DOI] [PubMed] [Google Scholar]
- 15.Balaban N.Q., Schwarz U.S., Geiger B. Force and focal adhesion assembly: a close relationship studied using elastic micropatterned substrates. Nat. Cell Biol. 2001;3:466–472. doi: 10.1038/35074532. [DOI] [PubMed] [Google Scholar]
- 16.Tan J.L., Tien J., Chen C.S. Cells lying on a bed of microneedles: an approach to isolate mechanical force. Proc. Natl. Acad. Sci. USA. 2003;100:1484–1489. doi: 10.1073/pnas.0235407100. [DOI] [PMC free article] [PubMed] [Google Scholar]
- 17.Lehnert D., Wehrle-Haller B., Bastmeyer M. Cell behavior on micropatterned substrata: limits of extracellular matrix geometry for spreading and adhesion. J. Cell Sci. 2004;117:41–52. doi: 10.1242/jcs.00836. [DOI] [PubMed] [Google Scholar]
- 18.Singhvi R., Kumar A., Ingber D.E. Engineering cell shape and function. Science. 1994;264:696–698. doi: 10.1126/science.8171320. [DOI] [PubMed] [Google Scholar]
- 19.Maheshwari G., Brown G., Griffith L.G. Cell adhesion and motility depend on nanoscale RGD clustering. J. Cell Sci. 2000;113:1677–1686. doi: 10.1242/jcs.113.10.1677. [DOI] [PubMed] [Google Scholar]
- 20.Massia S.P., Hubbell J.A. An RGD spacing of 440 nm is sufficient for integrin alpha V beta 3-mediated fibroblast spreading and 140 nm for focal contact and stress fiber formation. J. Cell Biol. 1991;114:1089–1100. doi: 10.1083/jcb.114.5.1089. [DOI] [PMC free article] [PubMed] [Google Scholar]
- 21.Koo L.Y., Irvine D.J., Griffith L.G. Co-regulation of cell adhesion by nanoscale RGD organization and mechanical stimulus. J. Cell Sci. 2002;115:1423–1433. doi: 10.1242/jcs.115.7.1423. [DOI] [PubMed] [Google Scholar]
- 22.Arnold M., Cavalcanti-Adam E.A., Spatz J.P. Activation of integrin function by nanopatterned adhesive interfaces. ChemPhysChem. 2004;5:383–388. doi: 10.1002/cphc.200301014. [DOI] [PubMed] [Google Scholar]
- 23.Cavalcanti-Adam E.A., Volberg T., Spatz J.P. Cell spreading and focal adhesion dynamics are regulated by spacing of integrin ligands. Biophys. J. 2007;92:2964–2974. doi: 10.1529/biophysj.106.089730. [DOI] [PMC free article] [PubMed] [Google Scholar]
- 24.Arnold M., Hirschfeld-Warneken V.C., Spatz J.P. Induction of cell polarization and migration by a gradient of nanoscale variations in adhesive ligand spacing. Nano Lett. 2008;8:2063–2069. doi: 10.1021/nl801483w. [DOI] [PMC free article] [PubMed] [Google Scholar]
- 25.Kantlehner M., Schaffner P., Kessler H. Surface coating with cyclic RGD peptides stimulates osteoblast adhesion and proliferation as well as bone formation. ChemBioChem. 2000;1:107–114. doi: 10.1002/1439-7633(20000818)1:2<107::AID-CBIC107>3.0.CO;2-4. [DOI] [PubMed] [Google Scholar]
- 26.Pfaff M., Tangemann K., Engel J. Selective recognition of cyclic RGD peptides of NMR defined conformation by alpha IIb beta 3, alpha V beta 3, and alpha 5 beta 1 integrins. J. Biol. Chem. 1994;269:20233–20238. [PubMed] [Google Scholar]
- 27.Ludwig T., Kirmse R., Schwarz U. Probing cellular microenvironments and tissue remodeling by atomic force microscopy. Pflug. Arch. 2008;456:29–49. doi: 10.1007/s00424-007-0398-9. [DOI] [PubMed] [Google Scholar]
- 28.Müller D.J., Helenius J., Dufrêne Y.F. Force probing surfaces of living cells to molecular resolution. Nat. Chem. Biol. 2009;5:383–390. doi: 10.1038/nchembio.181. [DOI] [PubMed] [Google Scholar]
- 29.Benoit M., Gabriel D., Gaub H.E. Discrete interactions in cell adhesion measured by single-molecule force spectroscopy. Nat. Cell Biol. 2000;2:313–317. doi: 10.1038/35014000. [DOI] [PubMed] [Google Scholar]
- 30.Puech P.-H., Taubenberger A., Heisenberg C.P. Measuring cell adhesion forces of primary gastrulating cells from zebrafish using atomic force microscopy. J. Cell Sci. 2005;118:4199–4206. doi: 10.1242/jcs.02547. [DOI] [PubMed] [Google Scholar]
- 31.Taubenberger A., Cisneros D.A., Franz C.M. Revealing early steps of alpha2beta1 integrin-mediated adhesion to collagen type I by using single-cell force spectroscopy. Mol. Biol. Cell. 2007;18:1634–1644. doi: 10.1091/mbc.E06-09-0777. [DOI] [PMC free article] [PubMed] [Google Scholar]
- 32.García A.J., Ducheyne P., Boettiger D. Quantification of cell adhesion using a spinning disc device and application to surface-reactive materials. Biomaterials. 1997;18:1091–1098. doi: 10.1016/s0142-9612(97)00042-2. [DOI] [PubMed] [Google Scholar]
- 33.Thoumine O., Ott A., Louvard D. Critical centrifugal forces induce adhesion rupture or structural reorganization in cultured cells. Cell Motil. Cytoskeleton. 1996;33:276–287. doi: 10.1002/(SICI)1097-0169(1996)33:4<276::AID-CM4>3.0.CO;2-7. [DOI] [PubMed] [Google Scholar]
- 34.Selhuber-Unkel C., López-García M., Spatz J.P. Cooperativity in adhesion cluster formation during initial cell adhesion. Biophys. J. 2008;95:5424–5431. doi: 10.1529/biophysj.108.139584. [DOI] [PMC free article] [PubMed] [Google Scholar]
- 35.Spatz J.P., Mößmer S., Kabius B. Ordered deposition of inorganic clusters from micellar block copolymer films. Langmuir. 2000;16:407–415. [Google Scholar]
- 36.Lussi J.W., Falconnet D., Csucs G. Pattern stability under cell culture conditions—a comparative study of patterning methods based on PLL-g-PEG background passivation. Biomaterials. 2006;27:2534–2541. doi: 10.1016/j.biomaterials.2005.11.027. [DOI] [PubMed] [Google Scholar]
- 37.Städler B., Falconnet D., Vörös J. Micropatterning of DNA-tagged vesicles. Langmuir. 2004;20:11348–11354. doi: 10.1021/la0482305. [DOI] [PubMed] [Google Scholar]
- 38.Xiong J.-P., Stehle T., Arnaout M.A. Crystal structure of the extracellular segment of integrin alpha Vbeta3. Science. 2001;294:339–345. doi: 10.1126/science.1064535. [DOI] [PMC free article] [PubMed] [Google Scholar]
- 39.Pasche S., Textor M., Griesser H.J. Relationship between interfacial forces measured by colloid-probe atomic force microscopy and protein resistance of poly(ethylene glycol)-grafted poly(L-lysine) adlayers on niobia surfaces. Langmuir. 2005;21:6508–6520. doi: 10.1021/la050386x. [DOI] [PubMed] [Google Scholar]
- 40.Zamir E., Katz B.Z., Kam Z. Molecular diversity of cell-matrix adhesions. J. Cell Sci. 1999;112:1655–1669. doi: 10.1242/jcs.112.11.1655. [DOI] [PubMed] [Google Scholar]
- 41.Micoulet A., Spatz J.P., Ott A. Mechanical response analysis and power generation by single-cell stretching. ChemPhysChem. 2005;6:663–670. doi: 10.1002/cphc.200400417. [DOI] [PubMed] [Google Scholar]
- 42.Hynes R.O. Integrins: bidirectional, allosteric signaling machines. Cell. 2002;110:673–687. doi: 10.1016/s0092-8674(02)00971-6. [DOI] [PubMed] [Google Scholar]
- 43.Gladilin E., Micoulet A., Eils R. 3D finite element analysis of uniaxial cell stretching: from image to insight. Phys. Biol. 2007;4:104–113. doi: 10.1088/1478-3975/4/2/004. [DOI] [PubMed] [Google Scholar]
- 44.Rasband, W. S. 2005. ImageJ. U.S. National Institutes of Health, Bethesda, MD. http://rsb.info.nih.gov/ij/ (Online).
- 45.Erdmann T., Schwarz U.S. Adhesion clusters under shared linear loading: a stochastic analysis. Europhys. Lett. 2004;66:603–609. [Google Scholar]
- 46.Erdmann T., Schwarz U.S. Stability of adhesion clusters under constant force. Phys. Rev. Lett. 2004;92:108102. doi: 10.1103/PhysRevLett.92.108102. [DOI] [PubMed] [Google Scholar]
- 47.Bell G.I. Models for the specific adhesion of cells to cells. Science. 1978;200:618–627. doi: 10.1126/science.347575. [DOI] [PubMed] [Google Scholar]
- 48.Evans E., Ritchie K. Dynamic strength of molecular adhesion bonds. Biophys. J. 1997;72:1541–1555. doi: 10.1016/S0006-3495(97)78802-7. [DOI] [PMC free article] [PubMed] [Google Scholar]
- 49.Merkel R., Nassoy P., Evans E. Energy landscapes of receptor-ligand bonds explored with dynamic force spectroscopy. Nature. 1999;397:50–53. doi: 10.1038/16219. [DOI] [PubMed] [Google Scholar]
- 50.Wojcikiewicz E.P., Zhang X., Moy V.T. Force and compliance measurements on living cells using atomic force microscopy (AFM) Biol. Proceed. Online. 2004;6:1–9. doi: 10.1251/bpo67. [DOI] [PMC free article] [PubMed] [Google Scholar]
- 51.Akiyama S.K., Yamada K.M. The interaction of plasma fibronectin with fibroblastic cells in suspension. J. Biol. Chem. 1985;260:4492–4500. [PubMed] [Google Scholar]
- 52.Palecek S.P., Huttenlocher A., Lauffenburger D.A. Physical and biochemical regulation of integrin release during rear detachment of migrating cells. J. Cell Sci. 1998;111:929–940. doi: 10.1242/jcs.111.7.929. [DOI] [PubMed] [Google Scholar]
- 53.Zimmermann H., Hagedorn R., Fuhr G. Topography of cell traces studied by atomic force microscopy. Eur. Biophys. J. 1999;28:516–525. doi: 10.1007/s002490050234. [DOI] [PubMed] [Google Scholar]
- 54.Zimmermann H., Richter E., Fuhr G.R. Mammalian cell traces—morphology, molecular composition, artificial guidance and biotechnological relevance as a new type of “bionanotube”. Appl. Phys. 2001;73:11–26. [Google Scholar]
- 55.Franz C.M., Müller D.J. Analyzing focal adhesion structure by atomic force microscopy. J. Cell Sci. 2005;118:5315–5323. doi: 10.1242/jcs.02653. [DOI] [PubMed] [Google Scholar]
- 56.Zaidel-Bar R., Cohen M., Geiger B. Hierarchical assembly of cell-matrix adhesion complexes. Biochem. Soc. Trans. 2004;32:416–420. doi: 10.1042/BST0320416. [DOI] [PubMed] [Google Scholar]
- 57.Zaidel-Bar R., Kam Z., Geiger B. Polarized downregulation of the paxillin-p130CAS-Rac1 pathway induced by shear flow. J. Cell Sci. 2005;118:3997–4007. doi: 10.1242/jcs.02523. [DOI] [PubMed] [Google Scholar]
- 58.Gardel M.L., Sabass B., Waterman C.M. Traction stress in focal adhesions correlates biphasically with actin retrograde flow speed. J. Cell Biol. 2008;183:999–1005. doi: 10.1083/jcb.200810060. [DOI] [PMC free article] [PubMed] [Google Scholar]
Associated Data
This section collects any data citations, data availability statements, or supplementary materials included in this article.