

Abstract
Using the potential of mean constrained force method, molecular dynamics simulations with atomistic details were performed to examine the partitioning and nature of interactions of two nonsteroidal antiinflammatory drugs, namely aspirin and ibuprofen, in bilayers of dipalmitoylphosphatidylcholine. Two charge states (neutral and anionic) of the drugs were simulated to understand the effect of protonation or pH on drug partitioning. Both drugs, irrespective of their charge state, were found to have high partition coefficients in the lipid bilayer from water. However, the values and trends of the free energy change and the location of the minima in the bilayer are seen to be influenced by the drug structure and charge state. In the context of the transport of the drugs through the bilayer, the charged forms were found to permeate fully hydrated in contrast to the neutral forms that permeate unhydrated.
Introduction
Therapeutic drugs often interact with cell membranes in their pathway of final action. Among the various factors related that govern the behavior of drugs in cell membranes, the shape, size, hydrophobicity, and pKa are the most influential. In light of these factors, a thorough understanding of drug partitioning in lipid bilayers and the underlying interactions between the drug and lipid are important first steps in drug design that can improve the efficacy and viability of many drugs. In this study, the primary goal is to understand the partitioning and interaction using molecular simulations of nonsteroidal antiinflammatory drugs (NSAIDs) with phospholipid membranes.
NSAIDs such as aspirin and ibuprofen are some of the most widely prescribed drugs for their antipyretic, analgesic, and antiinflammatory action (1). Although NSAIDs have different pharmacokinetics (i.e., release profiles) and additional benefits such as reducing heart attacks and osteoporosis, chronic usage can result in well-documented side effects such as gastrointestinal (GI) toxicity, leading to both mild and fatal ulcers. Various mechanisms have been proposed to reconcile the cause of GI toxicity by NSAIDs, but without agreement. On the basis of these hypothesized mechanisms, modified NSAIDs such as Cyclooxygenase-II specific inhibitors such as Celebrex (Pfizer, New London, CT), Vioxx (Merck, Whitehouse Station, NJ), and nitric-oxide (NO) releasing NO-NSAIDs have been developed (1–3). Despite proving to be milder than unmodified NSAIDs, long-term safety issues of modified NSAIDs are still being evaluated (1).
One of the suggested mechanisms (supported by preclinical and clinical studies using oral and systemic administration) indicates that the direct interaction of NSAIDs with zwitterionic phospholipids (GI tract lining) is primarily responsible for GI toxicity (4,5). This hypothesis has led to the development of NSAIDs preassociated with phospholipids, especially phosphatidylcholine (PC), as safer alternatives to unmodified NSAIDs. Such PC-NSAID adducts have been shown to significantly reduce GI toxicity and enhance therapeutic activity in both animal and human models (4,6).
To optimize the PC-NSAID adducts and also to bring molecular-level insight into the interaction between NSAID molecules and the GI tract lining, it is imperative to understand in detail the thermodynamic and transport properties of NSAIDs with lipid membranes. Although NSAIDs can vary significantly in terms of structure, size, and complexity, in general, all NSAIDs are amphiphilic with most possessing carboxylic acid groups or other such polar groups (Fig. 1). Due to this range of structures, they also have a broad range of pKa values, resulting in significant differences in their behavior with the lipid membranes over the range of physiological pH values: from ∼2 in the stomach to ∼8 in the large intestine (7).
Figure 1.
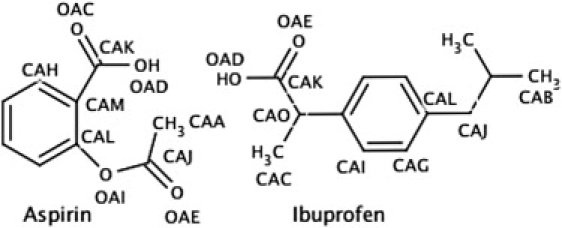
Structure of aspirin and ibuprofen with labeled atoms that have nonzero partial charges (Table S1).
The partitioning behavior of small solutes, drug molecules, and drug analogs in lipid membranes has been addressed by experiments, simulations, and theoretical methods (8–13). The heterogeneity in density, polarity, and packing along the thickness of the lipid membranes is difficult to incorporate in modeling these materials and poses a significant challenge in the interpretation of experimental studies of such drug-lipid adducts. The macroscopic measurable quantities in experiments are a result of complicated interactions of these drugs with the lipid membrane, which clearly depend on their position along the membrane thickness and cannot be addressed exclusively by experimental methods. Molecular along with coarse-grained simulation methods have the ability to bridge this gap between detailed membrane models and the experimentally observed quantities.
In this article, atomistic molecular dynamics simulations were performed to study the partitioning of two NSAIDs, namely, aspirin and ibuprofen in a model membrane made of dipalmitoylphosphatidylcholine (DPPC) molecules in their liquid crystalline state. The effect of the charge state of the drugs on the partitioning of the two drugs in the membrane was examined by considering the neutral (pH < pKa) and anionic forms (pH > pKa) of the drugs in these simulations. These simulations were analyzed to enable us to understand the thermodynamic interactions between the lipid and drug molecules, the role of electrostatics in such adducts, and the permeability of these drugs.
Methods and Models
Simulations were performed using the GROMACS 3.0 package (14,15). For the initial lipid bilayer structure, a well-equilibrated system containing 128 DPPC lipids and 3655 water molecules was used (16,17). This system of 128 DPPC lipids is one of the most widely used for MD studies in the literature and provides a reasonable tradeoff among the system size, computational expense, and useful information which can be obtained. Studies on solute partitioning using smaller systems have been shown to provide information that compare favorably with the experimental results and results that are largely system-size independent (12,13,18). The lipid molecules (19) and NSAID molecules (20) were modeled using the GROMOS force field and the water molecules were modeled using the simple-point charge model (21). Both the coordinates and partial charges of the NSAID molecules were generated using PRODRG (20), which is based on the GROMOS force field and generates partial charges based on the concept of charge groups such that a single molecular group of bonded atoms (e.g., COO) is assigned an integer charge (see Table S1 in the Supporting Material for partial charges). A time step of 2 fs was used and the integration was based on a leap-frog algorithm as implemented in GROMACS. The Lennard-Jones potential was switched at 1.0 nm to go smoothly to zero at 1.2 nm. Electrostatic interactions were computed using a particle-mesh Ewald sum (22) with a direct space cutoff at 1.4 nm and fast-Fourier grid space of 0.12 nm with fourth-order interpolation and a tolerance of 1 × 10⁻⁵. To calculate the short-range Lennard-Jones and the electrostatic interactions, a neighbor list over 1.4 nm was maintained and updated every 50 fs. The trajectory was saved every 20 ps for further analyses. The pressure and temperature were maintained at 1 bar and 323K (well above the gel-liquid transition temperature of 314K for DPPC) using a weak coupling to an external barostat (time constant 1 ps) and thermostat (time constant 0.1 ps), respectively (23). The simulation box was allowed to vary independently and isotropically in all directions to maintain the pressure with bilayer normal fixed along the z direction of the box. VMD software (24) was used for visualization and for drug insertion to create initial structures.
Computation of potential of mean force
The free energy of partitioning for the NSAIDs was estimated using the potential of mean constraint force (PMF) method (25). An NSAID molecule was constrained at different z locations (along the bilayer normal) of a preequilibrated DPPC bilayer membrane by constraining the z distance between the centers-of-mass (COM) of the drug and the bilayer. The drug molecule was then allowed to move unconstrained in the x-y plane. The constraint force, defined as Fi = miΔz/(Δt)2 (13), was monitored as a function of time, and the PMF as a function of the position (z) along the bilayer normal was estimated as
| (1) |
where ΔG(z) is the excess free energy defined with respect to that of drug being in water and F(z,t) is the constraint force at a particular location z along the bilayer normal. The integration of constraint force was done using trapezoidal rule and the zero for the integration was taken to be in the bulk water. Errors in the constraint force were first estimated by using block-averaging method (26) as implemented in GROMACS. These errors were then propagated on to the PMF using a trapezoidal rule. The choice of zero is arbitrary, as the uncertainty between two points will remain the same, with errors growing as one moves from one point in the PMF to another (12). Four cases were examined by MD simulations, namely: neutral aspirin (AN); charged aspirin (AC); neutral ibuprofen (IN); and charged ibuprofen (IC). Net charges of 0 and −1 for the neutral and charged drugs were used to represent the NSAIDs below and above their pKa, respectively (Fig. 1). For each of these cases, 16 z locations per monolayer (∼2 Å apart) that are equidistant along the bilayer normal, ranging from the bulk water to the middle of the bilayer, were explored. Each z location was explored in a separate simulation (5.1 ns run time each) to avoid any drug-drug interactions. The bilayer was assumed to be symmetric between two monolayers and all the properties, including the PMF profile, were calculated for one monolayer and assumed to apply to the other monolayer. The bilayer was modeled and all analyses were done based on the four-region model (25), which adequately represents heterogeneity in density, free volume, and polarity along the bilayer normal (Fig. 2 a). The above number of z locations has been shown to provide favorable comparison to experimental results for a number of small solutes (13,27). The x-y coordinates for each of the z locations were generated randomly (Fig. S1, detailed in the Supporting Material). The first 1.1 ns of the simulation were ignored for equilibration, whereas the PMF and various other analyses were done using the final 4 ns of the run. The effects of starting configuration and equilibration time on the PMF were addressed (Fig. S2, detailed in the Supporting Material) to arrive at the equilibration time of 1.1 ns. Errors in PMF profiles estimated using different starting configuration suggested (Supporting Material) that block averaging slightly underestimates the errors, whereas the PMF profiles remained qualitatively similar.
Figure 2.
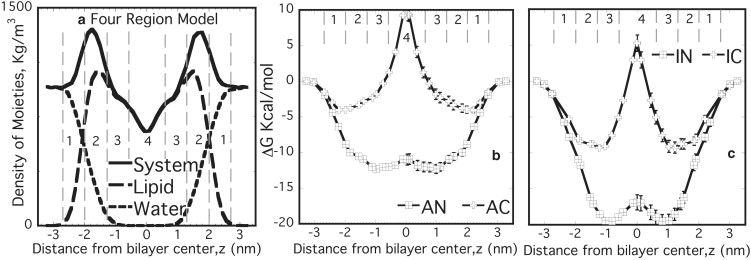
(a) Four-region model used as reference model. (Region 1, labeled 1) From bulk water until the point at which water and lipid densities are comparable (2.0–2.7 nm). (Region 2, labeled 2) High-density headgroup region where water density is <1% (1.3–2.0 nm). (Region 3, labeled 3) High-density tail region similar to bulk hexadecane (0.6–1.3 nm). (Region 4, labeled 4) Low-density tail region similar to bulk hexane (0–0.6 nm) with all distances referred from the bilayer center. Free energy profiles for (b) aspirin (AN and AC) and (c) ibuprofen (IN and IC). Profiles were estimated for half of the bilayer and assumed to be symmetric across the bilayer center.
Results and Discussion
Free energy
To understand the difference in behavior of NSAIDs below and above their pKa, the excess free energy for both the neutral and charged forms of aspirin and ibuprofen (namely AN, AC, IN, and IC, respectively) incorporated at various locations normal to the lipid bilayer were computed from well-equilibrated MD simulations (Fig. 2). For each case, there is a minimum in excess free energy for the incorporation of the drug in the lipid bilayer, although the z location of the free energy minimum changes somewhat depending on the charge-state and steric-size of the drug molecule. Nevertheless, the most significant aspects that can be discerned from these excess free energy data are:
-
1.
The minimum excess free energy (in comparison to water) is located in the lipid bilayer for both drugs and both charge states.
-
2.
The charged versions of the drugs exhibit a minimum closer to the headgroup of the lipid, whereas the neutral form is embedded in the central portion of the alkyl tails.
-
3.
The neutral versions of the drugs have larger (negative) excess free energies compared to their corresponding charged forms.
-
4.
The charged forms of the drugs have a positive excess free energy when located in the center of the bilayer, suggesting a strong incompatibility with this core region.
The partitioning of drugs into high density regions of the lipid occur despite the loss of translation entropy for the drug molecules; therefore, an enthalpically driven process though other sources of entropic gain, such as lipid disorder, cannot be ruled out.
The difference in positions of the free energy minima between AN and IN is relatively small at ∼0.2 nm. On the other hand, the difference for the case of the charged drugs, AC and IC, is nearly ∼1 nm. Comparison of free energy profiles with the location of some lipid moieties (Fig. S3) suggests that some of these differences come from the nature of interactions being different for aspirin and ibuprofen. Aspirin, being a smaller molecule with three polar O atoms, is more strongly governed by its electrostatic interactions with the headgroup. However, due to a larger nonpolar part, ibuprofen, even in the charged form, is primarily governed by its interactions with the hydrophobic tails. This is clearly evident from the much deeper free energy profile for IC as compared to that of AC. Further, the magnitudes of the free energy change for the two neutral drugs, when scaled by their respective molecular volumes (0.195 nm3 for aspirin and 0.306 nm3 for ibuprofen), virtually superimpose (Fig. 3). However, the magnitude of the free energy change for IC and AC, when scaled by their respective molecular volumes, did not lead to a convergence of the free energy profiles.
Figure 3.
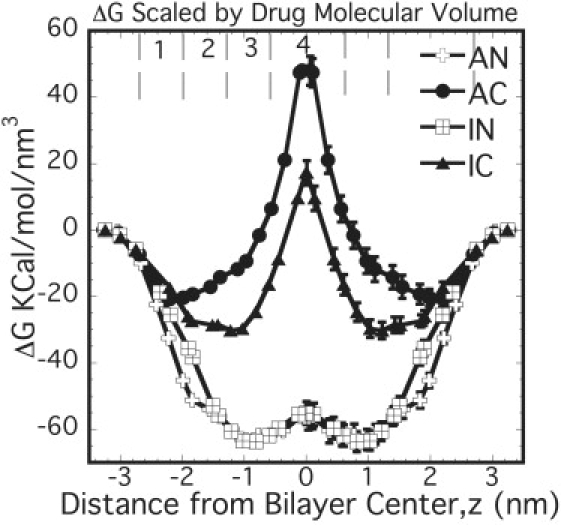
Free energy profiles for NSAIDs scaled by their respective molecular volumes. Profiles were estimated for half of the bilayer and assumed to be symmetric across the bilayer center.
The volume-based rescaling of the free energy profiles can be understood based on Flory-Huggins lattice theory (28). One of the components is small (i.e., a drug) occupying a single lattice site, whereas the other component (lipid) is like a polymer, occupying N lattice sites per molecule. The final free energy of mixing per site is given by
| (2) |
where ϕi is the volume fraction of component i (1 = drug and 2 = lipid) and χ is the interaction parameter characterizing the strength of interactions of drug-lipid compared to that of drug-drug and lipid-lipid. For the system studied here with 128 lipids and one drug molecule, ϕ1 → 0, ϕ2 → 1, and therefore
| (3) |
From the volume-based scaling, it is noted that whereas the drugs in neutral forms follow the above limiting case, the charged forms do not scale with the drug volume. One of the assumptions made in the Flory-Huggins theory is that the interactions between lattice sites are short-ranged (nearest neighbor). The above observation suggests that the interactions between neutral drugs and the lipid are reasonably short-ranged. However, in case of the charged forms the interactions are long-ranged, suggesting that both size and structure of the drugs play a role in dictating the partitioning of the charged drugs and cannot be rescaled using a single size parameter such as drug volume.
The strength of drug partitioning into the membrane can be assessed by a commonly used experimental parameter, the partition coefficient K, defined as
| (4) |
where ΔGWB is the partitioning free energy for the drug to go from water (W) to the bilayer (B). It is estimated, by the expression given in MacCallum and Tieleman (12) and as presented below (assuming that the drug is bound to the bilayer if it is within the region of z between −2.5 nm and 2.5 nm from the bilayer center),
| (5) |
Experimentally the lipophilicity of NSAIDs is studied using three different methods and parameters:
-
1.
Octanol-water partition coefficient (KOW).
-
2.
Reverse phased high performance liquid chromatography with different stationary phases including immobilized artificial membranes (kIAM) that can closely mimic lipid biomembranes (e.g., monolayer made of lecithin) (29,30).
-
3.
Partitioning into liposomal dispersions (9,31).
Although the octanol-water system is still a popular method to probe the lipophilicity of the drug, it cannot capture the specifics of the lipid, e.g., strong density variation along the bilayer normal and headgroup electrostatics. Table 1 compares the MD results obtained here with the values reported for aspirin and ibuprofen in the literature. The trends in K values are in excellent qualitative agreement with the experimental trends (log KIN > log KAN > log KIC > log KAC).
Table 1.
Comparison of free energy, permeability, and partition coefficient values from our MD simulations with that in the literature
| Property∗MW (g/mol)pKa | Aspirin180.23.5†‡§¶ |
Ibuprofen206.34.4–5.2†‡§¶‖††‡‡§§ |
||
|---|---|---|---|---|
| Neutral (pH ∼2) | Anionic (pH ∼7) | Neutral (pH ∼2) | Anionic (pH ∼7) | |
| ΔGOctanol KJ/mol | −35.5¶¶ | −40.2¶¶ | ||
| ΔGmin KJ/mol | −51.5 ± 2.6 | −16.9 ± 1.5 | −81.6 ± 3.9 | −36.6 ± 3.0 |
| Skin permeability (cm/s) | 300–30,400 10−9‖†† | 8.44 10−9†† | 170–8440 10−9¶‖†† | 172–333 10−9¶†† |
| Permeability (cm/s) | 244 ± 3 | 1.3 10−5 ± 0.2 10−5 | 92 ± 6 | 0.03 ± 0.04 |
| log (KOW or kIAM or KL) | 1.13–1.26†¶‖‖‖ | (−1.2)–(−0.95)†‖‖ | 3.5–4.21†¶‖‡‡§§ | (−0.05)–1.81†‡§§‖‖ |
| log K = log[exp(−ΔGmin/RT)] | 8.33 ± 0.42 | 2.74 ± 0.24 | 13.20 ± 0.63 | 5.93 ± 0.49 |
In first column: MW, molecular weight; OW, octanol/water system; IAM, immobilized artificial membrane; L, liposomal system.
IAM is made of monolayers of lecithin that have been immobilized (7).
IAM is made of phosphatidylcholine residues covalently bound to silica propylamine (58).
Data from Potts and Guy (38).
Data from Wenkers and Lippold (39).
Predicted using the model from Potts and Guy (38).
IAM is polymer-based (29).
Data from Avdeef et al. (31).
Data from Perlovich et al. (62).
Data from Miller et al. (61).
Hydrogen bonding
The presence of hydrogen bonds were established using two criteria: 1), the distance between the donor and acceptor is <0.35 nm; and 2), the angle made by the donor, the hydrogen, and the acceptor atom is <30° (32,33). The total number of hydrogen bonds between the ibuprofen polar O (OAE and OAD) and water were estimated as the average number of H-bonds in each 20-ps time frame over 4 ns and plotted with the free energy profile for the charged form (Fig. 4). The errors were estimated using the block-averaging method (26) as implemented in GROMACS. Clearly, IC has roughly an order-of-magnitude higher H-bonding than the corresponding neutral form IN (Fig. 4). Comparing the H-bonding profiles for charged and neutral drugs, it can be conjectured that H-bonding plays a key role in the partitioning of charged drugs. However, unlike aspirin (with three O atoms, Fig. S4), the location of maximum H-bonds for IC does not correlate with free energy minima—suggesting that as the drug size increases, the influence of H-bonding on the partitioning decreases. This indicates that the H-bonding opportunities alone (i.e., number of polar O atoms) cannot be attributed for the differences in the free energy profiles between AC and IC. As discussed before, drug structure and the interactions with the acyl chains play a crucial role for the charged forms.
Figure 4.
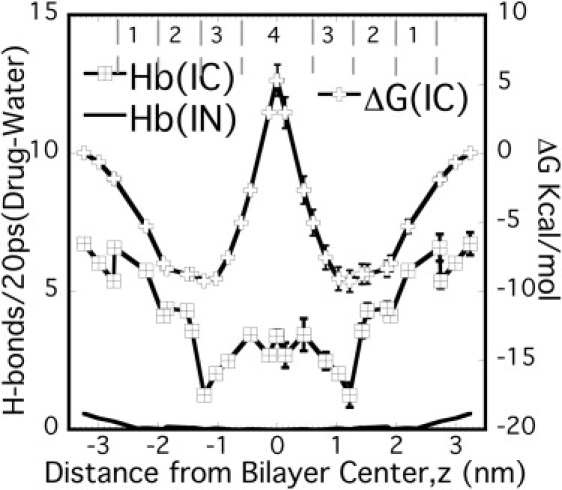
Average H-bonds/20 ps (each time frame) between the polar O atoms of ibuprofen and water along with the free energy profiles for IC. Free energy profiles and H-bonds were estimated for half of the bilayer and assumed to be symmetric across the bilayer center.
Drug hydration
The hydration of NSAIDs was quantified by estimating the total number of water molecules in the first hydration shell (i.e., N, the hydration number) of the radial distribution function (g(r)) (RDF) between the NSAIDs and water,
| (6) |
where N(r) is the number of water molecules in the shell of thickness dr at a distance r from the COM of the NSAID molecule and ρ is the number density of water molecules. The RDF between the drug and water was examined for one representative case, in which the drug was located deep inside the bilayer (∼0.4 nm from the bilayer center), to evaluate the maximum extent of hydration possible (Fig. 5). The RDF data show significant increase in hydration for the charged drugs compared to their neutral counterparts, as quantified by the hydration numbers (34).
Figure 5.
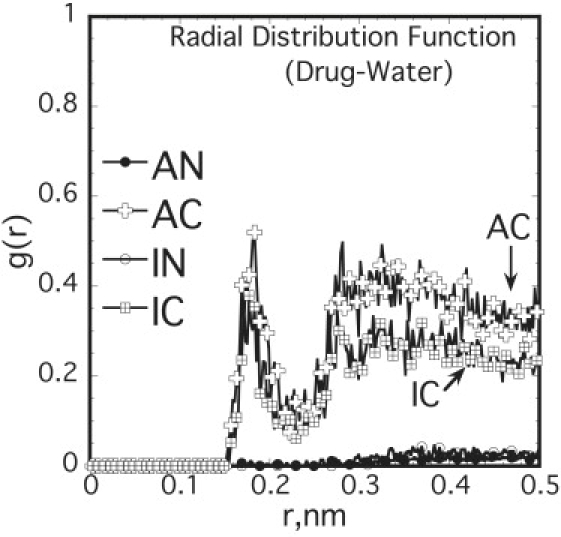
RDF between the centers-of-mass (COM) of drug (located at z ∼0.4 nm from the bilayer center) and water show difference in hydration between the neutral and charged forms of NSAIDs.
The hydration numbers at z ∼0.4 nm, obtained by integrating Eq. 6 up to the first minimum in the RDF, are 0.13 ± 0.02 and 0.09 ± 0.02 for AC and IC, respectively, although lying between 0 and 0.002 for the two neutral drugs (see Table S4 for list of hydration numbers at all z locations). Similar large differences in hydration were observed for other drug locations in each case. Clearly, for the charged cases the hydration is significantly enhanced compared to the neutral ones, indicating that the drugs in their charged state reside in the lipid bilayer as hydrated moieties. As discussed in detail later, this increase in hydration of the charged drug imparts significant local perturbation to the lipid molecules. The lipid molecules, adjacent to the incorporated drug molecule, tilt considerably to reduce the penalty of accommodating the water molecules in the hydrophobic region of the bilayer.
Permeability
The permeability of a small solute in the lipid bilayer can be estimated based on inhomogeneous solubility-diffusion mechanism in which the solute permeates in a three-step process involving partitioning-in, diffusion, and partitioning-out. Based on this mechanism, the steady-state flux J of solutes across the membrane depends on the thermodynamic driving force Δμ, and is given by (35,36)
| (7) |
where K(z) = exp(−ΔG(z)/kT) and D(z) are the local partition coefficient and local diffusion coefficient of the drug at a given z location along the bilayer normal, respectively. The integral in the above equation is the total resistance of the membrane obtained by the integration of local resistance. The permeability, therefore, is obtained as an inverse of the resistance as
| (8) |
The diffusion D(z) is related to the local static friction factor
as
| (9) |
where
is the fluctuation of the constraint force around its average over the simulation time (13). The force autocorrelation function was best fitted to a double-exponential function and suggests that two processes at different timescales are responsible for the force decay. Two relaxation times, one in the range of tens of femtoseconds (τ1) and another in the range of tens of picoseconds (τ2), were estimated from the force autocorrelation data (Fig. S7 a), similar to the behavior of small solutes such as benzene, ethane, etc., in lipid membranes (13).
The diffusion coefficients from Eq. 9 are roughly independent of the charge state, drug type, or z location, and are ∼2 × 10⁻⁶ cm2/s within the bilayer (Fig. S7 b). These values are roughly an order-of-magnitude lower than those in bulk water, and are consistent with the experimental results for similar molecules (7,37), where, for example, the diffusion for aspirin in the lecithin bilayer is estimated to be ∼2.3 × 10⁻⁶ cm2/s. We note that the diffusion coefficients reflect the trends observed for the slower relaxation time associated with the force autocorrelation function, and indicates that the slower relaxation process indeed dominates the diffusion of the drug in the bilayer membranes. Further analysis of drug COM movement in the x-y plane at various z locations over 5 ns shows that there are separated domains in the drug movement (Fig. 6), suggesting that the drug hops between domains. This was further ascertained from the mean-square displacement (Fig. S8).
Figure 6.
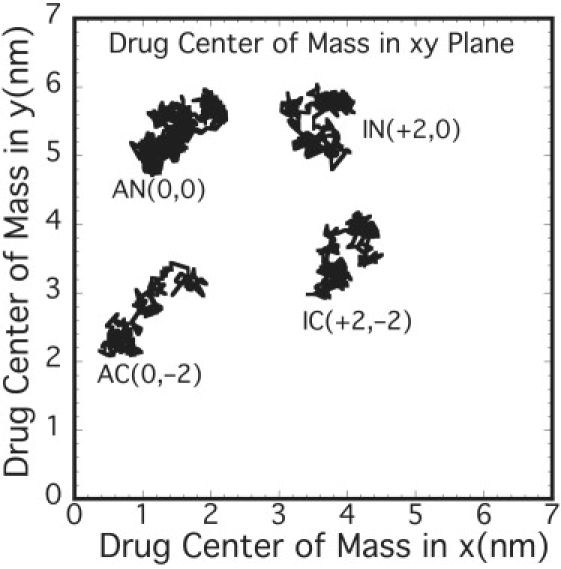
Center-of-mass (COM) movement of drugs in the bilayer x-y plane shows separated domains suggesting hopping mechanism for drug diffusion. The numbers in the brackets are arbitrary shifts in x and y of the COM.
Permeability values obtained using Eq. 8 are listed in Table 1. The permeability decrease from AN to IN to IC to AC indicates that both size and the drug charge affect drug permeability. The permeability data indicate that 1), the neutral drugs permeate faster than their charged counterparts; and 2), aspirin, the smaller drug, permeates faster than ibuprofen, a larger drug. Given the trends observed for the diffusion coefficient and described above, the significant differences in the permeability values observed are governed by the differences in partitioning between two charge states. One of the most widely used models (38) for predicting permeability (in skin) suggests that
| (10) |
This predicts a positive correlation between the permeability and the octanol-water partition coefficient and a weak negative correlation with molecular weight (MW). The simulation data indicate that the drug molecules that associate more strongly with the lipid also tend to permeate more slowly. This indicates a negative correlation between the drug partition coefficient and the permeability at variance with the above model, although in good agreement with some experiments (39). To definitively conclude the effect of drug size on their permeability through such membranes, a wider range of drugs need to be explored and is the topic of a more detailed study (M. B. Boggara and R. Krishnamoorti, unpublished).
On the other hand, two mechanisms have been widely employed to enable us to understand the permeation of hydrophobic or lipophilic drugs—namely the solubility-diffusion (SD) and the transient-pore (TP) mechanisms. In the SD mechanism, as mentioned before the solute first partitions to the membrane, then diffuses across the membrane and subsequently partitions out of the membrane (35,40). In the TP mechanism, thermal fluctuations of the membrane are thought to produce transient pores that would permit ion permeation (see (41,42) and references therein). The hydrophilic defects in the membranes are eventually covered by the tilted lipid headgroups resulting in a hydrophilic transmembrane pore through which charged species could pass in the membrane (43). As these pores (water-filled) can significantly reduce the energy of ion partitioning, the permeation of ions might be significantly increased, if this mechanism were to dominate. Some previous efforts point to the thickness of the bilayer chains playing a role in determining which of the two mechanisms will be dominant (13,44), whereas others have noted that the local chain packing along with molecular area of the drugs can significantly control the drug partitioning (27). In addition, specific interactions between the drug and the membrane, such as that of the reduction of the membrane dipole potential (45), can make the understanding of drug partitioning and permeation even more difficult.
In their neutral form, the NSAIDs, due to their compatibility with the lipid tail and the lack of hydration of the drug, could plausibly diffuse by this SD mechanism. However, for the charged forms of the drug, due to the significant specific interactions between the drug and the lipid and the hydration of the drugs, the SD mechanism is unlikely to be operative. On the other hand, significant evidence points to the TP mechanism being dominant in the case of passive ion permeation, especially for charged lipophilic moieties (46,47). As discussed below in more detail, the trajectory analyses of the MD simulations indicate that the charged forms of NSAIDs studied here are likely to follow the TP mechanism, whereas the neutral forms follow the SD mechanism.
To get detailed insight into the mechanism of permeation of NSAIDs, the time-dependent trajectories of both charged and neutral drugs at different z locations were analyzed, with special attention paid to the ones deep inside the hydrophobic region (z within ±1 nm from the bilayer center). For the case of the charged drugs, the trajectories at all z locations show that a large number of water molecules are accommodated in the bilayer, serving to hydrate the polar group of the drug and which are sustained throughout the simulation time (Fig. 7). The tilting of significant number of lipid molecules dramatically reduces the energy barrier for the presence of polar water molecules inside the hydrophobic tail region. These tilted lipid molecules, with their headgroups facing the water-fingers that protrude into the bilayer, are likely to further stabilize the water fingers. These water-fingers, in the case of charged drugs, protrude all the way up to the center of the bilayer, causing local bilayer thinning (Fig. 7). However, they only extend up to the bilayer center from one side and do not span across the entire bilayer membrane. Such water-fingers have been observed in a number of studies, addressing the partitioning behavior of charged and neutral forms of drug (48) or peptide molecules (49,50) as well as small polar molecules (51) in the lipid bilayer. Analyzing the trajectories of neutral drug molecules at similar z positions indicate that there is no water protrusion, except for a rare occasion in the case of IN, which was transient and existed for practically a very short period of time. As observed from the trajectory analyses and quantified by the hydration numbers, the charged drug permeates into the bilayer significantly hydrated. This hydration significantly screens the electrostatic interactions between the charged drug and the charges in the headgroup of the lipid, resulting in a much weaker dependence of the free energy of the drug on headgroup dipole.
Figure 7.
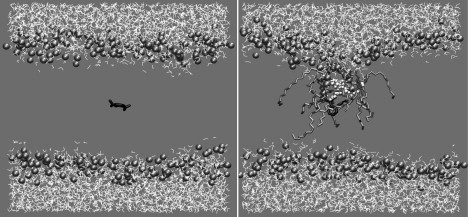
Snapshots for AC from MD trajectory analysis at 0 ps (left) and 5000 ps (right). Three features relevant to charged drug permeation (to be noted on the right): 1), excess water entering the bilayer (rendered in white space-filling representation); 2), lipid molecules tilting (rendered in licorice) to compensate the cost of water presence inside bilayer core; and 3), local asymmetric bilayer thinning.
Even though many protein and potassium channels that aid in ion transport operate as transmembrane channels, spontaneous formation of fully hydrophilic transmembrane channels or pores are not known to occur (42,52,53). Such pores can be caused by mechanical stress or electrical fields, usually caused by high transmembrane potentials (54), but, reseal within a few nanoseconds after the field is turned off (54–57). Even in the case of smaller monovalent ions such as Na+ and Cl− that permeate in hydrated forms, water-fingers protrude only from one side of the monolayer extending up to the center, but never become transmembrane pores (34). From the observations based on MD simulations, it can be conjectured that the water-fingers are more transient in nature and are never transmembrane. In the case of hydrophobic ions such as the NSAIDs studied here, the charged drug needs both hydrophobic tails and hydration by water to permeate through the bilayer. Considering the amphiphilic nature of the NSAIDs along with the fact that their permeation is significantly influenced by the free energy of partitioning in both neutral and charged forms, it can be conjectured that fully hydrophilic transmembrane pores, if formed, are indeed likely to hinder the permeation rates of these drugs. Thus, the primary mechanism of charged drug permeation is likely to be a TP mechanism along with hopping, whereas the SD mechanism along with hopping might explain the permeation of neutral forms of these drugs.
Summary and Conclusions
Detailed atomistic molecular dynamics simulations were performed to study the partitioning of two NSAIDs in DPPC lipid membrane in its fluid state. Two charge states of the drug were explored to account for its behavior at pH values above and below drug pKa. This study indicates that irrespective of the charge state, both NSAIDs partition inside the bilayer as compared to the bulk water. However, drug charge state, size, and structure all influence, to an extent, specific differences in the final free energy profile. Analyses indicate that although H-bonding primarily influences charged drug partitioning, as the drug size and hydrophobicity increases, it becomes less significant. It was also demonstrated that the MD simulations capture the details of the molecular mechanism of drug partitioning quite well. For example, the charged drugs permeate with their polar groups completely hydrated all the way up to the bilayer center—resulting in an asymmetric thinning of the bilayer. In addition, this hydration results in significant screening of the interaction between charged drug and the membrane dipole. Water-fingers that cause this thinning do not span transmembrane, but only extend halfway up to the bilayer center. However, neutral drugs are found to permeate unhydrated, without any formation of water-fingers. This shows that the solubility-diffusion mechanism is the likely mechanism of permeation of NSAIDs in neutral form, whereas charged NSAIDs are likely to follow the transient-pore mechanism. MD simulations predict the ranking order of the partition coefficients qualitatively, as observed in the experimental studies in the literature. From the drug COM movement, hopping seems to be the primary diffusion mechanism of NSAIDs both in charged and neutral forms. It is evident from the thermodynamics of partitioning of the two NSAIDs studied that the structure of the drug plays a key role and subsequently NSAIDs of different structures may induce different perturbations on the lipid membrane structure. For the PMF method at any instant, there is only one drug molecule as compared to 128 lipid molecules; hence it is not able to give any meaningful insight into the perturbation to lipid membrane structure due to drug.
Although the arguments presented in this work are convincing in the case where drug molecules are at low concentrations (i.e., the case of one drug molecule in the lipid membrane afforded by the PMF method), it is not necessarily clear as to how an ensemble of interacting drug molecules would interact with the lipid membrane, affect the structure of the membrane, and transport through the membrane. Based on the understanding obtained from this work, the effect of high concentrations of these drugs using MD simulations will be addressed (M. B. Boggara and R. Krishnamoorti, unpublished) in a systematic manner to enable us to understand the perturbations to membrane structure at comparable mole ratios to lipid (drug/lipid ratios ranging from 1:64 to 1:2) that are clinically relevant.
Supporting Material
Eight figures and four tables are available at http://www.biophysj.org/biophysj/supplemental/S0006-3495(09)01688-9.
Supporting Material
Acknowledgments
We acknowledge the Texas Learning & Computation Center at the University of Houston for the computational resources.
We thank the Texas Higher Education Coordinating Board through the Advanced Technology Program for partial financial support of this work. We also thank the National Science Foundation (grant No. CMMI-0708096) for partial financial support.
References
- 1.Donnelly M.T., Hawkey C.J. Review article: COX-II inhibitors—a new generation of safer NSAIDs? Aliment. Pharmacol. Ther. 1997;11:227–236. doi: 10.1046/j.1365-2036.1997.154330000.x. [DOI] [PubMed] [Google Scholar]
- 2.Vane J.R. Inhibition of prostaglandin synthesis as a mechanism of action for aspirin-like drugs. Nature. 1971;231:232–235. doi: 10.1038/newbio231232a0. [DOI] [PubMed] [Google Scholar]
- 3.Wallace J.L., Del Soldato P. The therapeutic potential of NO-NSAIDs. Fundam. Clin. Pharmacol. 2003;17:11–20. doi: 10.1046/j.1472-8206.2003.00125.x. [DOI] [PubMed] [Google Scholar]
- 4.Lichtenberger L.M. The hydrophobic barrier properties of gastrointestinal mucus. Annu. Rev. Physiol. 1995;57:565–583. doi: 10.1146/annurev.ph.57.030195.003025. [DOI] [PubMed] [Google Scholar]
- 5.Lichtenberger L.M. Where is the evidence that cyclooxygenase inhibition is the primary cause of nonsteroidal anti-inflammatory drug (NSAID)-induced gastrointestinal injury? Topical injury revisited. Biochem. Pharmacol. 2001;61:631–637. doi: 10.1016/s0006-2952(00)00576-1. [DOI] [PubMed] [Google Scholar]
- 6.Lichtenberger L.M., Romero J.J., Sanduja S.K. Development of an improved formulation of phosphatidylcholine (PC)—associated nonsteroidal anti-inflammatory drugs (NSAIDs) Gastroenterology. 2001;120:598. (Abstr.) [Google Scholar]
- 7.Barbato F., La Rotonda M.I., Quaglia F. Interactions of nonsteroidal antiinflammatory drugs with phospholipids: comparison between octanol/buffer partition coefficients and chromatographic indexes on immobilized artificial membranes. J. Pharm. Sci. 1997;86:225–229. doi: 10.1021/js960233h. [DOI] [PubMed] [Google Scholar]
- 8.Mitragotri S. A theoretical analysis of permeation of small hydrophobic solutes across the stratum corneum based on scaled particle theory. J. Pharm. Sci. 2002;91:744–752. doi: 10.1002/jps.10048. [DOI] [PubMed] [Google Scholar]
- 9.Balon K., Riebesehl B.U., Müller B.W. Determination of liposome partitioning of ionizable drugs by titration. J. Pharm. Sci. 1999;88:802–806. doi: 10.1021/js9804213. [DOI] [PubMed] [Google Scholar]
- 10.Marqusee J.A., Dill K.A. Solute partitioning into chain molecule interphases: monolayers, bilayer membranes, and micelles. J. Chem. Phys. 1986;85:434–444. [Google Scholar]
- 11.White S.H., King G.I., Cain J.E. Location of hexane in lipid bilayers determined by neutron diffraction. Nature. 1981;290:161–163. [Google Scholar]
- 12.MacCallum J.L., Tieleman D.P. Computer simulation of the distribution of hexane in a lipid bilayer: spatially resolved free energy, entropy, and enthalpy profiles. J. Am. Chem. Soc. 2006;128:125–130. doi: 10.1021/ja0535099. [DOI] [PubMed] [Google Scholar]
- 13.Bemporad D., Essex J.W., Luttmann C. Permeation of small molecules through a lipid bilayer: a computer simulation study. J. Phys. Chem. B. 2004;108:4875–4884. [Google Scholar]
- 14.Berendsen H.J.C., van der Spoel D., van Drunen R. GROMACS: a message-passing parallel molecular dynamics implementation. Comput. Phys. Commun. 1995;91:43–56. [Google Scholar]
- 15.Lindahl E., Hess B., van der Spoel D. GROMACS 3.0: a package for molecular simulation and trajectory analysis. J. Mol. Model. 2001;7:306–317. [Google Scholar]
- 16.Tieleman D.P., Berendsen H.J.C. Molecular dynamics simulations of a fully hydrated dipalmitoylphosphatidylcholine bilayer with different macroscopic boundary conditions and parameters. J. Chem. Phys. 1996;105:4871–4880. [Google Scholar]
- 17.Tieleman, D. P. 2002. http://moose.bio.ucalgary.ca/index.php?page=Structures_and_Topologies.
- 18.Ulander J., Haymet A.D.J. Permeation across hydrated DPPC lipid bilayers: simulation of the titrable amphiphilic drug valproic acid. Biophys. J. 2003;85:3475–3484. doi: 10.1016/S0006-3495(03)74768-7. [DOI] [PMC free article] [PubMed] [Google Scholar]
- 19.Berger O., Edholm O., Jähnig F. Molecular dynamics simulations of a fluid bilayer of dipalmitoylphosphatidylcholine at full hydration, constant pressure, and constant temperature. Biophys. J. 1997;72:2002–2013. doi: 10.1016/S0006-3495(97)78845-3. [DOI] [PMC free article] [PubMed] [Google Scholar]
- 20.Schuettelkopf A.W., Aalten D.M.F.v. PRODRG—a tool for high-throughput crystallography of protein-ligand complexes. Acta Crystallogr. 2004;D60:1355–1363. doi: 10.1107/S0907444904011679. [DOI] [PubMed] [Google Scholar]
- 21.Berendsen H.J.C., Postma J.P.M., Hermans J. Interaction models for water in relation to protein hydration. In: Pullman B., editor. Intermolecular Forces. Reidel, Dordrecht; The Netherlands: 1981. pp. 331–342. [Google Scholar]
- 22.Essmann U., Perera L., Pedersen L.G. A smooth particle mesh Ewald method. J. Chem. Phys. 1995;103:8577–8593. [Google Scholar]
- 23.Berendsen H.J.C., Postma J.P.M., Haak J.R. Molecular dynamics with coupling to an external bath. J. Chem. Phys. 1984;81:3684–3690. [Google Scholar]
- 24.Humphrey W., Dalke A., Schulten K. VMD: visual molecular dynamics. J. Mol. Graph. 1996;14 doi: 10.1016/0263-7855(96)00018-5. 33–38, 27–28. [DOI] [PubMed] [Google Scholar]
- 25.Marrink S.J., Berendsen H.J.C. Simulation of water transport through a lipid membrane. J. Phys. Chem. 1994;98:4155–4168. [Google Scholar]
- 26.Hess B. Determining the shear viscosity of model liquids from molecular dynamics simulations. J. Chem. Phys. 2002;116:209–217. [Google Scholar]
- 27.Bemporad D., Luttmann C., Essex J.W. Computer simulation of small molecule permeation across a lipid bilayer: dependence on bilayer properties and solute volume, size, and cross-sectional area. Biophys. J. 2004;87:1–13. doi: 10.1529/biophysj.103.030601. [DOI] [PMC free article] [PubMed] [Google Scholar]
- 28.Hiemenz P.C., Lodge T.P. 2nd ed. CRC Press; Boca Raton, FL: 2007. Polymer Chemistry. [Google Scholar]
- 29.Péhourcq F., Matoga M., Bannwarth B. Study of the lipophilicity of arylpropionic non-steroidal anti-inflammatory drugs: a comparison between LC retention data on a polymer-based column and octanol-water coefficients. J. Liq. Chromatogr. Rel. Technol. 2001;24:2177–2186. [Google Scholar]
- 30.Stewart B.H., Chan O.H. Use of immobilized artificial membrane chromatography for drug transport applications. J. Pharm. Sci. 1998;87:1471–1478. doi: 10.1021/js980262n. [DOI] [PubMed] [Google Scholar]
- 31.Avdeef A., Box K.J., Tam K.Y. pH-metric log P10. Determination of liposomal membrane-water partition coefficients of ionizable drugs. Pharm. Res. 1998;15:209–215. doi: 10.1023/a:1011954332221. [DOI] [PubMed] [Google Scholar]
- 32.van der Spoel D., van Maaren P.J., Tîmneanu N. Thermodynamics of hydrogen bonding in hydrophilic and hydrophobic media. J. Phys. Chem. B. 2006;110:4393–4398. doi: 10.1021/jp0572535. [DOI] [PubMed] [Google Scholar]
- 33.Modig K., Pfrommer B.G., Halle B. Temperature-dependent hydrogen-bond geometry in liquid water. Phys. Rev. Lett. 2003;90:075502. doi: 10.1103/PhysRevLett.90.075502. [DOI] [PubMed] [Google Scholar]
- 34.Wilson M.A., Pohorille A. Mechanism of unassisted ion transport across membrane bilayers. J. Am. Chem. Soc. 1996;118:6580–6587. doi: 10.1021/ja9540381. [DOI] [PubMed] [Google Scholar]
- 35.Berendsen H.J.C., Marrink S.J. Molecular dynamics of water transport through membranes: water from solvent to solute. Pure Appl. Chem. 1993;65:2513–2520. [Google Scholar]
- 36.Xiang T.X., Anderson B.D. The relationship between permeant size and permeability in lipid bilayer membranes. J. Membr. Biol. 1994;140:111–122. doi: 10.1007/BF00232899. [DOI] [PubMed] [Google Scholar]
- 37.Li J., Huang H., Zhao K. An NMR study of the structural basis of the wide range of pharmacological functions of acetylsalicylic acid. IUBMB Life. 1999;47:665–671. doi: 10.1080/15216549900201723. [DOI] [PubMed] [Google Scholar]
- 38.Potts R.O., Guy R.H. Predicting skin permeability. Pharm. Res. 1992;9:663–669. doi: 10.1023/a:1015810312465. [DOI] [PubMed] [Google Scholar]
- 39.Wenkers B.P., Lippold B.C. Skin penetration of nonsteroidal antiinflammatory drugs out of a lipophilic vehicle: influence of the viable epidermis. J. Pharm. Sci. 1999;88:1326–1331. doi: 10.1021/js990032o. [DOI] [PubMed] [Google Scholar]
- 40.Berendsen H.J.C., Marrink S.J. Permeation process of small molecules across lipid membranes studied by molecular dynamics simulations. J. Phys. Chem. 1996;100:16729–16738. [Google Scholar]
- 41.Paula S., Volkov A.G., Deamer D.W. Permeation of halide anions through phospholipid bilayers occurs by the solubility-diffusion mechanism. Biophys. J. 1998;74:319–327. doi: 10.1016/S0006-3495(98)77789-6. [DOI] [PMC free article] [PubMed] [Google Scholar]
- 42.Bordi F., Cametti C., Naglieri A. Ionic transport in lipid bilayer membranes. Biophys. J. 1998;74:1358–1370. doi: 10.1016/S0006-3495(98)77848-8. [DOI] [PMC free article] [PubMed] [Google Scholar]
- 43.Franklin J.C., Cafiso D.S. Internal electrostatic potentials in bilayers: measuring and controlling dipole potentials in lipid vesicles. Biophys. J. 1993;65:289–299. doi: 10.1016/S0006-3495(93)81051-8. [DOI] [PMC free article] [PubMed] [Google Scholar]
- 44.Sugii T., Takagi S., Matsumoto Y. A molecular-dynamics study of lipid bilayers: effects of the hydrocarbon chain length on permeability. J. Chem. Phys. 2005;123:184714. doi: 10.1063/1.2102900. [DOI] [PubMed] [Google Scholar]
- 45.Qin Z., Szabo G., Cafiso D.S. Anesthetics reduce the magnitude of the membrane dipole potential. Measurements in lipid vesicles using voltage-sensitive spin probes. Biochemistry. 1995;34:5536–5543. doi: 10.1021/bi00016a027. [DOI] [PubMed] [Google Scholar]
- 46.Nagle J.F. Theory of passive proton conductance in lipid bilayers. J. Bioenerg. Biomembr. 1987;19:413–426. doi: 10.1007/BF00770027. [DOI] [PubMed] [Google Scholar]
- 47.Volkov A.G., Paula S., Deamer D.W. Two mechanisms of permeation of small neutral molecules and hydrated ions across phospholipid bilayers. Bioelectrochem. Bioenerg. 1997;42:153–160. [Google Scholar]
- 48.Erdtman E., dos Santos D.J.V.A., Eriksson L.A. Modeling the behavior of 5-aminolevulinic acid and its alkyl esters in a lipid bilayer. Chem. Phys. Lett. 2008;463:178–182. [Google Scholar]
- 49.MacCallum J.L., Bennett W.F.D., Tieleman D.P. Distribution of amino acids in a lipid bilayer from computer simulations. Biophys. J. 2008;94:3393–3404. doi: 10.1529/biophysj.107.112805. [DOI] [PMC free article] [PubMed] [Google Scholar]
- 50.MacCallum J.L., Bennett W.F.D., Tieleman D.P. Partitioning of amino acid side chains into lipid bilayers: results from computer simulations and comparison to experiment. J. Gen. Physiol. 2007;129:371–377. doi: 10.1085/jgp.200709745. [DOI] [PMC free article] [PubMed] [Google Scholar]
- 51.Orsi M., Sanderson W.E., Essex J.W. Permeability of small molecules through a lipid bilayer: a multiscale simulation study. J. Phys. Chem. B. 2009;113:12019–12029. doi: 10.1021/jp903248s. [DOI] [PubMed] [Google Scholar]
- 52.Shrivastava I.H., Sansom M.S.P. Simulations of ion permeation through a potassium channel: molecular dynamics of KcsA in a phospholipid bilayer. Biophys. J. 2000;78:557–570. doi: 10.1016/S0006-3495(00)76616-1. [DOI] [PMC free article] [PubMed] [Google Scholar]
- 53.Tolpekina T.V., den Otter W.K., Briels W.J. Nucleation free energy of pore formation in an amphiphilic bilayer studied by molecular dynamics simulations. J. Chem. Phys. 2004;121:12060–12066. doi: 10.1063/1.1815296. [DOI] [PubMed] [Google Scholar]
- 54.Leontiadou H., Mark A.E., Marrink S.J. Ion transport across transmembrane pores. Biophys. J. 2007;92:4209–4215. doi: 10.1529/biophysj.106.101295. [DOI] [PMC free article] [PubMed] [Google Scholar]
- 55.Gurtovenko A.A., Vattulainen I. Pore formation coupled to ion transport through lipid membranes as induced by transmembrane ionic charge imbalance: atomistic molecular dynamics study. J. Am. Chem. Soc. 2005;127:17570–17571. doi: 10.1021/ja053129n. [DOI] [PubMed] [Google Scholar]
- 56.Tarek M. Membrane electroporation: a molecular dynamics simulation. Biophys. J. 2005;88:4045–4053. doi: 10.1529/biophysj.104.050617. [DOI] [PMC free article] [PubMed] [Google Scholar]
- 57.Tieleman D.P., Leontiadou H., Marrink S.J. Simulation of pore formation in lipid bilayers by mechanical stress and electric fields. J. Am. Chem. Soc. 2003;125:6382–6383. doi: 10.1021/ja029504i. [DOI] [PubMed] [Google Scholar]
- 58.Péhourcq F., Matoga M., Bannwarth B. Diffusion of arylpropionate non-steroidal anti-inflammatory drugs into the cerebrospinal fluid: a quantitative structure-activity relationship approach. Fundam. Clin. Pharmacol. 2004;18:65–70. doi: 10.1111/j.1472-8206.2004.00201.x. [DOI] [PubMed] [Google Scholar]
- 59.Hadgraft J., du Plessis J., Goosen C. The selection of non-steroidal anti-inflammatory agents for dermal delivery. Int. J. Pharm. 2000;207:31–37. doi: 10.1016/s0378-5173(00)00517-2. [DOI] [PubMed] [Google Scholar]
- 60.Ni N., Sanghvi T., Yalkowsky S.H. Independence of the product of solubility and distribution coefficient of pH. Pharm. Res. 2002;19:1862–1866. doi: 10.1023/a:1021449709716. [DOI] [PubMed] [Google Scholar]
- 61.Miller M.M., Wasik S.P., Mackay D. Relationships between octanol-water partition coefficient and aqueous solubility. Environ. Sci. Technol. 1985;19:522–529. doi: 10.1021/es00136a007. [DOI] [PubMed] [Google Scholar]
- 62.Perlovich G.L., Kurkov S.V., Bauer-Brandl A. Solvation and hydration characteristics of ibuprofen and acetylsalicylic acid. AAPS J. 2004;6:22–30. doi: 10.1208/ps060103. [DOI] [PMC free article] [PubMed] [Google Scholar]
Associated Data
This section collects any data citations, data availability statements, or supplementary materials included in this article.