

Abstract
Chronic inflammation in various organs, such as the brain, implies that different subpopulations of immune cells interact with the cells of the target organ. To monitor this cellular communication both morphologically and functionally, the ability to visualize more than two colors in deep tissue is indispensable. Here, we demonstrate the pronounced power of optical parametric oscillator (OPO)-based two-photon laser scanning microscopy for dynamic intravital imaging in hardly accessible organs of the central nervous and of the immune system, with particular relevance for long-term investigations of pathological mechanisms (e.g., chronic neuroinflammation) necessitating the use of fluorescent proteins. Expanding the wavelength excitation farther to the infrared overcomes the current limitations of standard Titanium:Sapphire laser excitation, leading to 1), simultaneous imaging of fluorophores with largely different excitation and emission spectra (e.g., GFP-derivatives and RFP-derivatives); and 2), higher penetration depths in tissue (up to 80%) at higher resolution and with reduced photobleaching and phototoxicity. This tool opens up new opportunities for deep-tissue imaging and will have a tremendous impact on the choice of protein fluorophores for intravital applications in bioscience and biomedicine, as we demonstrate in this work.
Introduction
Since its development in 1990 (1), two-photon laser scanning microscopy (TPLSM) has revolutionized our view of cellular and molecular dynamics, especially in terms of immune and neural processes in health and disease (2–6). Because of the advantages provided by near-infrared (NIR) two-photon excitation, including reduced scattering in tissue, optical sectioning, and reduced photobleaching and phototoxicity in out-of-focus regions (7), TPLSM allows highly resolved, dynamic, deep-tissue imaging in vital organ models and, even more importantly, in many organs of anesthetized small animals (i.e., intravital imaging) (8–11).
The requirements on intravital imaging for elucidating the mechanisms of various pathologies, such as chronic inflammation, are not only imaging depth and resolution over time, but also specific fluorophore stability during the duration of the disease. For instance, experimental autoimmune encephalomyelitis (EAE), the murine model of multiple sclerosis, helps us understand the cellular and molecular pathways of the neural damage induced by autoreactive immune cells, and thus requires fluorophore stability in the components of both the immune system and central nervous system (CNS) over a period of >8 weeks (6,12). In this context, the use of genetically expressed compartmentalized fluorescent proteins rather than synthetic dyes is the appropriate solution because it counteracts the limitations of dye staining, such as leakage and cellular stress due to dimethyl sulfoxide-based solvents (9).
Standard Titanium:Sapphire (Ti:Sa)-based TPLSM still has limitations for intravital investigations in disease due to 1), restricted imaging depths of ∼100–200 μm in long-term imaging experiments, depending on tissue constitution (9); 2), high nonlinear photobleaching of chromophores (13,14) as well as photodamage of the tissue at the focal plane (15); 3), dramatic depth- and tissue-dependent deterioration of spatial resolution (16); 4), signal overlapping with tissue endogenous fluorescence (17); and 5), a restricted range of applicable fluorescent proteins due to limited excitation wavelengths, i.e., only green fluorescent protein (GFP) derivatives can be used, and not the whole range of state-of-the-art red fluorescent proteins (RFPs), such as tdRFP (tddimer2 (12) RFP), monomeric RFP (mRFP), and mCherry (18,19). Some aspects of these limitations of standard Ti:Sa-based TPLSM have been addressed. For instance, with the use of low-repetition-rate Ti:Sa excitation (200 kHz), imaging depths as large as 1 mm were reached in cortex (20). However, the mean laser power was 1000 mW (i.e., peak power of 1.25 × 10⁸ mW), and verification in long-term imaging experiments is lacking. Furthermore, although a reduced phototoxic effect of a 1047 nm Ti:Sa beam as compared to a 488 nm beam was demonstrated in early-embryonic-stage mice, in this case deep-tissue imaging was irrelevant (21).
Since the depth-dependent loss of spatial resolution and signal/noise ratio (SNR), and its strong dependence on tissue constitution is caused mainly by scattering of the excitation photons in tissue, extending the excitation wavelength to the infrared (IR) (beyond 1050 nm) is a widely accepted solution to that limitation. Whereas TPLSM technologies, which employ chromium:forsterite lasers (1250–1350 nm) (22) or (linear or nonlinear) optical parametric amplifiers ((N)OPA) (23) as excitation sources, still need to be adapted for in vivo and intravital application, we demonstrate that limitations in penetration depth, resolution, and photobleaching, particularly in intravital imaging, can be overcome by using an optical parametric oscillator (OPO), which extends the excitation wavelength range up to 1600 nm. The OPO has already been applied in two-photon ultraviolet fluorescence microscopy, coherent anti-Stokes Raman microscopy, and second/third harmonic generation, and very recently also in TPLSM in superficial organs (i.e., a skin-chamber model) (24-26). Here, we evaluate and demonstrate the striking benefits of OPO-based intravital TPLSM applied to hardly accessible organs, i.e., the brain and lymph node, in long-term measurements with relevance for the elucidation of pathological mechanisms.
In this work, we evaluate the effect of long-wavelength IR excitation of OPO versus NIR excitation of Ti:Sa by comparing the fluorescence signal of Ti:Sa-excited EGFP and OPO-excited tdRFP specifically expressed in different tissues and organs of living mice (see Table S1 in the Supporting Material). Apart from monitoring cellular interaction and dynamics in different organs, we are able to visualize the functional response of CNS cells in the brain stem of EAE-affected mice to autoimmune inflammation. This is possible only if the immune and CNS cells, which express fluorescent proteins with extremely different excitation and emission spectra (i.e., Cerulean, EGFP, Citrine, and tdRFP) are visualized by means of dual Ti:Sa- and OPO-based TPLSM. Furthermore, our studies reveal that expanding two-photon excitation to IR in combination with RFPs clearly contributes to higher resolution deep within tissue, increased penetration depths, a reduction of intravital photobleaching, and enables the simultaneous excitation of different RFPs, e.g., mCherry and tdRFP.
Materials and Methods
Dual NIR/IR excitation setup for TPLSM
Experiments were performed using a specialized two-photon laser scanning microscope based on a commercial scan head (TriMScope; LaVision BioTec, Bielefeld, Germany). The setup allows for dual NIR (700–1020 nm) and IR (1050–1600 nm) excitation, i.e., simultaneous two-photon excitation of the sample with a Ti:Sa laser (MaiTai; SpectraPhysics, Darmstadt, Germany) and a synchronously pumped OPO (APE, Berlin, Germany) (Fig. S1). The repetition rates of the Ti:Sa laser and the OPO are identical due to the construction principle (i.e., 80 MHz), whereas the pulse width in the sample is ∼120 fs over the whole wavelength range of Ti:Sa and ∼140 fs for OPO (see the Supporting Material).
Mice
The transgenic mouse strains used in our experiments are listed in Table S1, and further information about their provenance and handling can be found in the Supporting Material.
Cell culture
T cells for brain slice coculture experiments were isolated from 2d2 EGFP and 2d2 tdRFP TCR transgenic mice and cultured as described in the Supporting Material (6,27). EGFP- and tdRFP-expressing T cell populations, used in brain slice T cell cocultures, showed similar motility and activation status.
For lentiviral particle production, HEK 293 FT cells (Invitrogen, Karlsruhe, Germany) were maintained in D-10 medium (Dulbecco's modified Eagle's medium with 10% FCS supplemented with 2 mM L-glutamine, 1 mM Na pyruvate, 100 μM NAA, 100 U/mL penicillin, 100 μg/mL streptomycin). Transfection procedures were done in serum-free OptiMem (Invitrogen).
T cell transduction
For T cell transduction, 2 × 10⁶ in vitro cultured and differentiated 2d2 TCR transgenic T cells were supplemented with 2–10 × 106 viral particles encoding mCherry (multiplicity of infection: 1–5) on days 5–7 after (re)stimulation and cultured for at least 3 days in cell culture medium before they were used in TPLSM experiments. The generation of viral particles is described in the Supporting Material.
Brain slice culture
Acute hippocampal slices were prepared as described in the Supporting Material. For the brain slice coculture, T cells were pipetted onto the slice and allowed to invade the slice for ∼1 h before imaging; image acquisition was usually performed for ∼2–3 h per slice. For determination of spatial resolution, red and yellow-green fluorescent microspheres, instead of T cells, were applied on the brain slices.
Lymph node preparation
Four weeks before the lymph nodes were prepared, tdRFP- and EGFP-expressing T cells were injected intravenously into Rag 1−/− transgenic C57BL/6 mice. The mice were then killed and the lymph nodes were isolated, placed on a glass slide, embedded in antifade nonfluorescent media, kept in a specialized spacer on the glass slide, and covered by a transparent film before image acquisition.
Preparation of the imaging field for intravital imaging
Mice were anesthetized with 1.5% isoflurane in oxygen/nitrous oxide (2:1) via a facemask. The mice were then tracheotomized and continuously respirated with a Harvard Apparatus Advanced Safety Respirator (Hugo Sachs, March-Hugstetten, Germany). The anesthetized animal was transferred to a custom-built operation and microscopy table, and fixed in a hanging position. The preparation of the imaging field was performed according to adapted protocols for cortical imaging (28). In brief, the brain stem was exposed by carefully removing musculature above the dorsal neck area and removing the dura mater between the first cervical vertebra and occipital skull bone. The head was inclined for access to deeper brain stem regions, and the brain stem was superfused with isotonic Ringer solution. A sterile agarose patch (0.5% in 0.9% NaCl solution) was installed on the now-exposed brain surface to reduce heartbeat and breathing artifacts. During surgery and microscopy, body temperature was maintained at 37°. The depth of anesthesia was controlled by continuous CO2 measurements of exhaled gas and recorded with a CI-240 Microcapnograph (Columbus Instruments, Columbus, OH).
The animal experiments were approved by the appropriate state committees for animal welfare (Landesamt für Gesundheit und Soziales) and were performed in accordance with current guidelines and regulations.
Results
Intravital multicolor four-dimensional imaging of compartmentalized fluorescent proteins by means of dual NIR/IR excitation TPLSM
To reveal the power of combining NIR excitation of Ti:Sa with IR excitation of OPO, we employed dual NIR/IR excitation TPLSM for intravital deep-tissue imaging to visualize immune cells within the CNS, which is a target not only for physiological immune surveillance, but also for autoimmune neuroinflammation, such as EAE, which mimics the human disease multiple sclerosis (6). Typical migration and interaction patterns of different immune cell subpopulations in the CNS are shown as examples in Movie S1 and Movie S2.
Using dual excitation TPLSM, three fluorescent proteins were visualized simultaneously in the brain stem of living CerTN L15 mice, i.e., mice expressing Cerulean (enhanced cyan fluorescent protein (ECFP) variant) and Citrine (yellow fluorescent protein (YFP) derivative) as a fluorescence resonance energy transfer (FRET) pair indicating the cytosolic Ca2+ level in neurons (29), during the interaction of neurons with tdRFP-expressing immune cells (bone-marrow chimera; Table S1) in the course of EAE. Intravital three-color, four-dimensional (4D) imaging (three dimensions + time) revealed that the communication between immune cells and neurons resulted in transient calcium fluctuations and an overall increased calcium concentration in the neurons (Fig. 1). These data prove the direct attack of immune cells on neurons during the disease course.
Figure 1.
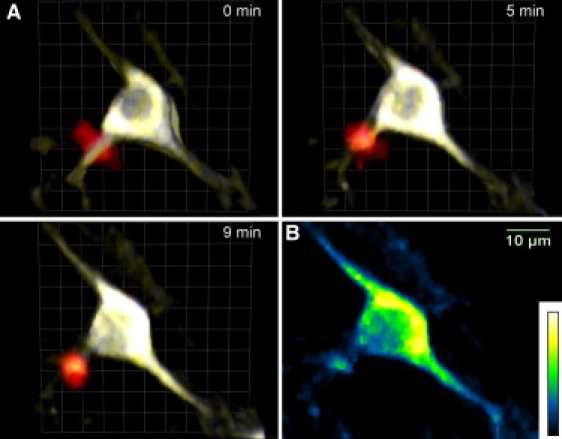
Intravital three-color 4D imaging of compartmentalized fluorescent proteins in the brain stem of anesthetized mice. (A) Dual NIR/IR excitation TPLSM allows the visualization of cellular dynamics and interactions in the brain stem of an EAE-affected CerTN L15 mouse with a tdRFP-expressing immune compartment, i.e., by bone-marrow chimera. The neurons of CerTN L15 mice express a Ca2+ biosensor based on a Cerulean (ECFP-derivative)/Citrine (YFP-derivative) FRET pair. Thus, the simultaneous Ti:Sa (850 nm) and OPO (1110 nm) excitation allows monitoring of Ca2+ responses of neurons (blue and yellow) during the interaction with immune cells (red). (B) A representative Ca2+ image of a neuron; blue and yellow represent low and high Ca2+ levels , respectively, on the false color scale.
Two-photon excitation spectra and cross sections of fluorescent proteins
We further compared the optical performance of OPO- and Ti:Sa-based TPLSM setups in terms of depth-dependent spatial resolution (ddSR), depth-dependent SNR (ddSNR), and photobleaching/phototoxicity in tissue. We imaged EGFP and tdRFP expressed in various tissue types to ensure the generalizability of our findings. EGFP and tdRFP were excited at typical wavelengths of the Ti:Sa (850 nm and 920 nm) and OPO (1110 nm), respectively.
The excitation spectra of the investigated fluorescent proteins (Fig. 2) were measured in the investigated cellular environments. Since all spectra were corrected for peak laser photon flux (in photon/cm2 · s) and for cellular autofluorescence at each excitation wavelength, they represent the relative active two-photon absorption cross section (ϕ · δ) spectra (where ϕ is the fluorescence quantum yield, and δ is the two-photon absorption cross section). Since the excitation efficiency of EGFP at 850 nm is 65% of the maximal excitation efficiency at 920 nm in both T cells and neurons, we performed the experiments on EGFP at both 850 nm (a typical wavelength of the Ti:Sa considering the fluorescence spectrum of the crystal) and 920 nm. Analogous experiments on tdRFP were carried out at 1110 nm.
Figure 2.
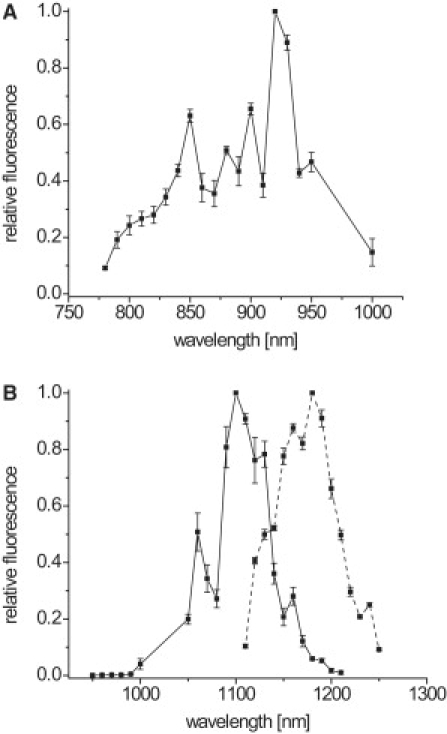
Two-photon excitation spectra of EGFP, tdRFP, and mCherry. (A) Excitation spectrum of EGFP. (B) Excitation spectra of tdRFP (solid line) and mCherry (dashed line). The spectra were measured in T cells expressing EGFP, tdRFP or mCherry. Data were corrected for the peak photon flux in photons per excitation volume and time at the sample and for the endogenous cellular fluorescence at each wavelength. Thus, the spectra represent relative wavelength-dependent, two-photon cross sections of the investigated fluorescent proteins. The absolute two-photon cross sections, measured relative to Rhodamin B in methanol (30) amounted to δEGFP = 23 ± 1 GM at λexc = 850 nm, and δtdRFP = 20.2 ± 0.8 GM at λexc = 1110 nm in 20 mM Tris-HCl/150 mM NaCl (for further details see the Supporting Material and Results); ϕEGFP = 0.6 and ϕtdRFP = 0.68 (18,31).
The absolute values of the two-photon absorption cross-sections of purified EGFP and tdRFP excited at 850 nm and 1110 nm, respectively, were determined relative to a well-characterized dye, rhodamin B in methanol (30). The two-photon cross section of EGFP amounts to 23.0 ± 1 GM at λexc = 850 nm, that of tdRFP is 20.2 ± 0.8 GM at λexc = 1110 nm, and the fluorescence quantum yields of EGFP and tdRFP are similar: 0.6 (31) and 0.68 (18), respectively (for further details see the Supporting Material).
Depth-dependent spatial resolution
The spatial resolution of an imaging system is determined by the dimensions of the effective point spread function (ePSF) of a punctiform object with dimensions below the resolution limit (16). We measured the ePSFs by collecting the local 3D fluorescence signal of red fluorescent (580/605) and yellow-green fluorescent (505/515) microbeads with analogous excitation and emission spectra to tdRFP and EGFP, respectively (Fig. 3 A).
Figure 3.
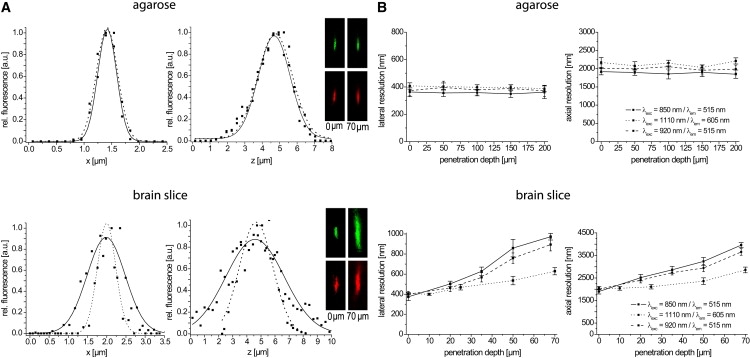
DdSR in agarose films and in acute brain slices. The lateral and axial resolution of the setup was measured on 200 nm red fluorescent (λexc = 1110 nm, λem = 605 nm) and yellow-green fluorescent (λexc = 850 nm or λexc = 920 nm, λem = 515 nm) polystyrene beads. (A) Typical axial and lateral profiles of the experimentally determined ePSF of a representative yellow-green (solid line) and red (dotted line) fluorescent bead at 70 μm depth in agarose (top) and brain tissue (bottom) are shown. The lateral and axial resolution is given by the full width at half-maximum of the Gaussian fit. Representative xz-projections of a red (bottom) and yellow-green (top) microsphere, respectively, at the surface and at 70 μm depth illustrate the spatial resolution for 850 nm excitation by Ti:Sa as compared to 1110 nm excitation by OPO. (B) Mean axial and lateral resolution (n = 5–10 beads) for 850 nm (solid line), 920 nm (dashed line), and 1110 nm (dotted line) excitation is plotted at various imaging depths. Error bars are mean ± SE.
In agarose, a homogeneous scattering medium, we observed a 1.1-fold better resolution of the yellow-green beads (lateral 360 ± 31 nm, axial 1880 ± 106 nm at 850 nm) as compared to the red beads (lateral 398 ± 22 nm, axial 2129 ± 97 nm at 1110 nm) due to different excitation wavelengths (Fig. 3 B). The measured resolution at λexc = 850 nm agrees well with the prediction of the paraxial approximation (368 nm and 1775 nm). However, slight differences in the diameter of the Ti:Sa and OPO beams at the back aperture of the objective lens led to deviations from the expected linear dependence of the spatial resolution on the excitation wavelength, which implies a ratio of 1.3-fold (32). Independently of the excitation wavelength, the spatial resolution did not change down to 1095 μm with increasing penetration depth.
Although agarose medium is particularly appropriate for benchmarking experiments because it is easy to handle, there are distinct differences between it and the target system, i.e., the tissue (16). This became evident in measurements on highly scattering tissue of hippocampal brain slices, which revealed a depth-dependent deterioration in axial and lateral resolution for all excitation wavelengths (Fig. 3). Hence, the spatial resolution at the surface was comparable to that measured in agarose, i.e., 374 ± 38 nm and 1900 ± 109 nm at λexc = 850 nm; 400 ± 28 nm and 2002 ± 118 nm at λexc = 920 nm; and 406 ± 10 nm and 2044 ± 67 nm at λexc = 1110 nm (Fig. 3B). However, at 70 μm depth it deteriorated to 973 ± 33 nm and 3958 ± 113 nm at λexc = 850 nm, to 894 ± 63 nm and 3654 ± 147 nm at λexc = 920 nm, and to 629 ± 36 nm and 2857 ± 127 nm at λexc = 1110 nm. It is noteworthy that the depth-dependent deterioration of spatial resolution at λexc = 1110 nm was significantly lower (laterally 1.5× and axially 1.4×) than that at λexc = 920 nm (laterally 2.2× and axially 1.8×), which was slightly lower than that at λexc = 850 nm (laterally 2.6× and axially 2.1×) as illustrated in Fig. 3 B.
DdSNR and maximal penetration depth
The maximal penetration depth is defined as the penetration depth at which the decreasing fluorescence signal reaches the level of the background noise, i.e., the ddSNR becomes one. The SNR is calculated as the ratio of the fluorescence signal to the noise of the background, i.e., the width of the Poisson distribution of the background. To ensure the generalizability of our results, we performed experiments both in vital models (i.e., cocultures of acute brain slices with invaded T cells and explanted lymph nodes) and in living organisms (i.e., in the brain stem or cortex of anesthetized mice; intravital imaging).
Typical ddSNR curves of EGFP-expressing T cells excited at 850 nm or 920 nm, and of tdRFP-expressing T cells excited at 1110 nm measured in brain slices (Fig. 4 A) reveal that in hippocampal tissue the maximal imaging depth of 160 μm for excitation of EGFP (λem = 525 nm) at 920 nm is only slightly increased as compared to the 150 μm measured at λexc = 850 nm, whereas an improvement of 40% is attained if the excitation of tdRFP is performed at 1110 nm (λem = 570 nm), i.e., a maximal imaging depth of 210 μm is reached. The maximal penetration depth in lymph nodes of Rag 1−/− mice previously intravenously injected with EGFP- and tdRFP-expressing T cells typically amounted to 130 μm for EGFP at λexc = 850 nm, and 140 μm at λexc = 920 nm, whereas excitation of tdRFP at λexc = 1110 nm resulted in a 190 μm imaging depth, i.e., an improvement of 46% was achieved due to the higher excitation wavelength (Fig. 4 B).
Figure 4.
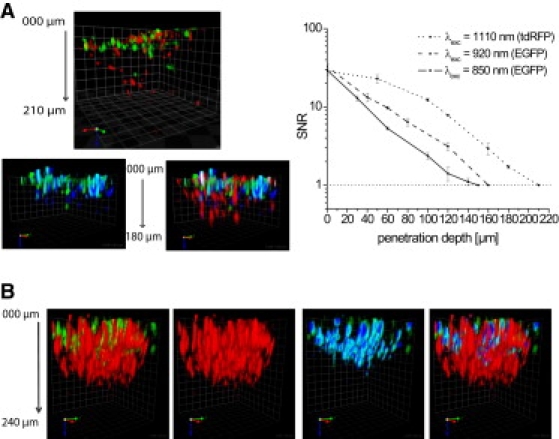
DdSNR and maximal penetration depth in cocultures of acute brain slices with T cells and explanted lymph nodes. (A) Representative ddSNR plots (right) measured at the same region of a brain slice invaded by EGFP- and tdRFP-expressing T cells and corresponding perspective 3D fluorescence images (left) recorded in 2 μm z-steps. (B) Typical 3D fluorescence images of explanted lymph nodes derived from Rag 1−/− mice reconstituted with EGFP- and tdRFP-expressing T cells. Square size: (A) 30 μm × 30 μm; (B) 20 μm × 20 μm. EGFP was excited with either 3.13 × 10⁵ mW peak power of Ti:Sa at 850 nm (solid line, green cells in 3D images) or 3.13 × 10⁵ mW peak power of Ti:Sa at 920 nm (dashed line, blue cells in 3D images). tdRFP was excited with 3.03 × 10⁵ mW peak power at 1110 nm of OPO (dotted line, red cells in the 3D images). For spectral separation, a 560 nm dichroic mirror and 525/50 (EGFP) as well as 593/40 (tdRFP) interference filters were used. In all graphs, error bars are mean ± SE.
We further compared ddSNR decays and the maximal penetration depth under intravital conditions in the brain stem and cortex of Thy1-21 EGFP (λexc = 850 nm or λexc = 920 nm) and Nex-Cre tdRFP mice (λexc = 1110 nm) characterized by neuronal fluorescent protein expression (Table S1 and Fig. 5). In the brain stem, typical maximal penetration depths for EGFP excitation amounted to 160 μm at λexc = 850 nm and 174 μm at λexc = 920 nm. However, excitation of tdRFP at λexc = 1110 nm resulted in a maximal imaging depth of 276 μm, revealing an improvement of 72.5% for excitation at 1110 nm as compared to 850 nm (Fig. 5 A). Similarly, in the cortex we determined a maximal penetration depth of 282 μm at λexc = 850 nm (EGFP), 292 μm at λexc = 920 nm (EGFP), and 508 μm at λexc = 1110 nm (tdRFP), demonstrating an improvement of 80% (Fig. 5 B).
Figure 5.
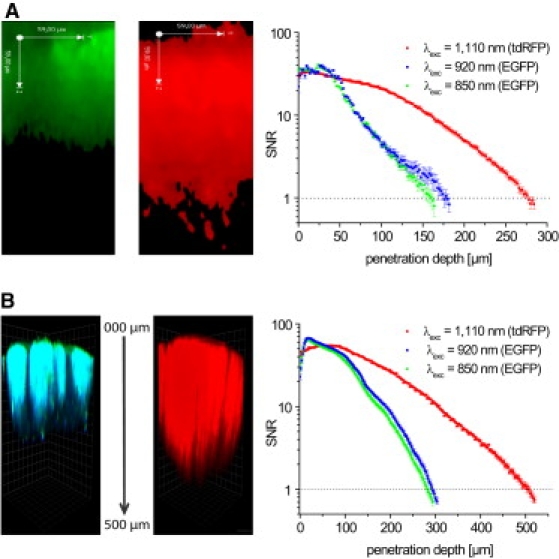
DdSNR and maximal penetration depth in the brain stem and cortex of anesthetized mice (intravital imaging). ddSNR plots (A and B, right), corresponding fluorescence images of yz-projections (A, left) and perspective 3D fluorescence images (B, left) recorded under intravital conditions in the brain stem (A) and cortex (B) of Thy1-21 EGFP or Nex-cre tdRFP mice, i.e., expressing EGFP or tdRFP in neurons, respectively, are shown. Square size in B is 30 μm × 30 μm. EGFP was excited with either 3.13 × 10⁵ mW peak power of Ti:Sa at 850 nm (green graph, green cells in yz-projection (A) and in 3D image (B)) or 3.13 × 10⁵ mW peak power of Ti:Sa at 920 nm (blue graph, blue cells in 3D image (B)). tdRFP was excited with 3.03 × 10⁵ mW peak power of OPO at 1110 nm (red graph, red cells in yz-projection (A) and in 3D image (B)). For spectral separation, a 560 nm dichroic mirror and 525/50 (EGFP) as well as 593/40 (tdRFP) interference filters were used. In all graphs, error bars are mean ± SE.
In all experiments, the excitation of EGFP and tdRFP, respectively, was performed at 3.3 × 1029photon/cm2 · s (3.13 × 10⁵ mW peak power at the surface) at 850 nm, 3.0 × 1029 photon/cm2 · s (3.13 × 10⁵ mW peak power at the surface) at 920 nm, and 3.2 × 1029 photon/cm2 · s (3.0 × 10⁵ mW peak power at the surface) at 1110 nm. The corresponding excitation rates during a laser pulse are 2.5 × 10¹⁰ s−1 for EGFP at 850 nm, 3.9 × 10¹⁰ s−1 for EGFP at 920 nm, and 2.07 × 10¹⁰ s−1 for tdRFP at 1110 nm. The fluorescence signal at the surface of the sample was similar for both fluorescent proteins at the indicated excitation wavelengths in the respective sample type (brain slice, lymph node, brain stem, or cortex), i.e., 3500–4000 counts, independently of the detection unit. Although an exponential increase of the mean excitation power with increasing imaging depth in tissue is widely used (33), we omitted this step to avoid artifacts caused by a more complicated image acquisition.
Photobleaching and phototoxicity
To investigate pathological mechanisms in real time and in their genuine environment, dynamic intravital two-photon imaging is required. Apart from the parameters that define the image quality, i.e., ddSR and ddSNR, the limitations of the method are related to fluorescence signal loss due to photobleaching of fluorophores (fluorescent proteins), and to functionality and morphology loss due to photodamage of the tissue over longer imaging periods.
In cocultures of hippocampal slices with EGFP- and tdRFP-expressing T cells, we confirmed the typical nonlinear dependence of the photobleaching rate on the peak photon flux of the excitation laser (34). The slope of the double logarithmic dependence of the photobleaching rate kbl on the peak photon flux is 2.57 ± 0.25 for EGFP excited at 850 nm, and 2.90 ± 0.14 for tdRFP excited at 1110 nm (Fig. S3). However, the photobleaching rate of EGFP (λexc = 850 nm) is ∼2 times higher than that of tdRFP (λexc = 1110 nm) at similar excitation rates, as illustrated in Fig. 6, A and B. For instance, at an excitation rate of 4.16 × 10¹⁰ s−1 (5.21 × 10⁵ mW peak power at the surface), kbl of EGFP amounts to 0.131 min−1, whereas kbl of tdRFP at 3.4 × 10¹⁰ s−1 excitation rate (4.93 × 10⁵ mW peak power at the surface) is 0.056 min−1, i.e., kblEGFP:kbltdRFP is 2.34 (Fig. 6 B).
Figure 6.
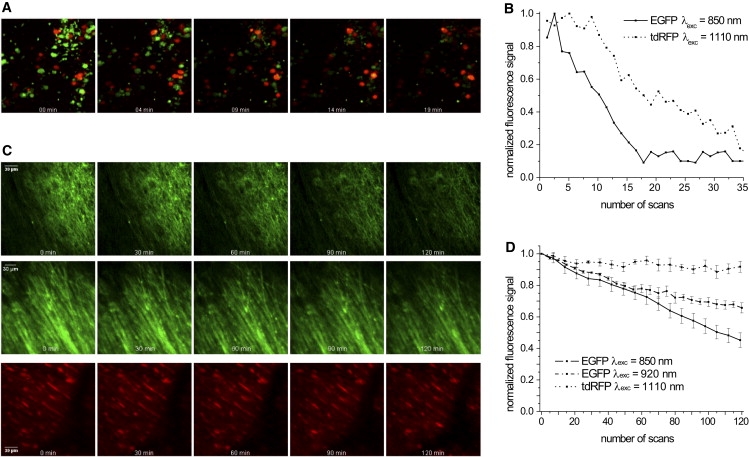
Photobleaching behavior in hippocampal brain slices and brain stem of living anesthetized mice. (A) Photobleaching of EGFP- and tdRFP-expressing T cells in brain slice cocultures. Representative fluorescence images summed up over 100 μm (z-step: 2 μm) are shown for simultaneous excitation by Ti:Sa and OPO at 5.21 × 10⁵ mW and 4.96 × 10⁵ mW peak laser power, respectively. The corresponding relative fluorescence (F(t = n min)/F(t = 0 min)) decay curves caused by photobleaching of EGFP at λexc = 850 nm (solid line) and tdRFP at λexc = 1110 nm (dotted line) are shown in B. Fluorescence images were acquired each minute for >30 min. (C) Representative images summed up over 100 μm 3D stacks display photobleaching during intravital imaging on the brain stem of anesthetized Thy1-21 EGFP and CNP tdRFP mice at 850 nm (top), 920 nm (middle), and 1110 nm (bottom) excitation. The peak laser power was 5.21 × 10⁵ mW at 850 nm and 920 nm, and 4.96 × 10⁵ mW at 1110 nm. The acquisition time of fluorescence images (z-step: 2 μm) was >1 h, with one 3D stack per minute. The corresponding quantification of fluorescence signal loss over time is shown in D for 850 nm (solid line), 920 nm (dashed line), and 1110 nm (dotted line). In all graphs, error bars are mean ± SE.
Similar results were obtained in intravital photobleaching experiments in the brain stem of EGFP Thy1-21 mice and tdRFP CNP mice (Table S1 and Fig. 6C). The photobleaching rate of EGFP excited at 850 nm (kbl = 6.22 × 10⁻³ min−1) is 1.8 times higher than after excitation at 920 nm (kbl = 3.53 × 10⁻³ min−1). However, the photobleaching rate of tdRFP excited at 1110 nm (kbl = 1.01 × 10⁻³ min−1) is even 3.5 times lower than that of EGFP excited at 920 nm (Fig. 6 D). Of note, the photobleaching rate in our intravital studies was significantly lower (up to 50-fold) for both fluorescent proteins as compared to brain slice experiments. Presumably, intact blood flow ensures a more reliable removal of reactive oxygen species, which may contribute to increased photobleaching stability in anesthetized mice. For the above-described intravital imaging experiments, excitation rates amounted to 2.5 × 10¹⁰ s−1 for EGFP excited at 850 nm (3.13 × 10⁵ mW peak power at the surface), 3.19 × 10¹⁰ s−1 for EGFP excited at 920 nm (3.13 × 10⁵ mW peak power at the surface), and 2.07 × 10¹⁰ s−1 (3.0 × 10⁵ mW peak power at the surface) for tdRFP excited at 1110 nm.
In all photobleaching experiments, 3D stacks of fluorescence images (between 0 and 100 μm depth from the surface, z-step: 2 μm) of the same region in brain slices and of similar areas in the brain stem of anesthetized mice were recorded each minute for time periods of >30 min and 120 min, respectively (Fig. 6, A and D).
To address the issue of tissue phototoxicity at 850 nm and 1110 nm, we performed imaging experiments in the brain stem of CerTN L15 mice. Under the illumination conditions used in our experiments, i.e., a scan field of 300 × 300 μm2 at a scanner frequency of 800 Hz and up to 5.21 × 10⁵ mW peak laser power at 850 nm and 920 nm and 4.96 × 10⁵ mW peak laser power at 1110 nm, we were able to repeatedly image the same volume (∼300 × 300 × 100 μm3) of brain tissue each minute up to 7 h without observing any laser illumination-induced increase of the intracellular Ca2+ level, which would be a sign of functional photodamage (15).
New perspectives for OPO-based TPLSM: RFPs
Given the clear advantages of long-wavelength (IR) excitation demonstrated in our experiments, we sought to determine whether RFPs alone can be used for multicolor two-photon applications. To that end, we performed experiments on mixtures of mCherry- and tdRFP-expressing T cells. Since a transgenic mouse model expressing mCherry is lacking so far, we induced mCherry expression by lentiviral gene transfer. By simultaneous excitation of mCherry- and tdRFP-expressing T cells at 1170 nm of OPO, we demonstrated that these fluorescent proteins can be spectrally separated by using corresponding analyzing optics (Fig. 7).
Figure 7.
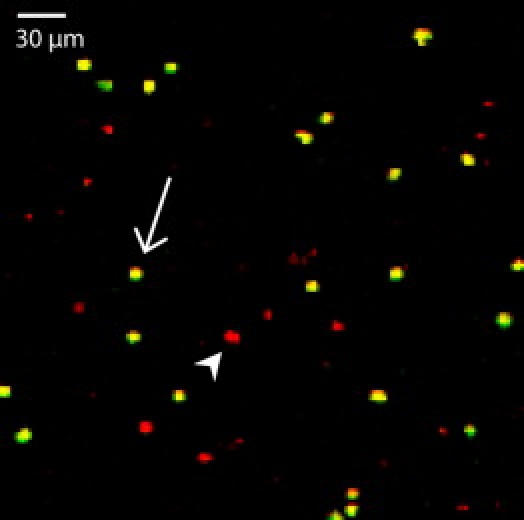
Spectral separation of mCherry- and tdRFP-expressing T cells. mCherry-expressing T cells, generated by lentiviral gene transfer of in vitro activated and differentiated 2d2 T cells, were mixed with tdRFP-expressing T cells. Simultaneous excitation of both T cell types at 1170 nm by OPO and spectral analysis using a 605 nm dichroic mirror and 593/40 (tdRFP) and 624/30 (mCherry) interference filters allows spectral separation of the RFPs with yellow-appearing cells as tdRFP (arrow) and red-appearing cells as mCherry-expressing T cells (arrowhead).
Discussion
TPLSM is currently the most powerful tool for high-resolution deep-tissue imaging. Over the past decade, a large number of publications have demonstrated that TPLSM has a critical role in intravital imaging applications in the fields of immunology and neuroscience, and have provided novel insights into immune responses in the lymph node and the motility of CNS cells in the brain (35,36). However, before TPLSM can be used to investigate pathological mechanisms with the aim of developing new therapeutic strategies, two central requirements must be met: 1), the fluorophores must specifically label cells over the whole duration of the disease (i.e., only fluorescent proteins specifically expressed in transgenic mice can be used); and 2), the same region in the sample deep within living tissue must be repeatedly imaged over hours at the highest possible resolution to elucidate the basics of cell dynamics and function in a specific disease (37). In this study, we were able for the first time, to our knowledge, to use dual Ti:Sa and OPO-based TPLSM, to monitor neuronal calcium fluctuations, i.e., neuronal function, in response to autoimmune inflammation in the CNS of living mice affected by EAE, and demonstrate that the neurons are directly attacked by the immune cells in the course of the disease.
Our PSF experiments demonstrate that IR excitation of OPO as compared to NIR excitation of Ti:Sa counteracts the depth-dependent deterioration of spatial resolution in tissue, i.e., at 70 μm depth in brain tissue a 1.7-fold improvement of both lateral and axial resolution is achieved under 1110 nm excitation as compared to 850 nm excitation. Considering that in TPLSM, which is based on photomultiplier tube detection, the spatial resolution is determined mainly by the excitation rather than the emission wavelength, this improvement must be accounted for solely by the longer wavelength excitation. Indeed, the electromagnetic radiation of longer wavelength used for excitation is less scattered by large anisotropic particles in tissue, i.e., the mean free path ls of ballistic excitation photons between two scattering events in tissue approximately scales with λexc−2 (38). The aforementioned dependence of the scattering parameter ls on the excitation wavelength is the main reason for the increased ddSNR in deeper layers, i.e., the increased maximal penetration depth at 1110 nm excitation wavelength of tdRFP as compared to the 850 nm or 920 nm excitation wavelength of EGFP in various tissue types. This holds true both in vital models (i.e., cocultures of acute brain slices with T cells or explanted lymph nodes) and intravitally in the brain stem and cortex of anesthetized mice. Additionally, the longer emission wavelength of tdRFP (579 nm) as compared to EGFP (509 nm) significantly contributes to improved imaging depths due to reduced scattering of fluorescence photons at 579 nm as compared to 509 nm, which ensures a better collection of fluorescence from deeper tissue layers. Further factors, such as the laser pulse width and shape, and the distance between the sample and the detection unit, which may influence the scattering of excitation and emission photons, and thus the imaging depth (33), were either kept constant or were similar for the two investigated setups. Since ddSNR experiments on EYFP-expressing T cells compared to tdRFP-expressing cells, in which fluorescent protein expression was based on the same promoter (Rosa26 locus), showed similar ratios regarding improved imaging depths in acute brain slices, we expect that our findings are not subject to artifacts due to promoter variety or to fluorophore choice (data not shown).
The significant differences in ddSNR and maximal penetration depth in the investigated models can be explained by the mean free path ls between two scattering events in each tissue type at a constant excitation wavelength. Whereas in lymph nodes ls can be as low as 20 μm at 800 nm due to a high number of nuclei per volume unit (38), in brain tissue this may strongly vary due to factors such as different metabolic states (39). In acute hippocampal slices, ls amounts to 47 μm (39) as compared to 200 μm in the cortex of anesthetized mice (33) at an excitation wavelength of 800 nm. These values agree well with our findings, which indicate much larger imaging depths in the cortex than in brain slices, and larger imaging depths in brain slices than in lymph nodes. The lower imaging depth in the brain stem as compared to the cortex under intravital conditions can be explained by higher myelinization of superficial neuronal processes, and by a higher density of neural mass in the brain stem as compared to the cortex (33).
Apart from the striking improvements in image quality afforded by intravital TPLSM due to IR excitation by OPO as compared to NIR excitation by Ti:Sa, we investigated photobleaching and phototoxicity in the compared setups because of their particular relevance for studies of cell dynamics and interactions under intravital conditions. We found that photobleaching of EGFP at both 850 nm and 920 nm is stronger than that of tdRFP at 1110 nm at similar excitation rates and in similar or identical tissue regions. We assume that this trend is determined mainly by the molecular photophysics of EGFP and tdRFP. Hence, our experiments show the implicit advantage of OPO IR excitation over Ti:Sa NIR excitation, i.e., the possibility to apply the whole range of novel fluorescent proteins with improved properties, such as improved photobleaching characteristics. Furthermore, at the excitation peak powers and excitation rates used in our intravital experiments, neither functional photodamage revealed by an increased intracellular Ca2+ level nor morphological photodamage could be detected at any excitation wavelength.
In conclusion, exploiting the full capacities of long-wavelength (IR) excitation by OPO beyond 1100 nm, as demonstrated in this work, combined with the newest developments of transgenic mice expressing RFPs, opens a new dimension of long-term intravital imaging that is necessary to better understand and cure diseases.
Supporting Material
Materials and methods, references, a table, three figures, and two movies are available at http://www.biophysj.org/biophysj/supplemental/S0006-3495(09)01677-4.
Supporting Material
Acknowledgments
We thank R. Tsien, S. Haesler, and C. Scharff for providing plasmids for lentiviral particle production; O. Griesbeck for providing the CerTN L15 transgenic mice; A. Waismann for providing the C57BL/6 2d2 TCR transgenic mice; K. A. Nave for providing the C57BL/6 J-CNP.Cre and C57BL/6 Nex-Cre transgenic mice; P. Caroni for providing the C57BL/6 Thy1-21 EGFP transgenic mice; and H. Luche and H. J. Fehling for providing the C57BL/6 Rosa-tdRFP knock-in mice. We also thank N. Asselborn, R. Günther, and J. Lips for technical assistance; K. Faelber and O. Daumke for providing expertise and equipment for protein expression and purification; and L. Mann for carefully reading the manuscript. J.H., V.S., and R.N. designed and performed research, and analyzed data. J.H., R.N., V.S., and F.Z. wrote the manuscript. R.N. and F.Z. initiated, organized, and supervised the project. A.E.H. provided expertise in lymph node preparation. A.U.B., T.L., and H.R. performed the experiments.
This study was supported by the Deutsche Forschungsgemeinschaft (grants SFB/TRR 43, GRK 1258, and NI 1167/2-1).
References
- 1.Denk W., Strickler J.H., Webb W.W. Two-photon laser scanning fluorescence microscopy. Science. 1990;248:73–76. doi: 10.1126/science.2321027. [DOI] [PubMed] [Google Scholar]
- 2.Cahalan M.D., Parker I. Choreography of cell motility and interaction dynamics imaged by two-photon microscopy in lymphoid organs. Annu. Rev. Immunol. 2008;26:585–626. doi: 10.1146/annurev.immunol.24.021605.090620. [DOI] [PMC free article] [PubMed] [Google Scholar]
- 3.Hauser A.E., Junt T., Haberman A.M. Definition of germinal-center B cell migration in vivo reveals predominant intrazonal circulation patterns. Immunity. 2007;26:655–667. doi: 10.1016/j.immuni.2007.04.008. [DOI] [PubMed] [Google Scholar]
- 4.Helmchen F., Svoboda K., Tank D.W. In vivo dendritic calcium dynamics in deep-layer cortical pyramidal neurons. Nat. Neurosci. 1999;2:989–996. doi: 10.1038/14788. [DOI] [PubMed] [Google Scholar]
- 5.Miller M.J., Wei S.H., Parker I. Autonomous T cell trafficking examined in vivo with intravital two-photon microscopy. Proc. Natl. Acad. Sci. USA. 2003;100:2604–2609. doi: 10.1073/pnas.2628040100. [DOI] [PMC free article] [PubMed] [Google Scholar]
- 6.Siffrin V., Brandt A.U., Zipp F. Differential immune cell dynamics in the CNS cause CD4+ T cell compartmentalization. Brain. 2009;132:1247–1258. doi: 10.1093/brain/awn354. [DOI] [PubMed] [Google Scholar]
- 7.Zipfel W.R., Williams R.M., Webb W.W. Nonlinear magic: multiphoton microscopy in the biosciences. Nat. Biotechnol. 2003;21:1369–1377. doi: 10.1038/nbt899. [DOI] [PubMed] [Google Scholar]
- 8.Centonze V.E., White J.G. Multiphoton excitation provides optical sections from deeper within scattering specimens than confocal imaging. Biophys. J. 1998;75:2015–2024. doi: 10.1016/S0006-3495(98)77643-X. [DOI] [PMC free article] [PubMed] [Google Scholar]
- 9.Germain R.N., Miller M.J., Nussenzweig M.C. Dynamic imaging of the immune system: progress, pitfalls and promise. Nat. Rev. Immunol. 2006;6:497–507. doi: 10.1038/nri1884. [DOI] [PubMed] [Google Scholar]
- 10.Rocheleau J.V., Piston D.W. Two-photon excitation microscopy for the study of living cells and tissues. Curr. Protoc. Cell Biol. 2003;Chapter 4:Unit 4.11. doi: 10.1002/0471143030.cb0411s20. [DOI] [PubMed] [Google Scholar]
- 11.Speier S., Nyqvist D., Berggren P.O. Noninvasive in vivo imaging of pancreatic islet cell biology. Nat. Med. 2008;14:574–578. doi: 10.1038/nm1701. [DOI] [PMC free article] [PubMed] [Google Scholar]
- 12.Schulze-Topphoff U., Prat A., Zipp F. Activation of kinin receptor B1 limits encephalitogenic T lymphocyte recruitment to the central nervous system. Nat. Med. 2009;15:788–793. doi: 10.1038/nm.1980. [DOI] [PMC free article] [PubMed] [Google Scholar]
- 13.Eggeling C., Volkmer A., Seidel C.A. Molecular photobleaching kinetics of Rhodamine 6G by one- and two-photon induced confocal fluorescence microscopy. ChemPhysChem. 2005;6:791–804. doi: 10.1002/cphc.200400509. [DOI] [PubMed] [Google Scholar]
- 14.Petrásek Z., Schwille P. Photobleaching in two-photon scanning fluorescence correlation spectroscopy. ChemPhysChem. 2008;9:147–158. doi: 10.1002/cphc.200700579. [DOI] [PubMed] [Google Scholar]
- 15.Hopt A., Neher E. Highly nonlinear photodamage in two-photon fluorescence microscopy. Biophys. J. 2001;80:2029–2036. doi: 10.1016/S0006-3495(01)76173-5. [DOI] [PMC free article] [PubMed] [Google Scholar]
- 16.Niesner R., Andresen V., Gunzer M. The power of single and multibeam two-photon microscopy for high-resolution and high-speed deep tissue and intravital imaging. Biophys. J. 2007;93:2519–2529. doi: 10.1529/biophysj.106.102459. [DOI] [PMC free article] [PubMed] [Google Scholar]
- 17.Masters B.R., So P.T., Gratton E. Multiphoton excitation fluorescence microscopy and spectroscopy of in vivo human skin. Biophys. J. 1997;72:2405–2412. doi: 10.1016/S0006-3495(97)78886-6. [DOI] [PMC free article] [PubMed] [Google Scholar]
- 18.Campbell R.E., Tour O., Tsien R.Y. A monomeric red fluorescent protein. Proc. Natl. Acad. Sci. USA. 2002;99:7877–7882. doi: 10.1073/pnas.082243699. [DOI] [PMC free article] [PubMed] [Google Scholar]
- 19.Shaner N.C., Campbell R.E., Tsien R.Y. Improved monomeric red, orange and yellow fluorescent proteins derived from Discosoma sp. red fluorescent protein. Nat. Biotechnol. 2004;22:1567–1572. doi: 10.1038/nbt1037. [DOI] [PubMed] [Google Scholar]
- 20.Theer P., Hasan M.T., Denk W. Two-photon imaging to a depth of 1000 microm in living brains by use of a Ti:Al2O3 regenerative amplifier. Opt. Lett. 2003;28:1022–1024. doi: 10.1364/ol.28.001022. [DOI] [PubMed] [Google Scholar]
- 21.Squirrell J.M., Wokosin D.L., Bavister B.D. Long-term two-photon fluorescence imaging of mammalian embryos without compromising viability. Nat. Biotechnol. 1999;17:763–767. doi: 10.1038/11698. [DOI] [PMC free article] [PubMed] [Google Scholar]
- 22.Chan M.C., Liu T.M., Sun C.K. Compact fiber-delivered Cr:forsterite laser for nonlinear light microscopy. J. Biomed. Opt. 2005;10:054006. doi: 10.1117/1.2060586. [DOI] [PubMed] [Google Scholar]
- 23.Manzoni C., Vozzi C., Cerullo G. Generation of high-energy self-phase-stabilized pulses by difference-frequency generation followed by optical parametric amplification. Opt. Lett. 2006;31:963–965. doi: 10.1364/ol.31.000963. [DOI] [PubMed] [Google Scholar]
- 24.Andresen V., Alexander S., Friedl P. Infrared multiphoton microscopy: subcellular-resolved deep tissue imaging. Curr. Opin. Biotechnol. 2009;20:54–62. doi: 10.1016/j.copbio.2009.02.008. [DOI] [PubMed] [Google Scholar]
- 25.Büttner, E., S. Carrasco, …, X. S. Xie. 2007. CARS imaging with a new 532-nm synchronously pumped picosecond OPO. Proc. SPIE. 6442:6442OC.
- 26.Kao F.J. The use of optical parametric oscillator for harmonic generation and two-photon UV fluorescence microscopy. Microsc. Res. Tech. 2004;63:175–181. doi: 10.1002/jemt.20026. [DOI] [PubMed] [Google Scholar]
- 27.Nitsch R., Pohl E.E., Zipp F. Direct impact of T cells on neurons revealed by two-photon microscopy in living brain tissue. J. Neurosci. 2004;24:2458–2464. doi: 10.1523/JNEUROSCI.4703-03.2004. [DOI] [PMC free article] [PubMed] [Google Scholar]
- 28.Göbel W., Helmchen F. New angles on neuronal dendrites in vivo. J. Neurophysiol. 2007;98:3770–3779. doi: 10.1152/jn.00850.2007. [DOI] [PubMed] [Google Scholar]
- 29.Heim N., Garaschuk O., Griesbeck O. Improved calcium imaging in transgenic mice expressing a troponin C-based biosensor. Nat. Methods. 2007;4:127–129. doi: 10.1038/nmeth1009. [DOI] [PubMed] [Google Scholar]
- 30.Xu C., Webb W.W. Measurement of two-photon excitation cross sections of molecular fluorophores with data from 690 to 1050 nm. J. Opt. Soc. Am. B. 1996;13:481–491. [Google Scholar]
- 31.Patterson G.H., Knobel S.M., Piston D.W. Use of the green fluorescent protein and its mutants in quantitative fluorescence microscopy. Biophys. J. 1997;73:2782–2790. doi: 10.1016/S0006-3495(97)78307-3. [DOI] [PMC free article] [PubMed] [Google Scholar]
- 32.Gu M. Springer; Berlin: 2000. Advanced Optical Imaging Theory. [Google Scholar]
- 33.Helmchen F., Denk W. Deep tissue two-photon microscopy. Nat. Methods. 2005;2:932–940. doi: 10.1038/nmeth818. [DOI] [PubMed] [Google Scholar]
- 34.Patterson G.H., Piston D.W. Photobleaching in two-photon excitation microscopy. Biophys. J. 2000;78:2159–2162. doi: 10.1016/S0006-3495(00)76762-2. [DOI] [PMC free article] [PubMed] [Google Scholar]
- 35.Nimmerjahn A., Kirchhoff F., Helmchen F. Resting microglial cells are highly dynamic surveillants of brain parenchyma in vivo. Science. 2005;308:1314–1318. doi: 10.1126/science.1110647. [DOI] [PubMed] [Google Scholar]
- 36.Tang Q., Adams J.Y., Bluestone J.A. Visualizing regulatory T cell control of autoimmune responses in nonobese diabetic mice. Nat. Immunol. 2006;7:83–92. doi: 10.1038/ni1289. [DOI] [PMC free article] [PubMed] [Google Scholar]
- 37.Niesner R.A., Andresen V., Gunzer M. Intravital two-photon microscopy: focus on speed and time resolved imaging modalities. Immunol. Rev. 2008;221:7–25. doi: 10.1111/j.1600-065X.2008.00582.x. [DOI] [PubMed] [Google Scholar]
- 38.Caccia M., Sironi L., Granucci F. Image filtering for two-photon deep imaging of lymphonodes. Eur. Biophys. J. 2008;37:979–987. doi: 10.1007/s00249-008-0323-y. [DOI] [PubMed] [Google Scholar]
- 39.Oheim M., Beaurepaire E., Charpak S. Two-photon microscopy in brain tissue: parameters influencing the imaging depth. J. Neurosci. Methods. 2001;111:29–37. doi: 10.1016/s0165-0270(01)00438-1. [DOI] [PubMed] [Google Scholar]
Associated Data
This section collects any data citations, data availability statements, or supplementary materials included in this article.