

Abstract
Motivation: Genome-wide association studies are beginning to elucidate how our genetic differences contribute to susceptibility and severity of disease. While computational tools have previously been developed to support various aspects of genome-wide association studies, there is currently a need for informatics solutions that facilitate the integration of data from multiple sources.
Results: Here we present GWAS Analyzer, a database driven web-based tool that integrates genotype and phenotype data, association analysis results and genomic annotations from multiple public resources. GWAS Analyzer contains features for browsing these interrelated data, exploring phenotypic values by family or genotype, and filtering association results based on multiple criteria. The utility of the tool has been demonstrated by a genome-wide association study of human in vitro susceptibility to bacterial infection. GWAS Analyzer facilitated management of large sets of phenotype and genotype data, analysis of phenotypic variation and heritability, and most importantly, generation of a refined set of candidate single nucleotide polymorphisms (SNPs). The tool revealed a SNP that was experimentally validated to be associated with increased cell death among Salmonella infected HapMap cell lines.
Availability: http://www.nwrce.org/gwas-analyzer
Contact: mbrittna@u.washington.edu
Supplementary Information: Supplementary data are available at Bioinformatics online.
1 INTRODUCTION
Recent progress made by the International HapMap Project (Frazer et al., 2007) and improvements in genotyping technology have facilitated the use of genome-wide association studies for linking specific genetic variants with human disease. Genome-wide association studies employ whole genome comparisons of allele frequencies among individuals to find correlations between particular single nucleotide polymorphisms (SNPs) and a phenotype under study. These studies have been successful in identifying SNPs that increase susceptibility to diseases such as diabetes (Saxena et al., 2007; Sladek et al., 2007) and Crohn's disease (Hampe et al., 2007; Rioux et al., 2007). A challenge that researchers may face when performing such studies, however, is a means for efficiently managing and analyzing data. Genome-wide association studies typically produce large amounts of data including family structure of the individuals participating in the study, their genotypes across the whole genome, and measured phenotypic values. Statistical analyses for finding significant genotype–phenotype associations must be run on the data and the results then filtered for further investigation.
There exist several software tools that assist researchers with various aspects of genome-wide association studies. For example, GenoDB (Li et al., 2001), T.I.M.S (Monnier et al., 2005), SNPLims (Orro et al., 2008), SNPP (Zhao et al., 2005) and OpenADAM (Yeung et al., 2008) are information management systems that facilitate the storage and management of large volumes of genotype data generated through genome-wide association studies. Similarly, large amounts of phenotypic data are collected for study subjects, and systems such as PhD (Li et al., 2005) and the Mouse Phenome Database (Grubb et al., 2009) have been developed for managing phenotypic data. A critical component of genome-wide association studies is the use of statistical analyses to correlate genotypes with phenotypes under study. Systems specifically designed to perform statistical analysis for data sets as large as those generated through genome-wide association studies include PLINK (Purcell et al., 2007), EIGENSTRAT (Price et al., 2006) and LINKGEN (Secolin et al., 2008). Candidate SNPs identified through the statistical results must then be further explored and researched. Tools such as SNPper (Riva and Kohane, 2002) and SNP Function Portal (Wang et al., 2006) facilitate follow-up research of candidate SNPs and related genes by integrating SNP annotations from multiple public resources.
A need that is not yet met by the existing tools, however, is for utilities that integrate genotype and phenotype data, association results from multiple statistical analyses, as well as public genomic annotations. The integration of these data within a single tool enables efficient exploratory analyses that are difficult to perform manually. Futhermore, follow-up research on candidate SNPs, including investigating phenotypic variation between the different genotypes and searching public genomic resources for relevant annotations, can be time consuming, tedious and prone to error.
We have developed GWAS Analyzer in response to the data management and analysis challenges of genome-wide association studies. The GWAS Analyzer database stores family structure information about the individuals studied, their genotypes, their phenotypes and results from statistical analyses associating SNPs with the phenotypes under study. The database is also loaded with data from multiple public genomic resources, including genes, microRNAs, splice sites, expression data and gene ontology (GO) terms. Because these data are integrated within a relational database, filtering association results based on statistical values across multiple analyses as well as various SNP characteristics is easy and efficient, greatly facilitating the identification of candidate SNPs. GWAS Analyzer was developed to support a recent genome-wide association study of in vitro susceptibility to bacterial infection (Ko et al., 2009). The system provided tools for management and exploration of large amounts of interrelated data, but more importantly, for efficient selection of SNPs for further investigation.
2 METHODS
2.1 System architecture
GWAS Analyzer is a web-based application with a relational database back end (Fig. 1). The database runs on a PostgreSQL server (http://www.postgresql.org), and the web interface was developed using Perl CGI scripts run on an Apache web server (http://www.apache.org).
Fig. 1.

GWAS Analyzer consists of a web interface and relational database backend. The database is populated with data from multiple public genomic resources and experimental and analysis results from specific studies. Researchers access the database through the web interface with features to browse phenotypic values, filter and integrate PLINK results, and navigate to external web resources.
The hardware requirements for running GWAS Analyzer depend largely on the size of the data sets produced by a particular study. The database generated for the study described in this article runs on a Linux server with dual quad core 2.66 GHz Intel Xeon E5430 processors, 32 GB RAM and a 2TB SATA disk array.
2.2 Database
The database links and integrates data from multiple sources, including data generated through experiments or statistical analysis, and data from public genomic resources (Fig. 2).
Fig. 2.

This schematic illustrates how data stored in the GWAS Analyzer database are linked together. The connections between the various object types enable interesting queries and facilitate organization of large amounts of interrelated data.
2.2.1 Experimental data
The GWAS Analyzer database was populated with phenotype data and association results for the genome-wide association study of Salmonella infection in HapMap lymphoblastoid cell lines (LCLs; EBV-transformed B cells). Measurements of Salmonella-induced cell death in LCLs were obtained through a novel flow cytometry-based screen termed Hi-HOST (high throughput human in vitro susceptibility testing) (Ko et al., 2009). Three replicate values of the cell death phenotype were collected for 173 HapMap cell lines in both uninfected and Salmonella infected samples. The remainder of the 180 LCLs were not assayed as they were not available at the time of order from Coriell Institute. Values for a related phenotype, expression levels of caspase-1 (known to be required for Salmonella-induced cell death) in HapMap LCLs as measured through the GENEVAR project (Stranger et al., 2007), were also added to the database.
In addition to these phenotypic data, over 37-million p-values calculated through multiple PLINK (Purcell et al., 2007) analyses for identifying significant associations between common SNPs and these phenotypes were added to the database. Details on the screen and PLINK analysis are described in Ko et al. (2009).
2.2.2 HapMap family, SNP and genotype data
We obtained SNP, family and genotype data about HapMap individuals through the HapMap website (http://www.hapmap.org). Over 4 million common SNPs catalogued in the CEPH (Utah residents with ancestry from Northern and Western Europe) (CEU) and Yoruba in Ibadan, Nigeria (YRI) populations were inserted into the GWAS Analyzer database including details such as location, alleles and mutation type (e.g. non-synonymous, synonymous, intronic, 3′ UTR, or 5′ UTR). In addition, SNPs in linkage disequalibrium (LD) with an R2 >0.8 for each population were recorded in the database. Family structure, represented as mother–father–offspring trios, was loaded into the database for the 180 HapMap individuals in these two populations. In total, over 680-million genotypes for these individuals were added into the GWAS Analyzer database.
2.2.3 External annotations
To enable a variety of queries that associate SNPs with genes, microRNAs, splice sites and expression results, data from several other public genomic resources were also loaded into the GWAS database. A list of 56 724 known human genes was obtained from the UCSC Bioinformatics Resource website (http://genome.ucsc.edu). Details about 542 microRNAs were obtained through the Sanger miRBase website (http://microrna.sanger.ac.uk/sequences). The GENEVAR project (Stranger et al., 2007) (http://www.sanger.ac.uk/humgen/genevar) at the Wellcome Trust Sanger Institute provides analysis of gene expression variation in the HapMap samples using genome-wide expression arrays. GENEVAR expression data were downloaded and used to determine 36 493 SNPs associated with expression of the gene they are in or nearby. Splice sites identified through Ensembl (http://www.ensembl.org) were used to determine 12 980 SNPs located within splice sites. GO terms were obtained from the GO website (http://geneontology.org) and associated genes were obtained through the UCSC website for insertion into the database.
2.3 Web interface
We developed a web interface allowing researchers to easily browse, integrate and analyze the data in the GWAS Analyzer database. We used the Perl CGI module to process CGI script parameters and generate HTML headers, and the Perl DBI module to perform queries into the database. We created a web form with input controls for users to specify threshold values and filter options to serve as a simple query interface for filtering PLINK results based on p-value and specific SNP characteristics. Statistical functions supported by the PostgreSQL relational database facilitated calculations of values such as genotypic means.
3 RESULTS
The GWAS Analyzer system was utilized for multiple aspects of the research process in the Hi-HOST genome-wide association study of human susceptibility to bacterial infection (Ko et al., 2009). The tool was valuable for basic storage and management of data, exploration of variation and heritability of the cell death phenotype, filtering of PLINK analysis results for identification of SNPs potentially linked to cell death, and follow-up research on these candidate SNPs.
3.1 Data management
GWAS Analyzer was used to track, browse and link together the large amount of research data generated through the Hi-HOST screen. The GWAS Analyzer home page provides multiple entrypoints for browsing data. Users may view a list of study individuals or a list of phenotypes measured for these individuals. For the bacterial infection susceptibility study, these lists included family structure information for HapMap individuals and the percent cell death phenotype in uninfected and Salmonella infected cell lines. These lists both link to phenotypic values for each individual and averages across the CEU and YRI populations. The pages listing phenotypic values also contain links to the PLINK results from association analyses performed for each phenotype. The PLINK results pages order SNPs by p-value and displays additional SNP annotations, such as mutation type and whether it falls within a gene, splice site or microRNA. PLINK results can additionally be browsed by selecting from a list of PLINK analysis runs linked from the home page, or by querying results based on specified p-values and SNP characteristics using the PLINK Filter tool. Each SNP in the PLINK results further links to pages displaying the genotypes for study individuals integrated with phenotypic values. A search tool available on the GWAS Analyzer home page also enables researchers to jump directly to this information for a specified SNP of interest.
GWAS Analyzer already stores millions of rows of data to support management and integration of data for the bacterial susceptibility study. The tool, however, can accommodate additional data to be added as additional phenotypes are measured, new HapMap populations are phenotyped, or additional PLINK analyses are run. For example, GWAS Analyzer is being used to study other phenotypes of Salmonella and Yersinia infection that have been measured in the Hi-HOST screen but have not yet been published. The corresponding phenotypic data and PLINK analysis results can be added as they are generated, enabling immediate incorporation of these latest data into analyses.
3.2 Analysis of phenotype data
GWAS Analyzer performs on-the-fly calculations of phenotypic averages across experimental replicates, by individual and population. This feature was used to determine summary statistics for variation in percent cell death among the HapMap samples (Supplementary Fig. 1A). A feature for exporting the phenotypic average values to a downloadable spreadsheet format facilitated creation of a scatter plot demonstrating variation of the phenotype. The tool also includes a feature for calculating mid-parent phenotypic averages to compare with offspring phenotypic averages (Supplementary Fig. 1B). The export to spreadsheet utility for this feature enabled us to efficiently perform a regression analysis estimating a heritability of 14.9% for the Salmonella-induced cell death phenotype.
3.3 Integration and filtering of multiple association analyses
GWAS Analyzer facilitates efficient integration and filtering of multiple PLINK analyses. The PLINK Filter tool filters p-values from multiple analyses, enabling tests of replication across different studies or integration of results from separate analyses run for a single study. For example, four sets of PLINK analyses were run for association testing of the Salmonella-induced cell death phenotype. The different family-based association analyses have trade-offs in terms of power versus specificity, and we wanted a way to combine results from all four analyses to arrive at SNPs we hypothesized would be more likely to be true positives. The PLINK Filter tool was used to integrate the data from all four tests, filtering by user specified p-values. The tool returned a set of 2136 SNPs that correlated with the phenotype. We wanted to further reduce this list by only selecting SNPs that have a likely functional effect on the gene they are located in or nearby. To perform the additional filtering, we selected the GWAS Analyzer PLINK Filter tool options for finding SNPs that result in non-synonymous modifications, correlate with expression levels, or are located within splice sites or microRNAs (Supplementary Fig. 2A). These additional PLINK Filter options reduced the candidate SNP list to 20 (Supplementary Fig. 2B).
The PLINK Filter tool supports additional options such as selecting SNPs based on genes they fall within, location in a specific region on a particular chromosome, or a user defined list of SNP marker names. Filtering based on specific genes may be useful for identifying candidate SNPs within genes already known to be related to the phenotype under study, or to identify SNPs potentially affecting a gene that other candidate SNPs fall within. Similarly, narrowing PLINK results based on SNPs that fall within a particular genomic region of a given chromosome can help researchers explore candidates located near a gene of interest, including regions that may affect expression of the gene, such as a promoter.
Even greater flexibility is provided by an option that allows filtering based on custom lists of SNPs. For example, we were interested in whether any SNPs statistically associated with the cell death phenotype had been previously shown to be linked to other diseases. We compiled a list of non-synonymous SNPs that were demonstrated by the Wellcome Trust Case–Control Consortium (2007) to be associated with the incidence of one of seven common diseases, including Crohn's disease and rheumatoid arthritis. This list of SNPs was specified in the PLINK Filter tool, and the results indicated that there were no SNPs strongly associated with the cell death phenotype that had also been shown by the Wellcome Trust Case–Control Consortium to be correlated with one of these seven diseases.
3.4 Follow-up of candidate SNPs
GWAS Analyzer also contains several features for following up on candidate SNPs. In addition to displaying a summary of details for each SNP, including marker name, chromosomal location, alleles and genes they fall within, GWAS Analyzer also includes genotypic means for a selected phenotype, associated GO terms and direct links to gene and SNP entries in the UCSC Genome Browser and NCBI's dbSNP. Links to browse the region surrounding each SNP in the TCAG Database of Genomic Variants also facilitate investigation of potential structural variants that may be associated with phenotypes under study.
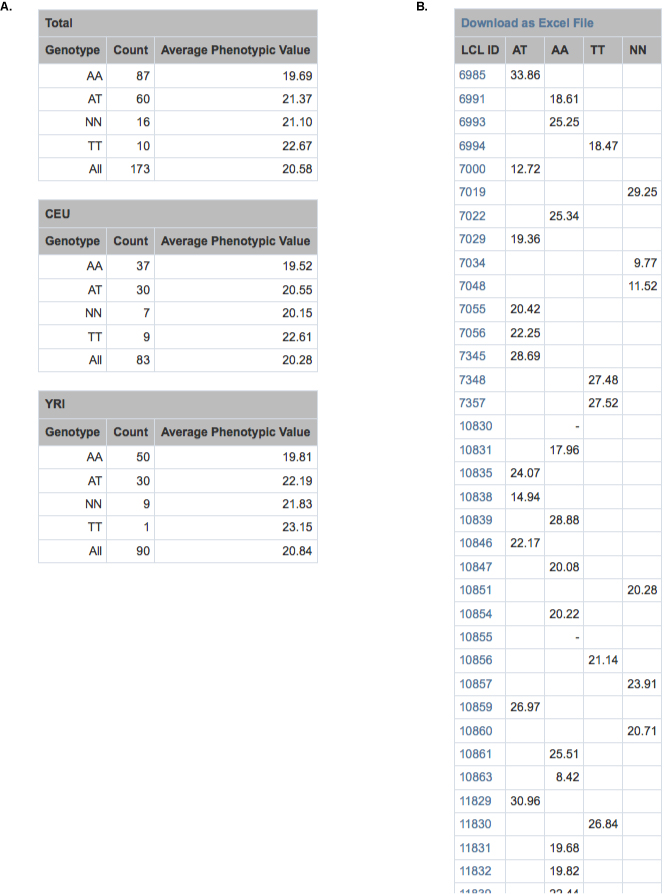
These data and links were utilized to quickly research each candidate identified through the PLINK Filter tool. Two candidate SNPs were shown within GWAS Analyzer to be located within the CARD8 gene. Hyperlinks directly to the UCSC Genome Browser provided an overview of the gene, indicating its role in the activation of proinflammatory caspases, thus suggesting that the SNPs may have a true association with the Salmonella-induced cell death phenotype. In addition, GWAS Analyzer displays tables of genotypic means for all phenotypes in each sample population (Supplementary Fig. 3A), as well as to tables of individual phenotypic averages grouped by genotype (Supplementary Fig. 3B). This feature enabled us to quickly assess if a particular allele correlates with either increased or decreased cell death. For each candidate SNP, the tool also displays a list of SNPs in LD for each population, directly linking to relevent pages within GWAS Analyzer. All these features of GWAS Analyzer led to the selection of rs2043211, a SNP predicted to cause a non-sense mutation in some CARD8 isoforms, for experimental validation using RNAi knockdown and overexpression experiments. In addition to successful validation, further research suggested evolutionary factors driving the selection of the derived allele [described in detail in Ko et al. (2009)].
4 DISCUSSION
The GWAS Analyzer software system is a valuable tool for managing and analyzing data from genome-wide association studies. The utility of the system has been demonstrated by its use for a genome-wide association study of susceptibility to bacterial infection in HapMap cell lines. GWAS Analyzer served as a valuable tool for managing large amounts of phenotype and PLINK data, integrating and filtering results from multiple PLINK analyses, and performing follow-up research on candidate SNPs. The tool enabled us to efficiently determine variation in measured phenotypic values and calculate heritability of the Salmonella-induced cell death phenotype. The PLINK Filter feature was critical for identifying a SNP that was experimentally validated to be associated with Salmonella-induced cell death. The critical role that GWAS Analyzer played in multiple aspects of this study demonstrates the value of developing new informatics tools for emerging genomic research. While the utility of database driven informatics tools has long been recognized in genomic research for uses such as microarray management or gene repositories, tools for integrating genotype, phenotype and public annotation data for genome-wide association studies are lacking.
4.1 Adaptability
We expect researchers to have needs unique to specific studies. The GWAS Analyzer system is open source such that researchers can modify the tool to best fit their needs. For example, some researchers may want to include demographics about study subjects, such as race, or explore family structure information other than the mother–father–offspring trios, such as for twin studies. Studies that do not utilize HapMap samples, or other samples that have already been genotyped, may want to modify the system to store additional genotyping data, such as quality scores. Researchers performing their own genotyping may already benefit from utilities within GWAS Analyzer that generate PLINK formatted genotype files for use as input for PLINK association analyses. While we were able to download PLINK formatted genotype files for HapMap samples through public resources for our study, other researchers may not have this luxury. We have therefore developed scripts included with the GWAS Analyzer source package that generate PLINK formatted files using SNP and genotype data stored in the database to help support researchers performing their own genotyping. PLINK results generated using these files as input can then be inserted into the database such that other features of the system can be utilized.
Researchers may also want to manage and integrate qualitative phenotypes or more complex phenotypic data, such as expression data from microarray experiments. Specific studies may additionally benefit from integration of public resources other than those currently supported, and the existing open source scripts can be modified as necessary.
4.2 Scalability
Genome-wide association studies in general generate large volumes of data. Different studies, however, can still generate widely varying amounts of data, depending on number of study subjects, number of SNPs genotyped, the nature of phenotypes measured and number of association analyses performed. Our installation of GWAS Analyzer, implemented for the bacterial infection study with a relatively small number of subjects, utilized a server as described in the Section 2. The scalability of the system to larger datasets depends mostly on the specifications and configuration of the database server running the GWAS Analyzer database. By using more processor power, greater RAM and disk space, and database load balancing solutions, we believe GWAS Analyzer instances could accommodate studies that generate data 10 or even 100 times the size generated through our study.
4.3 Future work
Although GWAS Analyzer has thus far only been utilized to organize and analyze the data generated from one particular study, we are currently adapting the tool for use in similar studies. We believe GWAS Analyzer could be utilized or adapted for a variety of other types of association studies, and expect interest in this type of tool to rise with the current direction of genomic research. The literature indicates a recent growth in the number of genome-wide association studies being performed. The nature of these types of studies typically results in large amounts of phenotype, genotype and statistical analysis data. These data must be managed, integrated and analyzed in ways similar to that of the Hi-HOST screen.
As we continue to adapt the tool for additional GWAS we are involved with, we will work to identify features to add to the code base that may be useful for GWAS in general. Current work includes adding features for linking to additional public annotations that will further assist researchers with investigating candidate SNPs, such as identifying SNPs associated with alternative splicing and including fixation index (FST) values for measures of population differentiation. In the future, we may also add features to support PLINK analyses which include structural variants by integrating data from the TCAG database directly into the GWAS Analyzer database.
4.4 Availability
Data published from the Hi-HOST screen is available through GWAS Analyzer on the tool's webpage at http://www.nwrce.org/gwas-analyzer. Researchers are encouraged to use the tool to further mine the data for other interesting associations, and to utilize results as a motivation for additional studies. Researchers interested in utilizing GWAS Analyzer software for similar studies, or adapting the system for other types of studies, can also sample the tool's features and obtain source code through the website.
Funding: National Institutes of Health, National Institute of Allergy and Infectious Dieseases award for the Northwest Regional Center for Excellence for Biodefense and Emerging Infectious Diseases Research [U54AIO57141]. D.C.K is a Wyeth Fellow of the Life Sciences Research Foundation.
Conflict of interest: none declared.
Supplementary Material
REFERENCES
- Frazer KA, et al. A second generation human haplotype map of over 3.1 million SNPs. Nature. 2007;449:851–861. doi: 10.1038/nature06258. [DOI] [PMC free article] [PubMed] [Google Scholar]
- Grubb SC, et al. Mouse phenome database. Nucleic Acids Res. 2009;37:D720–D730. doi: 10.1093/nar/gkn778. [DOI] [PMC free article] [PubMed] [Google Scholar]
- Hampe J, et al. A genome-wide association scan of nonsynonymous SNPs identifies a susceptibility variant for Crohn disease in ATG16L1. Nat. Genet. 2007;39:207–211. doi: 10.1038/ng1954. [DOI] [PubMed] [Google Scholar]
- Ko DC, et al. A genome-wide in vitro bacterial-infection screen reveals human variation in the host response associated with inflammatory disease. Am. J. Hum. Genet. 2009;85:214–227. doi: 10.1016/j.ajhg.2009.07.012. [DOI] [PMC free article] [PubMed] [Google Scholar]
- Li JL, et al. Toward high-throughput genotyping: dynamic and automatic software for manipulating large-scale genotype data using fluorescently labeled dinucleotide markers. Genome Res. 2001;11:1304–1314. doi: 10.1101/gr.159701. [DOI] [PMC free article] [PubMed] [Google Scholar]
- Li JL, et al. PhD: a web database application for phenotype data management. Bioinformatics. 2005;21:3443–3444. doi: 10.1093/bioinformatics/bti557. [DOI] [PubMed] [Google Scholar]
- Monnier S, et al. T.I.M.S: TaqMan Information Management System, tools to organize data flow in a genotyping laboratory. BMC Bioinformatics. 2005;6:246. doi: 10.1186/1471-2105-6-246. [DOI] [PMC free article] [PubMed] [Google Scholar]
- Orro A, et al. SNPLims: a data management system for genome wide association studies. BMC Bioinformatics. 2008;9(Suppl. 2):S13. doi: 10.1186/1471-2105-9-S2-S13. [DOI] [PMC free article] [PubMed] [Google Scholar]
- Price A, et al. Principal components analysis corrects for stratification in genome-wide association studies. Nat. Genet. 2006;38:904–909. doi: 10.1038/ng1847. [DOI] [PubMed] [Google Scholar]
- Purcell S, et al. PLINK: a tool set for whole-genome association and population-based linkage analyses. Am. J. Hum. Genet. 2007;81:559–575. doi: 10.1086/519795. [DOI] [PMC free article] [PubMed] [Google Scholar]
- Rioux JD, et al. Genome-wide association study identifies new susceptibility loci for Crohn disease and implicates autophagy in disease pathogenesis. Nat. Genet. 2007;39:596–604. doi: 10.1038/ng2032. [DOI] [PMC free article] [PubMed] [Google Scholar]
- Riva A, Kohane IS. SNPper: retrieval and analysis of human SNPs. Bioinformatics. 2002;18:1681–1685. doi: 10.1093/bioinformatics/18.12.1681. [DOI] [PubMed] [Google Scholar]
- Saxena R, et al. Genome-wide association analysis identifies loci for type 2 diabetes and triglyceride levels. Science. 2007;316:1331–1336. doi: 10.1126/science.1142358. [DOI] [PubMed] [Google Scholar]
- Secolin R, et al. LINKGEN: a new algorithm to process data in genetic linkage studies. Genomics. 2008;91:544–547. doi: 10.1016/j.ygeno.2008.02.001. [DOI] [PubMed] [Google Scholar]
- Sladek R, et al. A genome-wide association study identifies novel risk loci for type 2 diabetes. Nature. 2007;445:881–885. doi: 10.1038/nature05616. [DOI] [PubMed] [Google Scholar]
- Stranger BE, et al. Population genomics of human gene expression. Nat. Genet. 2007;39:1217–1224. doi: 10.1038/ng2142. [DOI] [PMC free article] [PubMed] [Google Scholar]
- Wang P, et al. SNP Function Portal: a web database for exploring the function implication of SNP alleles. Bioinformatics. 2006;22:e523–e529. doi: 10.1093/bioinformatics/btl241. [DOI] [PubMed] [Google Scholar]
- Wellcome Trust Case Control Consortium. Genome-wide association study of 14,000 cases of seven common diseases and 3,000 shared controls. Nature. 2007;447:661–678. doi: 10.1038/nature05911. [DOI] [PMC free article] [PubMed] [Google Scholar]
- Yeung JM, et al. OpenADAM: an open source genome-wide association data management system for Affymetrix SNP arrays. BMC Genomics. 2008;9:636. doi: 10.1186/1471-2164-9-636. [DOI] [PMC free article] [PubMed] [Google Scholar]
- Zhao LJ, et al. SNPP: automating large-scale SNP genotype data management. Bioinformatics. 2005;21:266–268. doi: 10.1093/bioinformatics/bth486. [DOI] [PubMed] [Google Scholar]
Associated Data
This section collects any data citations, data availability statements, or supplementary materials included in this article.