

Abstract
The proteasome, a multicatalytic protease, displays distinct chymotrypsin-like, caspase-like, and trypsin-like activities at three different subunits of the multimeric complex. Fluorescent substrates for each of these active sites have been described. However, since the fluorescent properties of these substrates are very similar, it is not possible to simultaneously monitor catalysis of two or more activities. We have developed a long wavelength (λex = 600 nm, λem = 700 nm) fluorescent substrate for the chymotrypsin-like active site via a combinatorial library strategy. This peptide-based substrate is a highly selective proteasomal chymotrypsin-like sensor, as assessed by a series of proteasomal active site mutants in yeast cell lysates. A corresponding caged analog of the sensor has been prepared, which is resistant to proteolysis until activated by 349 nm light. The latter affords the opportunity to assess proteasomal activity with a high degree of temporal control. The distinct photophysical properties of the sensor allow the chymotrypsin-like activity to be simultaneously monitored during caspase-like or trypsin-like catalysis. We have found that chymotrypsin-like activity is enhanced in the presence of the trypsin-like substrate, but reduced in the presence of caspase-like substrate. Furthermore, the chymotrypsin-like sensor hinders the activity of both the caspase- and trypsin-like active sites. Coincident monitoring of two catalytic active sites furnishes two-thirds coverage of total proteasomal activity, which should provide the means to address if and how the distinct active sites of the proteasome influence one another during catalysis.
Aberrant pathways responsible for cancerous cell growth are remarkably plastic, endowing transformed cells with an extraordinary resilience against inhibitory (anticancer) agents. As a consequence, there is emerging evidence that the future of cancer chemotherapy lies in targeting multiple members of abnormal biochemical networks.1 In an analogous vein, the ability to simultaneously measure the catalytic activity at several sites in a network offers the means to detect aberrant biochemical behavior, screen for new inhibitory agents on a more global biochemical scale, and potentially predict the efficacy of various chemotherapeutic cocktails for individual patients. Conspiring biochemical activity may reside at distinct intracellular sites, within the same organelle, or as part of a single protein complex. An especially beautiful, yet challenging, example of the latter is the proteasome, which serves as the primary protein digestive apparatus in the cytoplasm and nuclei of eukaryotic cells.2 Inhibitors of the proteasome (bortezomib, salinosporamide A, carfilzomib) have received considerable attention as anticancer agents.3 The highly oligomeric proteasomal complex houses three catalytically distinct protease active sites: chymotrypsin-like (Ch-L), caspase-like (Ca-L), and trypsin-like (T-L).2 Previous studies suggest that some of these active sites can allosterically regulate one another,4 although others have questioned this interpretation.5 Fluorophore-labeled substrates have been designed for each of the individual active sites and, upon hydrolysis, a fluorescent response is observed. However, the fluorophores employed in these substrates possess similar photophysical properties and consequently it is not possible to simultaneously monitor the activity of multiple catalytic activities.6 We describe herein the acquisition and characterization of a long wavelength Ch-L sensor, the synthesis of the corresponding caged analog, and the simultaneous observation of activities from proteolytically distinct proteasomal active sites.
Results and Discussion
Some observations regarding substrate specificity of the Ch-L subunit have been reported, such as the preference for hydrophobic residues (Leu>Tyr>Phe>Trp>Ile) on the N-terminal side of the scissile bond (P1).7 However, it is also clear that the P1 amino acid is not the only factor determining the location of the cleavage site.8 Based on the screening of a two-position library, Harris et al. identified Pro-Glu-Gly-Phe and His-His-Ser-Leu as two peptide sequences in which Ch-L site substrate specificity is optimized, where bold-face represents the site of proteolysis.8b In order to identify a proteasome sensor for Ch-L activity, we prepared a small library of peptides based on two considerations: (1) previously demonstrated Ch-L substrates8b and (2) the ability of Trp to quench the fluorescence of oxazine fluorophores9. We sequentially replaced each residue in the two standard peptide sequences, His-His-Ser-Leu-P1′ and Pro-Glu-Gly-Phe-P1′, with tryptophan. Furthermore, the side chain length at the P1′ site, which contains the oxazine fluorophore 110, was varied [i.e. (l)-2,3-diaminopropionic acid (Dap), (l)-2,4-diaminobutanoic acid (Dab), Orn, and Lys]. A structural outline of the Ch-L sensor library is depicted in 2, where n = 1, 2, 3, and 4 on the P1′ side chain.

The proteasome-induced fluorescence changes for the four purified leads acquired from library 2 are provided in Table 1 and for the entire crude library in Table S-2 (Supporting Information). Isolated yeast 20S proteasome was employed for screening and kinetic characterization. Trp, positioned at P3 and P4, facilitates efficient quenching and generated, upon proteasome-mediated proteolysis, fluorescent increases of greater than 20-fold. The Km values of 3 - 6 are comparable. Peptide 4 furnishes the largest fluorescence increase but displays a significantly reduced Vmax relative to peptide 5. The longer Lys side chain of 5 (relative to the Dap and Dab side chains) may place the bulky fluorophore away from the active site pocket, thereby providing the better “fit” between the substrate and the catalytic residues of the enzyme.
Table 1.
Four lead peptides from the Ch-L sensor library. Flc increase = fold increase in fluorescence intensity upon incubation with proteasome. The excitation and emission spectra of sensor 5 is furnished in Fig. S-2.
| Peptide | Flc Increase | Km (μM) | Vmax (nmol/min·mg) | kcat/Km (M-1 s-1) |
|---|---|---|---|---|
| 3 Ac-HWSL-Dap(Fl) | 22.4-fold | 56 ± 11 | 1.4 ± 0.2 | 300 ± 70 |
| 4 Ac-HWSL-Dab(Fl) | 27.1-fold | 80 ± 13 | 1.0 ± 0.1 | 150 ± 30 |
| 5 Ac-HWSL-Lys(Fl) | 24.9-fold | 81 ± 8 | 2.7 ± 0.2 | 390 ± 50 |
| 6 Ac-WHSL-Lys(Fl) | 23.5-fold | 73 ± 15 | 1.7 ± 0.3 | 280 ± 70 |
The selectivity of peptide 5 as a Ch-L proteasomal substrate was assessed using a series of yeast cell lysates. Cell lysate autofluorescence does not interfere with the observed fluorescence change owing to the characteristic long wavelength excitation (λex = 663 nm) and emission (λem = 678 nm) of the oxazine probe, as well as its extinction coefficient (119,000 M-1 cm-1) and quantum yield (0.33).10 Even sub μM concentrations of sensor 5 are sufficient to observe hydrolytic activity (Fig. S-1, Supporting Information), reducing the likelihood of interfering with endogenous biochemical activity.11 By comparison, previously described coumarin and β-naphthylamide-based substrates are employed at concentrations of 100 μM or greater.6 The three distinct proteasome active sites possess N-terminal Thr residues that are essential for catalytic activity. Cell lysates of a double mutant strain were prepared, in which the catalytic Thr was converted to an Ala in both the Ca-L and T-L subunits.12 In this strain the only functional active site of the proteasome is the Ch-L catalytic subunit and, as expected, lysates of this mutant strain and that of the wild type strain catalyze hydrolysis of peptide 5 at equal rates (Fig. 1A, cf. blue and red curves). In addition, the potent and proteasome-specific inhibitor MG132 completely abolishes hydrolytic activity (Fig. 1A, green curve), consistent with the notion that proteolysis is due to the proteasome and not a consequence of other proteases present in the lysate. Finally, we prepared lysates of the defective Ch-L subunit (Thr-to-Ala mutant). Only a barely perceptible fluorescence change was observed (Fig. 1A, brown), thereby establishing peptide 5 as a selective sensor of the proteasome that can sample Ch-L activity even in crude lysates. Liquid chromatography-mass spectrometry (LC-MS) revealed the formation of oxazine-labeled Lys (Fig. S-3), the expected product generated via proteolysis at the Leu-Lys amide linkage. We've established a linear correlation between the proteasome-induced fluorescence change and formation of the oxazine-labeled Lys (as assessed by HPLC; Fig. S-4). An analogous correlation exists between fluorescence change and sensor 5 consumption (as assessed by HPLC, Fig. S-4). Ac-HWSL, the peptide cleavage product that results from this proteasome-catalyzed hydrolysis undergoes subsequent hydrolysis to Ac-HWS (Fig. S-3).
Figure 1.
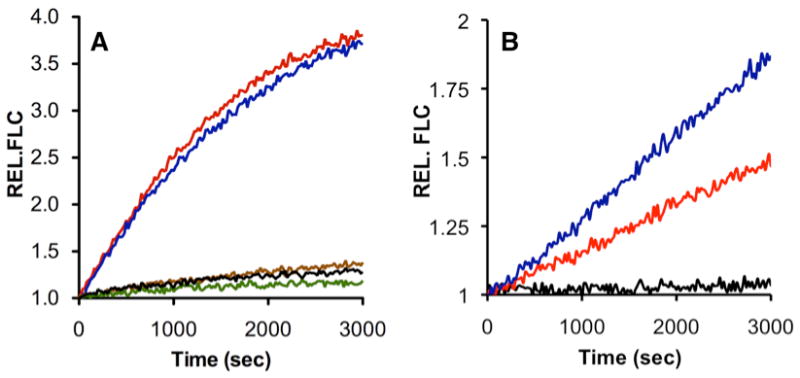
Yeast Cell Lysate Assessment of the Ch-L Selectivity of Peptide 5 and Time-Dependent Photolytic Liberation of 10 [fold increase in fluorescence intensity upon proteasome treatment (REL FLC) as a function of time]. (A) Peptide 5 (9.25 μM) with cell lysates containing wild type (red), defective T-L/Ca-L (blue), defective Ch-L (brown), defective T-L/Ca-L proteasome with the proteasome inhibitor MG132 (5 μM, green); no lysate (black). (B) Peptide 10 (5.65 μM) treated with wild type cell lysate (black), and preirradiated for 2 min (red) or 10 min (blue).
Although sensor 5 serves as a selective Ch-L substrate, its ultimate utility as a fluorescent probe of intracellular proteasomal activity in living cells would be greatly facilitated by the ability to control when proteasomal activity is observed (e.g. as a function of cell cycle, following exposure to environmental stress, etc.). We've established that light-activatable (“caged”)13 sensors of protein kinases can be used to probe catalytic activity in living cells in an investigator-controlled fashion.14 However, previously described caged peptides contain side chain functionality required for catalytic activity (e.g. a Ser hydroxyl moiety that serves as a phosphoryl acceptor in protein kinase-catalyzed reactions). By contrast, sensor 5 lacks a side chain moiety that, upon modification, would render the peptide impervious to hydrolysis. Recently, we demonstrated that caged peptides are easily prepared during solid phase peptide synthesis via incorporation of a photocleavable moiety at a key peptide backbone amide bond.15 Consequently, we reasoned that incorporation of an o-nitrobenzyl moiety at the demonstrated scissile bond in 5 would render the sensor resistant to proteasome-mediated hydrolysis, until activated by photolysis. The caged sensor 10 was prepared on-resin using a reductive alkylation step to generate an N-o-nitrobenzyl intermediate, followed by acylation of the secondary amine with the acid chloride of Fmoc-Leu (Scheme 1). All other steps employ standard Fmoc chemistry. The activity assay with purified yeast 20S proteasome revealed that 10 is impervious to hydrolysis until activated by light (Fig. 1B, black curve). Moreover, the amount of active substrate released can be controlled by the time of irradiation [2 min (red) versus 10 min (blue)]. HPLC and mass spectrometry confirmed that irradiation of the sample generates sensor 5 and that, in the presence of proteasome, compound 5 is converted to the hydrolyzed product Lys(oxazine) (Fig. S-5). The quantum yield (0.08) for the conversion of 10 to 5 was determined using a caged fluorescein derivative as a reference (Fig. S-6).
Scheme 1.

Solid phase peptide synthesis (SPPS) of the caged Ch-L sensor 10.
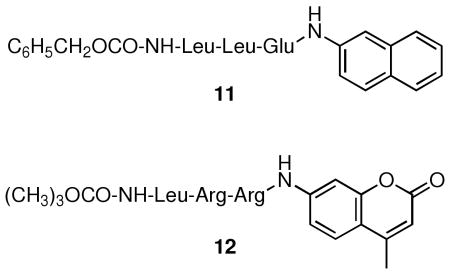
Finally, we employed sensor 5 to simultaneously monitor Ch-L activity in the presence of previously described fluorescent substrates for the Ca-L (Z-LLE-βna, 11) and T-L (Boc-LRR-amc, 12) active sites. The presence of either of these substrates does not affect the fluorescence of the oxazine fluorophore (Fig. S-7). Ch-L activity increases in the presence of the T-L substrate but decreases upon exposure to the Ca-L substrate (Fig. 2A). Conversely, the Ch-L substrate reduces the rate at which both the Ca-L and T-L active sites process their respective substrates (Fig. 2B). Previous studies have described the effect of noncognate inhibitors and substrates on catalytic activity. In particular, the catalytic activity at the Ch-L site is repressed in the presence of a Ca-L substrate and vice versa.4 This observation has lead, in part, to a model depicting allosteric crosstalk between the Ca-L and Ch-L active sites.4 However, this interpretation has been called into question.5 Sensor 5, which is both catalytically and spectrally orthogonal to existing sensors, allows two proteasomal activities (Ch-L and Ca-L; Ch-L and T-L) to be simultaneously observed. Consequently, we've been able to not only confirm the previous report of a reciprocal negative effect of Ca-L and Ch-L substrates,4 but we've also observed the heretofore unreported potentiation of Ch-L activity by a T-L substrate. The coincident monitoring of two catalytic active sites furnishes two-thirds coverage of total proteasomal activity. The latter, in conjunction with appropriate inhibitors and various active site mutants, offers the means to address if and how the distinct active sites of the proteasome influence one another during catalysis. These studies will be reported in due course.
Figure 2.

Simultaneous Monitoring of Proteasomal Subunit Catalysis [fold increase in fluorescence intensity upon proteasome treatment (REL. FLC) as a function of time]. (a) Ch-L activity as assessed with peptide 5 (30 μM, λex = 600 nm, λem = 700 nm) in the presence of a T-L substrate (100 μM Boc-LRR-amc, blue), alone (black), or in the presence of a Ca-L substrate (100 μM Z-LLE-βna, red). (b) Ca-L activity as assessed with Z-LLE-βna (100 μM, λex = 342 nm, λem = 425 nm) in the absence (red) or presence (orange) of the Ch-L substrate (30 μM peptide 5) and T-L activity as assessed with Boc-LRR-amc (100 μM, λex = 380 nm, λem = 460 nm) in the absence (blue) or presence (green) of the Ch-L substrate (30 μM peptide 5).
In summary, we've prepared a highly selective long wavelength sensor of proteasomal Ch-L activity. The sensor has been used, in combination with previously described fluorescent substrates, to concurrently measure the catalytic activity of two distinct proteasome active site regions. In addition, the caged analog of the sensor provides the means to intracellularly load the reagent in the absence of confounding background hydrolysis as well as subsequently establish a well-resolved “in-cell” enzymatic start point.
Materials and Methods
Materials
Materials and chemicals were obtained from Fisher and Aldrich, except for 1H-benzotriazolium 1-[bis(dimethylamino)methylene]-5-chlorohexafluorophosphate (1-), 3-oxide (HCTU), N-{(dimethylamino)-1H-1,2,3-triazolo[4,5-b]pyridino-1-ylmethylene}-N-methylmethanaminium hexafluorophosphate N-oxide (HATU), 2-(7-Aza-1H-benzotriazole-1-yl)-1,1,3,3-tetramethyluronium hexafluorophosphate) 1-hydroxy-6-chlorobenzotriazole (6-Cl-HOBt), protected amino acids, and CLEAR Rink amide resin (100-200 mesh, 0.43 mmol/g), NovaSyn TGR resin (0.20 mmol/g) were obtained from Advanced ChemTech, Novabiochem or Peptides International. 20S particles (wild type and □3□7□N mutant) from yeast Saccharomyces cerevisiae (strains sDL135 and yMS160, respectively) were purified as described previously.16 See Table S-1 for a list of yeast strains employed in this study. Fluorogenic proteasomal substrates (except those synthesized in this study) were purchased from Bachem. Fluorescence assays were performed using a SpectraMAX MS fluorescent plate reader (Molecular Device), and irradiation experiments utilized a diode-pumped, Q-switched UV laser which produces 5 ns pulses at 349 nm with a peak repetition rate of 1 kHz and 100 mJ pulse energy (Explorer, Spectra-Physics, Mountain View, CA). Mass spectra by ESI and MALDI were acquired at the Mass Spectrometry Laboratory of the Albert Einstein College of Medicine and/or at Sigma Aldrich Co. HPLC analysis was performed using a Waters 600 solvent delivery system and Waters Delta 600 controller with a 996 Photodiode Array Detector. Analyses were carried out either on analytical (Altech Apollo C18, 5 μ, 4.6 × 250 mm) or semi-preparative (GraceVydac, Everest C18 HPLC Column, 300 Å, 10 μm, 250 × 10 mm) scales.
Peptide Synthesis
All peptides were manually synthesized using a standard Fmoc solid-phase peptide synthesis protocol using CLEAR Rink amide resin. The side chains of Glu and Ser were protected with O-tert-Bu. The side chain of Lys, (L)-2,3-diaminopropionic acid (Dap), (L)-2,3-diaminobutyric acid (Dab), and ornithine (Orn) were protected with 1-(4,4-Dimethyl-2,6-dioxo-cyclohexylidene)-3-methyl-butyl (ivDde) group. The side chain of His and Trp were protected with butyloxycarbonyl (Boc) group. Each amino acid was attached via a standard addition/deprotection stepwise protocol followed by covalent labeling with the fluorophore and final cleavage [steps (a) and (b), vide infra]. For caged peptides, the reductive alkylation procedure (c) and coupling of the subsequent Fmoc-residue (d) were performed under the specified conditions before the dye modification (b) was carried out.
The amino acid coupling conditions were as follows: amino acid (3 eq), HCTU (2.9 eq), 6-Cl-HOBt (2.9 eq), and N,N-diisopropylethylamine (DIPEA) (5.8 eq) in DMF for 0.5 - 2 h at room temperature. Between each coupling the resins were washed sequentially with DMF (3×), isopropanol (3×) and CH2Cl2 (3×). Deprotection of the Fmoc group on the growing peptide chain was effected with 30% piperidine in DMF (20 min) followed by sequential washes with DMF (3×), isopropanol (3×), and CH2Cl2 (3×).
Following peptide synthesis, each individual peptide-resin (61.25 μmol, 1 eq) was treated with 1% hydrazine in DMF to selectively deprotect the side chain amine of Dap, Dab, Orn or Lys (3 × 3 min, 2 × 5 min), followed by washing with DMF (8 × 2 min), isopropanol (3×), and CH2Cl2 (3×). The peptidyl resins were shaken for 5 min with DMF containing 5% DIPEA. The free amine in each peptide was covalently labeled with the fluorophore [∼55 mg, 1.4 eq.; HATU (35 mg, 1.5 eq), DIPEA (32 μL, 3 eq) in DMF (∼1.5 mL) on the shaker, overnight]. The peptides were then cleaved and deprotected via exposure to TFA: H2O: triisopropylsilane (TIS) in a ratio of 95:2.5:2.5 and purified by HPLC. The peptides were isolated via filtration of the resin, precipitation with ice-cold diethyl ether, and centrifugation. The precipitates were air dried and purified by reverse-phase HPLC using a linear gradient (3% - 40% acetonitrile in water with 0.1% TFA over 40 min). The peak corresponding to the desired peptide was collected, frozen, and lyophilized. The resulting white, flocculent peptides were characterized by MS-ESI.
Reductive alkylation of Lys(ivDde)-resin with 4,5-dimethoxy-6-nitrobenzaldehyde (DMNB). The free primary amine of the side chain protected Lys(ivDde)-resin (12.25 μmol) was washed with a few mL DMF:MeOH:AcOH (9:9:2) then mixed with DMNB (6.25 mg, ∼2.4 eq) in 600 μL DMF:MeOH (1:1) for 50 min. The solvent was then removed and the imine-forming reaction repeated (2.4 ∼ 3 eq up to 2 h). Following solvent removal, the resin was washed with 3 mL dry DMF (5×), and then 5 equiv of NaBH3CN (3.84 mg) in 500 μL DMF:MeOH:AcOH (9:9:2) was added to the resin and mixed at room temperature for 20 min. The solvent was removed and resin successively washed with DMF, DMF/H2O, H2O, MeOH/CH2Cl2, CH2Cl2, and DMF. The reaction progress was monitored by HPLC and ESI-MS analyses of cleaved product from a few mg of resin (95% aqueous TFA). The reaction and the subsequent peptide synthesis were performed in reaction vessels wrapped in aluminum foil.
Amino acid coupling to the resin N-DMNB peptide was performed as previously described.15, 17 Briefly, the Fmoc-Leu-OH was dried over phosphorus pentoxide in a desiccator overnight. A 250 mL round bottom flask was charged with Fmoc-Leu-OH (2.26 g, 6.4 mmol, 1 eq.) and purged with Ar. 5 mL of SOCl2 (ca. 64 mmol, 10 eq.) was added via a cannula along with 46 μL of anhydrous DMF (0.64 mmol, 0.1 eq.). The clear mixture was stirred for 1 h at RT. Excess SOCl2 was evaporated. The acid chloride of Fmoc-Leu was precipitated with 7 mL cold CH2Cl2 followed by 70 mL hexane, and dried under vacuum. After washing thoroughly with THF, 20 eq of freshly prepared Fmoc-Leu-Cl in 125 μL THF (5 mL/g resin; previously swelled in THF) was added and shaken for 30 min. 40 eq of DIPEA was subsequently added and the mixture allowed to react for an additional 2 h. The reaction was confirmed by HPLC and ESI-MS analyses of cleaved product from a few mg of resin (95% aqueous TFA).
(3) Ac-His-Trp-Ser-Leu-Dap(Fl)-amide (m/z calculated 1271, found 1274); (4) Ac-His-Trp-Ser-Leu-Dab(Fl)-amide (m/z calculated 1285, found 1288); (5) Ac-His-Trp-Ser-Leu-Lys(Fl)-amide (m/z calculated 1313, found 1316); (6) Ac-Trp-His-Leu-Lys(Fl)-amide (m/z calculated 1313, found 1316); (10) Ac-His-Trp-Ser-Leu-N(DMNB)-Lys(Fl)-amide (m/z calculated 1508. 7, found 1510.2)
Library Synthesis and Characterization
Synthesis of thirty-two peptidyl resins was carried out on a semi-automatic peptide synthesizer (Syro, Sigma-Aldrich Co.) using NovaSyn TGR resin at 50 μmol scale and a standard Fmoc solid-phase peptide synthesis protocol (a). The sequences of the peptides are listed in Table S-2. The peptidyl resins (2.5 μmol, ∼13 mg) were then transferred to a modified 96-well plate (with filter bottom) for covalent fluorophore labeling in the following manner. First, the peptidyl resins in the wells were washed with DMF on a shaker (4×, 30 s), drained, and treated with 2% hydrazine in DMF to selectively deprotect the side chain amine of Dap, Dab, Orn or Lys (3 × 3 min, and 2 × 5 min). The resins were then washed with DMF (4 × 30 s). For the fluorophore labeling, the mixtures of the fluorophore in the succinimidyl ester form (2.9 □mol/well, 1.1 eq.), hydroxybenzotriazole (HOBt) (1 eq.), diisopropylcarbodiimide (DIC) (1 eq), and DIPEA (1 eq) in DMF (125 μL/well) were manually added to the wells. After 2 h of shaking, 10 μL of DIC (10% in DMF) was added to each well, sealed with a foil, and left on the shaker overnight. A few resin beads were micro-cleaved (95:5 TFA:water) to monitor the reaction progress by MS-MALDI. 10 μL of DIC (10% in DMF) was added again and the reaction was left for an additional 3 h. The reaction mixture was then drained and resins were washed with DMF (8×) and acetonitrile (3×), and dried under vacuum for 15 min. The peptides were cleaved and deprotected via eight cycles of 5 min exposure to TFA:H2O:TIS in a ratio of 93:5:2 (Cycle 1: 200 μL/well, Cycles 2-7: 100 μL/well) using N2 pressure to drain and collect the peptide solution into a new 96-well plate. TFA was evaporated and the peptides were isolated via precipitation with ice-cold diethyl ether, and resuspended in TFA for mass spectrometry analysis (LC-MS and MS-MALDI). The buffer containing 25% acetonitrile, 75% water, and 0.1% TFA was added to the wells, and peptides were frozen and lyophilized.
The peptide library was dissolved in 10 μL of DMSO and 90 μL of water. 96-well plates containing the samples at various dilutions in assay buffer [Buffer A: 50 mM Tris-HCl, 5 mM MgCl2, and 0.5 mM EDTA, pH 7.5] (1/100, 1/250, and 1/1000) were prepared to monitor the changes in fluorescence (λex = 550 nm, λem = 700 nm) after addition of 2 μL purified 20S proteasome (4 mg/mL). Fluorescence change was obtained from the fluorescence measured before the addition of the enzyme and the fluorescence measured after 1.5 h of incubation (on the shaker) with the enzyme at 30 °C.
Activity assay of purified 20S proteasome with peptide 5
The enzymatic activity of the proteasome towards 5 was assessed in a 96-well plate format: 200 μL (per well) containing Buffer A [50 mM Tris-HCl (pH 7.5, 5 mM MgCl2, 0.5 mM EDTA] and peptide 5 (concentrations as indicated in Fig. S-1, Supporting Information). The reaction was initiated by the addition of 2 - 3 μL enzyme (latent CP, 7.2 μg/μL) and the fluorescence change monitored (λex = 550 nm, λem = 700 nm) at 30 °C. The relative fluorescence was obtained by simultaneously monitoring the fluorescence of the blank sample (no enzyme) at the corresponding substrate concentrations. The correlation between the rate of product formation and that of fluorescence change was made by HPLC and MS-ESI analysis of the peptide cleavage products.
Cell lysate assay
Cells were harvested in log phase, resuspended in lysis Buffer A (50 mM Tris-HCl, pH 7.4, 1 mM EDTA, 5 mM MgCl2) and drop-frozen in liquid nitrogen. Frozen yeast cells were lysed by cryolysis using MM301 grinding mill (Retsch, Germany) following the manufacturer protocol. Cell extracts were cleared at 14000 rpm for 20 min at 4 °C. Protein concentration was assessed using a Bradford reagent (BioRad). In a 96-well plate, equal concentrations of the different cell lysates (∼1 mg protein/mL in Buffer A) were supplemented with 9.2 μM sensor 5 (at 2× concentration in Buffer A, 1/2 total assay volume), and the fluorescence change was monitored via a fluorescent plate reader (λex = 600 nm, λem = 700 nm).
Simultaneous assay of two catalytic activities
Each well of a 96 well plate contained 150 μL Buffer A with various combinations of substrates [100 μM Z-LLE- βna (Ca-L substrate); 100 μM Boc-LRR-amc (T-L substrate); 30 μM ChT-probe (5)]. The reaction was initiated by the addition of 4 μL/well purified 20S proteasome (0.29 mg/mL). The fluorescence change of respective probes was simultaneously monitored in the plate reader at: λex = 342 nm, λem = 425 nm (Ca-L); λex = 380 nm, λem = 460 nm (T-L); λex = 600 nm, λem = 700 nm (Ch-L) at 30 °C.
Light-driven conversion of caged probe to active probe
The uncaging setup consisted of a UV pulsed laser source illuminating the sample contained in a quartz cuvette. The laser was a diode-pumped, Q-switched UV laser that produces 5 ns pulses at 349 nm with a peak repetition rate of 1 kHz and 100 mJ pulse energy (Explorer, Spectra-Physics, Mountain View, CA). The beam was expanded and collimated to ∼1 cm diameter and illuminated the side face of a 160 μL quartz cuvette through a 2 × 8 mm window (16.160F-Q-10, Starna Cells, Atascadero, CA). The uncaging dose was controlled by varying the number of pulses delivered to the sample and comparing to a reference standard [α-carboxy-o-nitrobenzyl (CMNB)-fluorescein] (Fig. S-3). Assay of peptide 10, both prior to and following photolysis was performed as follows: 5 μM peptide 10 (unexposed to light or photoactivated as indicated above) was added to wild type yeast cell lysates (0.9 mg protein/mL lysate) and the fluorescence change monitored in a fluorescent plate reader. Photolysis times were 2 and 10 min at 1 kHz.
Supplementary Material
Acknowledgments
DSL (CA79954 and GM067198) and MS (GM084228) thank the NIH for financial support, Dr. D. Larson and Professor J. Condeelis for use of their laser, and Professor M. Hochstrasser for several of the mutant yeast strains.
Footnotes
Supporting Information. Details of the yeast strains, the thirty-two-member peptide library, fluorescent and enzymological analysis of sensor 5, and photoconversion of caged 10 to its uncaged counterpart. This information is available free of charge via the Internet at http://pubs.acs.org/.
References
- 1.Grant S. Best Pract Res Clin Haematol. 2008;21:629–37. doi: 10.1016/j.beha.2008.08.003. [DOI] [PMC free article] [PubMed] [Google Scholar]
- 2.Marques AJ, Palanimurugan R, Matias AC, Ramos PC, Dohmen RJ. Chem Rev. 2009;109:1509–36. doi: 10.1021/cr8004857. [DOI] [PubMed] [Google Scholar]
- 3.Yang H, Zonder JA, Dou QP. Expert Opin Investig Drugs. 2009;18:957–71. doi: 10.1517/13543780903002074. [DOI] [PMC free article] [PubMed] [Google Scholar]
- 4.Kisselev AF, Akopian TN, Castillo V, Goldberg AL. Mol Cell. 1999;4:395–402. doi: 10.1016/s1097-2765(00)80341-x. [DOI] [PubMed] [Google Scholar]
- 5.Schmidtke G, Ench S, Groettrup M, Holzhütter HGJ. Biol Chem. 2000;275:22056–63. doi: 10.1074/jbc.M002513200. [DOI] [PubMed] [Google Scholar]
- 6.(a) Orlowski M, Cardozo C, Hidalgo MC, Michaud C. Biochemistry. 1991;30:5999–6005. doi: 10.1021/bi00238a025. [DOI] [PubMed] [Google Scholar]; (b) Kessler BM, Tortorella D, Altun M, Kisselev AF, Fiebiger E, Hekking BG, Ploegh HL, Overkleeft HS. Chem Biol. 2001;8:913–29. doi: 10.1016/s1074-5521(01)00069-2. [DOI] [PubMed] [Google Scholar]; (c) Kisselev AF, Goldberg A. Methods Enzymol. 2005;398:364–78. doi: 10.1016/S0076-6879(05)98030-0. [DOI] [PubMed] [Google Scholar]
- 7.Nussbaum AK, Dick TP, Keilholz W, Schirle M, Stevanovic' S, Dietz K, Heinemeyer W, Groll M, Wolf DH, Huber R, Rammensee HG, Schild H. Proc Natl Acad Sci USA. 1998;95:12504–9. doi: 10.1073/pnas.95.21.12504. [DOI] [PMC free article] [PubMed] [Google Scholar]
- 8.(a) Emmerich NP, Nussbaum AK, Stevanovic S, Priemer M, Toes RE, Rammensee HG, Schild HJ. Biol Chem. 2000;275:21140–8. doi: 10.1074/jbc.M000740200. [DOI] [PubMed] [Google Scholar]; (b) Harris JL, Alper PB, Li J, Rechsteiner M, Backes BJ. Chem Biol. 2001;8:1131–41. doi: 10.1016/s1074-5521(01)00080-1. [DOI] [PubMed] [Google Scholar]
- 9.Doose S, Neuweiler H, Sauer M. ChemPhysChem. 2005;6:2277–85. doi: 10.1002/cphc.200500191. [DOI] [PubMed] [Google Scholar]
- 10.Toutchkine A. PCT/US2009/46238 PCT Int Appl.
- 11.Sharma V, Lawrence DS. Angew Chem Intl Ed Engl. 2009;48:7290–2. doi: 10.1002/anie.200903717. [DOI] [PMC free article] [PubMed] [Google Scholar]
- 12.Arendt CS, Hochstrasser M. EMBO J. 1999;18:3575–85. doi: 10.1093/emboj/18.13.3575. [DOI] [PMC free article] [PubMed] [Google Scholar]
- 13.Lee HM, Larson DR, Lawrence DS. ACS Chem Biol. 2009;4:409–27. doi: 10.1021/cb900036s. [DOI] [PMC free article] [PubMed] [Google Scholar]
- 14.(a) Dai Z, Dulyaninova NG, Kumar S, Bresnick AR, Lawrence DS. Chem Biol. 2007;14:1254–60. doi: 10.1016/j.chembiol.2007.10.007. [DOI] [PMC free article] [PubMed] [Google Scholar]; (b) Wang Q, Dai Z, Cahill SM, Blumenstein M, Lawrence DSJ. Am Chem Soc. 2006;128:14016–7. doi: 10.1021/ja065852z. [DOI] [PMC free article] [PubMed] [Google Scholar]
- 15.Nandy SK, Agnes RS, Lawrence DS. Org Lett. 2007;9:2249–52. doi: 10.1021/ol070238t. [DOI] [PMC free article] [PubMed] [Google Scholar]
- 16.Schmidt M, Haas W, Crosas B, Santamaria PG, Gygi SP, Walz T, Finley D. Nat Struct Mol Biol. 2005;12:294–303. doi: 10.1038/nsmb914. [DOI] [PubMed] [Google Scholar]
- 17.Carpino LA, Cohen BJ, Stephens KE, Jr, Sadat-Aalaee Y, Tien JH, Langridge DCJ. Org Chem. 1986;51:3732–34. [Google Scholar]
Associated Data
This section collects any data citations, data availability statements, or supplementary materials included in this article.