Abstract
REDD1 (regulated in development and DNA damage responses) is essential for the inhibition of mTORC1 (mammalian target of rapamycin complex) signaling pathway in response to hypoxia. REDD1 expression is regulated by many stresses such as hypoxia, oxidative stress, and energy depletion. However, the regulation of REDD1 expression in response to insulin remains unknown. In the present study, we demonstrate that in murine and in human adipocytes, insulin stimulates REDD1 expression. Insulin-induced REDD1 expression occurs through phosphoinositide 3-kinase/mTOR-dependent pathways. Moreover, using echinomycin, a hypoxia-inducible factor 1 (HIF-1) inhibitor, and HIF-1α small interfering RNA, we demonstrate that insulin stimulates REDD1 expression only through the transcription factor HIF-1. In conclusion, our study shows that insulin stimulates REDD1 expression in adipocytes.
Keywords: Diseases/Diabetes, Gene/Transcription, Hormones/Insulin, Oxygen/Hypoxia, Phosphorylation/Kinases/Tyrosine, Signal Transduction/Phosphotyrosine/Receptors
Introduction
Mammalian target of rapamycin (mTOR)2 integrates several extrinsic signals that regulate cell growth and metabolism. mTOR is present in two multiprotein complexes: mTORC1, consisting of mTOR, Raptor, PRAS40, and mLST8/GβL; and mTORC2, composed of mTOR, LST8/GβL, Rictor, mSin1, and Protor. mTORC1 regulates cell growth through S6 kinase 1 and eIF-4E-binding protein 1, whereas mTORC2 modulates cell survival by phosphorylating Akt/protein kinase B. mTOR complexes are regulated by TSC1/TCS2, a GTPase-activating protein for the Ras-related small G protein Rheb, which regulates mTOR activation (1).
In response to insulin and growth factors, TSC2 is phosphorylated and inhibited by Akt/protein kinase B, leading to activation of mTORC1. In response to stress, TSC2 is activated by phosphorylation through the LKB1/AMPK pathway, which contributes to mTORC1 inhibition. Several proteins are involved in the regulation of mTORC1 activity, such as FKBP38, PRAS40, DEPTOR, or REDD1 (2–4).
REDD1 (for regulated in development and DNA damage responses), also known as RTP801/Dig2/DDIT4, is required for down-regulation of mTORC1 in response to hypoxia (5). Indeed, REDD1 overexpression is sufficient to inhibit mTOR activation, whereas loss of REDD1 blocks mTOR inhibition by hypoxia. REDD1 controls mTORC1 activity through 14-3-3 proteins. 14-3-3 proteins associate and inhibit TSC2 through direct binding. REDD1, induced by hypoxia, associates with 14-3-3, relieving TSC2 inhibition (6).
REDD1 is up-regulated in response to many stresses such as hypoxia, oxidative stress, endoplasmic reticulum stress, multiple DNA damage stimuli, and energy depletion. Depending on the physiological context, its transcription is controlled by several transcription factors. Indeed, REDD1 is expressed through hypoxia-inducible factor 1 (HIF-1), in MCF-7 cancer cells under hypoxic condition cells (7, 8). REDD1 is also regulated by activating transcription factor-4 in response to endoplasmic reticulum stress (9–11), by p53 and p63 during DNA damage (12), and by Elk-1 and CCAAT/enhancer-binding protein in response to arsenic in keratinocytes (13).
Insulin is a potent activator of mTOR, which regulates various physiological functions, including gene transcription, protein metabolism, cell cycle, and cytoskeleton organization. However, sustained mTOR activation is also involved in the development of insulin resistance. Insulin stimulates its transmembrane tyrosine kinase receptor, leading to the tyrosine phosphorylation of its major substrate, IRS-1 (insulin receptor substrate). IRS-1 is the upstream protein that controls all of the downstream signaling pathways. One of the mechanisms involved in the development of insulin resistance is the decrease of the tyrosine phosphorylation of IRS-1, which is concomitant with an increase in its serine phosphorylation. Several serine/threonine kinases are known to phosphorylate IRS-1 directly on serine residues, including ERK, JNK, IKKβ, and mTOR. It is crucial to understand the regulation of these kinases to identify specific targets involved in the development of insulin resistance (14). For this reason, we have studied the regulation of REDD1 expression in response to insulin. We show that insulin stimulates REDD1 expression in murine and human adipocytes. The expression of REDD1 in response to insulin is dependent on PI3K and mTOR activity and requires the transcription factor HIF-1.
EXPERIMENTAL PROCEDURES
Materials
Insulin was obtained from Lilly (Paris, France). Antibody to REDD1 was purchased from Proteintech (Chicago, IL). Antibody to HIF-1α (clone H1α67) was purchased from Novus Biologicals (Littleton, CO). Antibodies to phospho-S6 kinase 1, phospho-Thr308-protein kinase B, phospho-Thr202-Tyr204 ERK1/2, and phospho-PKC substrate were purchased from Cell Signaling Technology (Beverly, MA). Antibody to ERK2 was purchased from Santa Cruz Biotechnology (Heidelberg, Germany). Antibody to tubulin was purchased from Sigma-Aldrich. siRNA control and two different siRNA directed against HIF-1α (siRNA 1, s67530; and siRNA 2, s67531) were purchased from Ambion (Foster City, CA). The primer sets for real time PCR were purchased from Eurogentec (Seraing, Belgium). Culture media were obtained from Invitrogen. Inhibitors were obtained from Calbiochem.
Cell Culture
3T3-L1 fibroblasts and human preadipocytes were grown and induced to differentiate as described previously (15). Briefly, 3 days after confluence, 3T3-L1 fibroblasts were treated for 2 days with DMEM and 10% fetal calf serum (v/v) supplemented with 250 nmol/liter isobutylmethylxanthine, 250 nmol/liter dexamethasone, and 800 nmol/liter insulin and then for 2 additional days with DMEM and 10% fetal calf serum containing 800 nmol/liter insulin.
Human preadipocytes were obtained from Biopredic (Rennes, France) and were grown in DMEM and Ham's F-12 medium (Invitrogen) containing 15 mm HEPES, 2 mm l-glutamine, 10% fetal calf serum (Sigma), 1% antimycotic solution, ECGS/H-2, hEGF-5, and HC-500 from supplement pack preadipocyte growth medium (Promocell, Heidelberg, Germany). They were induced to differentiate in DMEM, Ham's F-12, 15 mm HEPES, 2 mm l-glutamine, and 3% fetal calf serum supplemented with 33 μm d-biotin, 17 μm panthotenate, 100 nm insulin, 1 μm dexamethasone and for the first 3 days of culture with 0.2 mm 3-isobutylmethylxanthine (16). Cells were used between days 2 and 7 after the end of the differentiation protocol when the adipocyte phenotype appeared in more than 90% of the cells.
Transfection of siRNA
After differentiation, 3T3-L1 adipocytes were trypsinized, control siRNA, or siRNA directed against HIF-1α (2 μg/2 × 106 adipocytes) were transfected using AMAXA nucleofector according to the manufacturer's instructions. The cells were seeded in 12-well plates coated with collagen IV (Sigma) and used 48 h after transfection (17).
Hypoxia Treatment
For hypoxic incubations, medium was replaced with DMEM containing 0.5% bovine serum albumin (w/v), and adipocytes were incubated at 37 °C for 16 h in a hypoxic chamber (Billups-Rothenberg, Dell Mar, CA) flushed for 10 min with gas mixture consisting of 1% O2, 5% CO2, and 94% N2 as described previously (15). For normoxic conditions, adipocytes were incubated for 16 h at 37 °C in 95% air and 5% CO2.
Western Blot Analysis
Serum-starved cells were treated with ligands, chilled to 4 °C, and washed with ice-cold phosphate-buffered saline (140 mm NaCl, 3 mm KCl, 6 mm Na2HPO4, 1 mm KH2PO4, pH 7.4), and solubilized with radioimmune precipitation assay buffer (50 mm Tris, pH 7.5, 150 mm NaCl, 1% Nonidet P-40, 0.1% SDS, 0.5% sodium deoxycholate, 1 mm orthovanadate, 5 mm NaF, 2.5 mm Na4P2O7, and Complete protease inhibitor mixture (Roche Diagnostics) for 30 min at 4 °C. Lysates were centrifuged (14,000 rpm) for 10 min at 4 °C, and the protein concentration was determined using BCA protein assay reagent (Thermo Fisher Scientific, Brebières, France). Cell lysates were analyzed by Western blotting. Immunoblots were revealed using a Fujifilm LAS-3000 imaging system. Quantifications were realized using MultiGauge or ImageJ software.
mRNA Analysis
RNA was isolated from adipocytes (TRIzol; Invitrogen), and cDNA was synthesized using Transcriptor first strand cDNA synthesis kit (Roche Diagnostics). Relative quantification of gene expression was measured by real time PCR. The primer sets used for REDD1 were: forward, 5′-TACTGCCCACCTTTCAGTTG-3′ and reverse, 5′-GTCAGGGACTGGCTGTAACC-3′; for HIF-1α: forward, 5′-TCCATGTGACCATGAGGAAA-3′ and reverse, 5′-CTTCCACGTTGCTGACTTGA; and for the housekeeping gene 36B4: forward, 5′-TCCAGGCTTTGGGCATCA-3′ and reverse, 5′-CTTTATCAGCTGCACATCACTCA-3′.
Statistical Analysis
Statistical differences between groups were analyzed by Student's t test. They were considered significant at p < 0.05.
RESULTS
Insulin Induces REDD1 Expression in Adipocytes
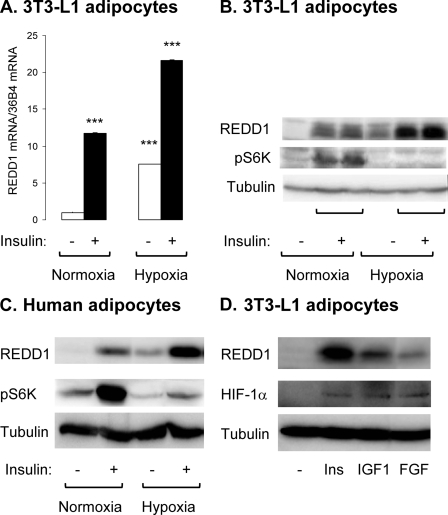
We have investigated the effect of prolonged insulin stimulation on REDD1 expression in adipocytes. Murine (3T3-L1) and human adipocytes were stimulated with insulin for 16 h and REDD1 mRNA, and protein levels were analyzed (Fig. 1). In 3T3-L1 adipocytes, in normoxic conditions, insulin stimulates REDD1 mRNA and protein expression. Incubation of adipocytes in hypoxia (1% O2) stimulates REDD1 expression. Importantly, this expression is enhanced when adipocytes are incubated with insulin under hypoxia (Fig. 1, A and B). In hypoxic conditions, increased REDD1 expression is correlated with an inhibition of S6K-1 phosphorylation in basal and insulin-stimulated conditions. Similar results were observed in human adipocytes (Fig. 1C).
FIGURE 1.
Insulin induces REDD1 expression in murine and human adipocytes. 3T3-L1 adipocytes were incubated for 16 h in normoxia (21% O2) or in hypoxia (1% O2) in absence or presence of 100 nm insulin. A, REDD1 and 36B4 mRNA were measured by real time PCR (n = 3). B, cell lysates were analyzed by immunoblots with the indicated antibodies. C, human adipocytes were incubated for 16 h in normoxia (21% O2) or in hypoxia (1% O2) in absence or presence of 100 nm insulin. The cell lysates were analyzed by immunoblots with the indicated antibodies. D, 3T3-L1 adipocytes were stimulated for 16 h with 100 nm insulin, 100 nm insulin-like growth factor 1 (IGF1), or 50 ng/ml fibroblast growth factor (FGF), and cell lysates were analyzed by immunoblots with the indicated antibodies. Representative experiments of three independent experiments are shown. Error bars indicate ±S.E. ***, p < 0.005.
To test the specificity of insulin action, other growth factors were tested for their ability to stimulate REDD1 expression. 3T3-L1 adipocytes were stimulated for 16 h with insulin, insulin-like growth factor 1, or fibroblast growth factor 2, and expression of REDD1 and HIF-1α was assessed by immunoblotting. All growth factors increase HIF-1α and REDD1 expression, although to a different extent (Fig. 1D).
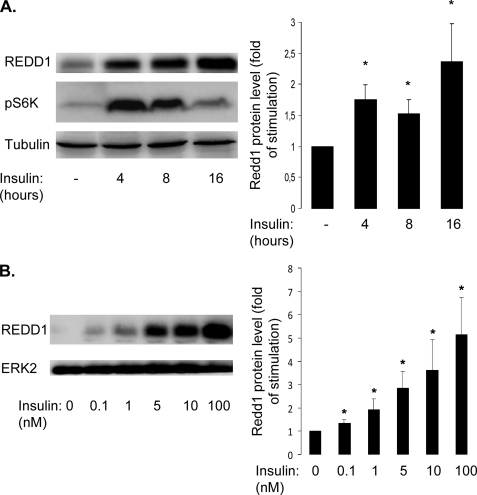
To characterize the expression of REDD1 in response to insulin, a time course of induction and a dose-response curve were performed. 3T3-L1 adipocytes were treated with insulin for increased period of time, and REDD1 expression and phosphorylation of S6 kinase 1 were detected by immunoblots (Fig. 2A). REDD1 expression increases after 4 h of insulin treatment up to 16 h. Phosphorylation of S6K-1 in response to insulin is decreased in the presence of elevated REDD1 protein level. 3T3-L1 adipocytes were stimulated for 16 h with increasing amounts of insulin (ranging from 0.1 nm to 100 nm). Insulin stimulates REDD1 expression even at physiological concentration (0.1 nm) and in a dose-dependent manner (Fig. 2B).
FIGURE 2.
REDD1 is induced by insulin in a time- and dose-dependent manner. A, 3T3-L1 adipocytes were stimulated with 100 nm insulin for 4, 8, or 16 h, and cell lysates were analyzed by immunoblots with the indicated antibodies. B, 3T3-L1 adipocytes were stimulated for 16 h with increasing insulin concentrations (from 0.1 to 100 nm), and cell lysates were analyzed by immunoblots with the indicated antibodies. Representative experiments and quantification of six independent experiments are shown. Error bars indicate ±S.E. *, p < 0.05.
Insulin Stimulates REDD1 Expression through PI3K/mTOR Pathways
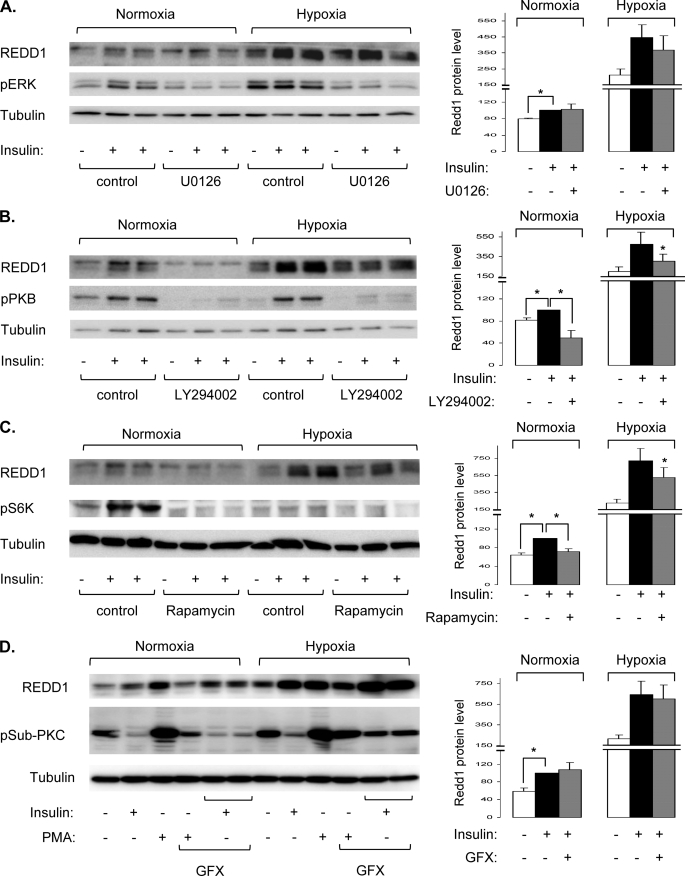
To elucidate the molecular mechanisms involved in REDD1 induction by insulin, we have investigated the implication of protein kinases that are activated in response to insulin. To this end, we have used specific pharmacological inhibitors against ERK, PI3K, mTOR, and PKC (Fig. 3). Human adipocytes were stimulated with insulin for 16 h in normoxia or in hypoxia in the absence or presence of inhibitors, and REDD1 expression was detected by immunoblotting. As previously, insulin and hypoxia stimulate REDD1 expression, and the combination of the two treatments led to additive effects. Inhibition of ERK phosphorylation by U0126, a mitogen-activated protein kinase/ERK inhibitor, does not significantly inhibit the expression of REDD1 in response to insulin and hypoxia (Fig. 3A). In contrast, LY294002, an inhibitor of PI3K, inhibits the expression of REDD1 in response to insulin in normoxia. LY294002 does not prevent the effect of hypoxia, but it blocked the effect of insulin on the expression of REDD1 (Fig. 3B). Rapamycin, a potent inhibitor of mTOR, decreases the expression of REDD1 in response to insulin in normoxia. In hypoxia, rapamycin partly inhibits REDD1 expression in response to insulin.
FIGURE 3.
Insulin stimulates REDD1 expression through PI3K/mTOR-dependent pathways in human adipocytes. Human adipocytes were incubated in normoxia (21% O2) or in hypoxia (1% O2) for 16 h in the absence or presence of 100 nm insulin, with or without 10 μm U0126 (A), 50 μm LY294002 (B), 40 nm rapamycin (C), or 10 μm GFX (D). Cell lysates were analyzed by immunoblots with the indicated antibodies. Representative experiments and quantification of REDD1 expression obtained from five to eight independent experiments are shown. Error bars indicate ±S.E. * p < 0.05.
To study the implication of PKC in the expression of REDD1 in response to insulin, we used phorbol 12-myristate 13-acetate (PMA), a specific activator of PKC and GFX109203X (GFX), a PKC inhibitor. Human adipocytes were incubated with insulin or PMA in the absence or presence of GFX for 16 h in normoxia or in hypoxia. PKC activity is revealed using a phospho- PKC substrate antibody (pSub-PKC), which detects PKC-dependent phosphorylation of endogenous proteins. As shown in Fig. 3D, activation of PKC by PMA stimulates the phosphorylation of several endogenous proteins. Moreover, PMA increases expression of REDD1. Inhibition of PKC activity by GFX does not inhibit REDD1 expression induced by insulin in normoxia as well as in hypoxia (Fig. 3D). These results suggest that in human adipocytes, insulin stimulates REDD1 expression through PI3K/mTOR signaling pathways.
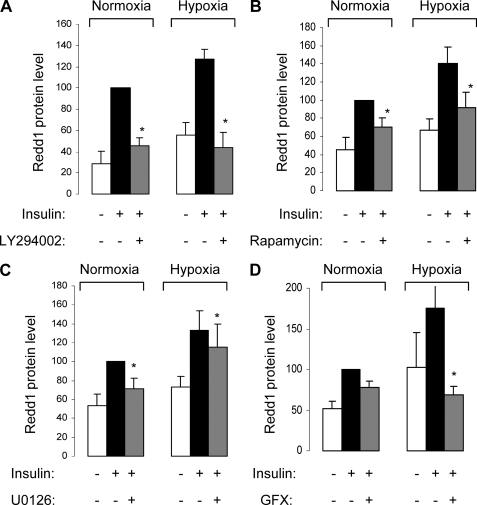
These inhibitors were also used in 3T3-L1 adipocytes (Fig. 4). As in human adipocytes, the expression of REDD1 induced by insulin is completely inhibited by the PI3K inhibitor, LY294002 (Fig. 4A), and partially inhibited by the mTOR inhibitor, rapamycin (Fig. 4B). However, in contrast to human adipocytes, in 3T3-L1 adipocytes, inhibition of ERK by U0126 partially inhibited the expression of REDD1 in response to insulin in normoxia, without any significant effect in hypoxia (Fig. 4C). Inhibition of PKC by GFX does not affect the insulin-induced REDD1 expression, but it inhibits only the expression of REDD1 in response to insulin in hypoxia (Fig. 4D). These observations suggest that in 3T3-L1 adipocytes, insulin stimulates REDD1 expression through the PI3K/mTOR pathway.
FIGURE 4.
Regulation of REDD1 expression in response to insulin in 3T3-L1 adipocytes. 3T3-L1 adipocytes were incubated in normoxia (21% O2) or in hypoxia (1% O2) for 16 h in the absence or in presence of 100 nm insulin with or without 10 μm U0126, 50 μm LY294002, 40 nm rapamycin, or 10 μm GFX. Cell lysates were analyzed by immunoblotting with the indicated antibodies. Quantifications of REDD1 expression obtained from three to five independent experiments are shown. Error bars indicate ±S.E. *, p < 0.05.
Expression of REDD1 in Response to Insulin Depends on HIF-1 Transcription Factor
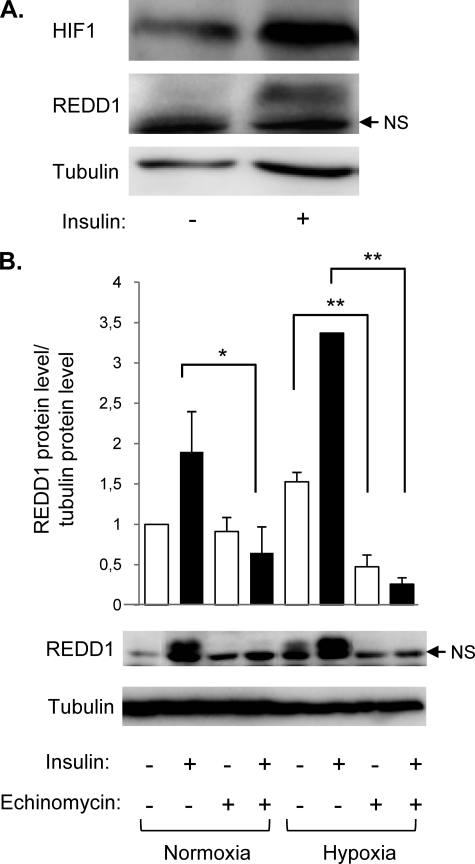
Expression of REDD1 has been shown to be regulated by several transcription factors, such as HIF-1. HIF-1 is composed of two subunits: HIF-1β, which is constitutively expressed, and HIF-1α. Activation of HIF-1 is correlated with the level of expression of the HIF-1α subunit. Growth factors stimulate HIF-1α translation, whereas hypoxia inhibits its degradation through proteasome. First, we have determined the effect of insulin on HIF-1α expression in 3T3-L1 adipocytes. After insulin stimulation, cytosolic and nuclear fractions were separated, and HIF-1α expression was detected by immunoblots (Fig. 5). Insulin stimulates HIF-1α and REDD1expression in response to insulin.
FIGURE 5.
Echinomycin inhibits REDD1 expression in response to insulin. A, 3T3-L1 adipocytes were stimulated with 100 nm insulin for 16 h, and HIF-1α and REDD1 protein expression was determined by immunoblotting. A representative experiment of three independent experiments is shown. B, 3T3-L1 adipocytes were stimulated in normoxia (21% O2) or in hypoxia (1% O2) in the absence or presence of 100 nm insulin and 20 μm echinomycin for 16 h. The cell lysates were analyzed by immunoblotting with the indicated antibodies, and the quantification of REDD1 protein level obtained in three independent experiments is shown. Error bars indicate ±S.E. *, p < 0.05; **, p < 0.01.
To investigate the implication of HIF-1 transcription factor in the insulin-induced REDD1 expression, we have used echinomycin, a HIF-1 inhibitor. Echinomycin inhibits binding of HIF-1 to hypoxia-responsive element, which contains a 5′-ACGT-3′ sequence, but does not inhibit the accumulation of the HIF-1α subunit (18). When 3T3-L1 adipocytes were stimulated for 16 h with insulin in the absence or in presence of echinomycin, echinomycin totally inhibited the expression of REDD1 in response to insulin and hypoxia (Fig. 5B).
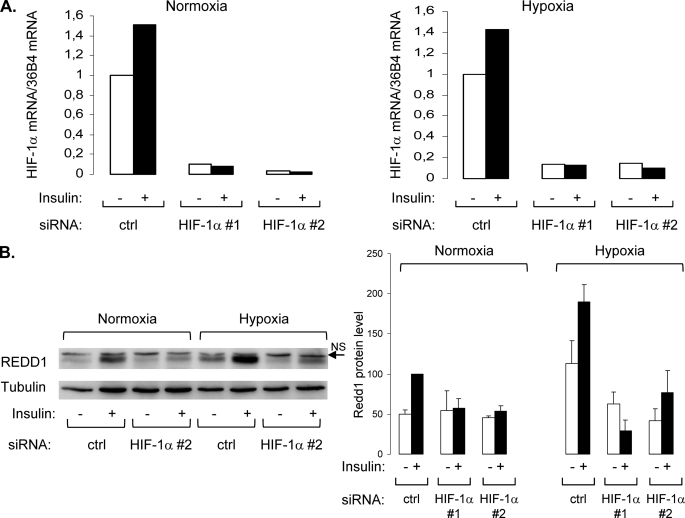
To confirm the implication of HIF-1 transcription factor in insulin- and hypoxia-induced REDD1 expression, 3T3-L1 adipocytes were transfected with two distinct siRNAs directed against HIF-1α. Transfection of HIF-1α siRNA (siRNA HIF-1α 1 and 2) totally inhibited HIF-1α mRNA expression (Fig. 6A). Down-regulation of HIF-1α protein level is sufficient to abolish both insulin- and hypoxia-induced REDD1 expression (Fig. 6B). These results strongly suggest that in 3T3-L1 adipocytes, both insulin and hypoxia stimulate REDD1 expression through HIF-1 transcription factor.
FIGURE 6.
REDD1 expression induced by insulin is dependent on the transcription factor HIF-1. 3T3-L1 adipocytes were transfected with two distinct HIF-1α siRNA (#1 and #2) as described under “Experimental Procedures” and were incubated in normoxia (21% O2) or in hypoxia (1% O2) in the absence or presence of 100 nm insulin for 16 h. HIF-1α mRNA was measured by real time PCR (A), and cell lysates were analyzed by immunoblotting with the indicated antibodies. Representative experiments of at least three independent experiments are shown, as well as the quantification of several independent experiments.
DISCUSSION
In adipose tissue, insulin regulates glucose and lipid homeostasis through the stimulation of glucose transport and inhibition of lipolysis. Insulin mediates its effect by the activation of two major signaling pathways: ERK-dependent and PI3K/mTOR pathways (19). Activation of signaling pathways by insulin has been well documented and occurs through the phosphorylation of IRSs. In contrast, mechanisms involved in the down-regulation of insulin signaling are less described. In the present study, we show that the expression of a mTOR inhibitor, REDD1, is induced by insulin in murine and human adipocytes. Insulin-induced REDD1 expression occurs through PI3K/mTOR signaling pathways and the activation of HIF-1 transcription factor.
In adipocytes, insulin stimulates REDD1 expression in a dose-dependent manner with a 1.93 ± 0.4-fold increase at physiological concentration of insulin (1 nm). This observation strongly suggests that REDD1 could be physiologically regulated by insulin. Its expression in response to insulin is maximal after 16 h and is maintained at least up to 24 h (data not shown). Insulin and hypoxia have an additive effect on REDD1 expression. This synergistic effect could be because insulin and hypoxia activate different transcription factors implicated in REDD1 expression. However, our results demonstrate that both insulin and hypoxia regulate REDD1 expression through the activation of HIF-1. Using echinomycin, an inhibitor that prevents HIF-1 binding to specific target sequences in promoter and siRNA against HIF-1α, we demonstrate that REDD1 expression induced by insulin and hypoxia is dependent on HIF-1 transcription factor in adipocytes. These observations suggest that HIF-1 is the only transcription factor implicated in the expression of REDD1 in response to insulin and hypoxia in adipocytes. Although HIF-1 has been originally described to regulate REDD1 expression (7), other transcription factors regulate REDD1 expression such as ATF4 or C/EBP in response to oxidative and endoplasmic reticulum stress (10, 11, 13) as well as p53 and p63 (12) in different cell types.
The synergy between insulin and hypoxia could be explained by the fact that they regulate HIF-1 through distinct mechanisms. Indeed, it has been well demonstrated that hypoxia activates HIF-1 activity through the stabilization of the α-subunit and the recruitment of co-activators such as p300-CBP (CREB-binding protein) (20), whereas insulin, and more generally growth factors, activate HIF-1 through the enhancement of HIF-1α translation (21). Treatment with insulin under hypoxia would induce an increase in HIF-1α translation and a stabilization of this protein, allowing an increased activity of HIF-1 transcription factor. This synergy between insulin and hypoxia has also been observed for the regulation of the expression of apelin (22).
The expression of REDD1 in response to insulin is dependent on PI3K and mTOR signaling pathways because LY294002 and rapamycin inhibit the expression of REDD1 in response to insulin in both human and murine adipocytes. The effects of these inhibitors are probably targeted directly to the activity of HIF-1 because PI3K and mTOR are implicated in the activation of HIF-1 in response to hypoxia and insulin (21, 23, 24). In contrast, inhibition of ERK and GFX is less efficient in inhibiting REDD1 expression. This is not surprising because ERK does not seem to regulate HIF-1 activity in response to insulin (21). PKC increases the stability of HIF-1α, leading to HIF-1 activation (25, 26), which could explain why GFX inhibits the expression of REDD1 only under hypoxia. In adipocytes, we propose that insulin regulates REDD1 expression through an increase in HIF-1α translation followed by the activation of HIF-1 and the expression of REDD1.
Increased REDD1 expression in response to insulin could be envisioned as a regulatory loop to restore a basal signaling pathway. In this feedback mechanism, insulin activates its receptor, leading to the tyrosine phosphorylation of IRS proteins and the activation of ERK and PI3K/mTOR pathways. Prolonged insulin treatment down-regulates insulin signaling by promoting inhibitory serine phosphorylation of IRS-1 by serine/threonine kinases such as JNK, IKK, ERK, S6K, and mTOR (27). We propose that long term induction of REDD1 expression by insulin could represent a mechanism necessary to terminate the signal on mTOR and to restore the ability of insulin to stimulate a normal pathway. This hypothesis could be generalized to other growth factors because insulin-like growth factor 1 and fibroblast growth factor stimulate REDD1 expression in adipocytes. Moreover, during the revision of our paper, Frost et al. (28) demonstrated that REDD1 is induced by insulin-like growth factor 1 in skeletal muscle and C2C12 myotubes. However, because REDD1 plays a role in the generation of reactive oxygen species by an unidentified mechanism (12) and because reactive oxygen species accumulation is in general associated with cellular insulin resistance (29), increased REDD1 expression in response to insulin could participate to the development of insulin resistance. This latter hypothesis is reinforced by the observation that expression of REDD1 is significantly higher in liver of morbidly obese patients (30).
In conclusion, we demonstrate that in adipocytes, insulin stimulates REDD1 expression through HIF-1 activity. Further experiments will be required to investigate the role of REDD1 in insulin signaling pathway and insulin resistance.
Acknowledgments
We thank Thierry Grémeaux and Teresa Gonzalez for help in the culture and differentiation of 3T3-L1 and human adipocytes and Drs. Mireille Cormont and Pascal Peraldi for helpful comments.
This work was supported by INSERM, France, the Association de Langue Française pour l'Etude du Diabète et des Maladies Métaboliques (ALFEDIAM), ALFEDIAM-Roche Diagnostics, the Association for Research on Diabetes (Paris, France), the Association pour la Recherche contre le Cancer Grant 1018, the University of Nice-Sophia Antipolis, Region Provence-Alpes-Cote-d'Azur, Conseil Général des Alpes Maritimes. This work is part of the project “Hepatic and Adipose Tissue and Functions in the Metabolic Syndrome” (HEPADIP), which is supported by the European Commission as an integrated Project under the 6th Framework Program, Contract LSHM-CT-2005-018734.
- mTOR
- mammalian target of rapamycin
- TSC
- tuberous sclerosis complex
- REDD1
- regulated in development and DNA damage responses 1
- HIF-1
- hypoxia-inducible factor 1
- ERK
- extracellular signal-regulated kinase
- IRS
- insulin receptor substrate
- JNK
- c-Jun N-terminal kinase
- PI3K
- phosphoinositide 3-kinase
- PKC
- protein kinase C
- siRNA
- small interfering RNA
- DMEM
- Dulbecco's modified Eagle's medium
- PMA
- phorbol 12-myristate 13-acetate
- GFX
- GFX109203X.
REFERENCES
- 1.Guertin D. A., Sabatini D. M. (2007) Cancer Cell 12, 9–22 [DOI] [PubMed] [Google Scholar]
- 2.Peterson T. R., Laplante M., Thoreen C. C., Sancak Y., Kang S. A., Kuehl W. M., Gray N. S., Sabatini D. M. (2009) Cell 137, 873–886 [DOI] [PMC free article] [PubMed] [Google Scholar]
- 3.Vander Haar E., Lee S. I., Bandhakavi S., Griffin T. J., Kim D. H. (2007) Nat. Cell Biol. 9, 316–323 [DOI] [PubMed] [Google Scholar]
- 4.Sofer A., Lei K., Johannessen C. M., Ellisen L. W. (2005) Mol. Cell. Biol. 25, 5834–5845 [DOI] [PMC free article] [PubMed] [Google Scholar]
- 5.Brugarolas J., Lei K., Hurley R. L., Manning B. D., Reiling J. H., Hafen E., Witters L. A., Ellisen L. W., Kaelin W. G., Jr. (2004) Genes Dev. 18, 2893–2904 [DOI] [PMC free article] [PubMed] [Google Scholar]
- 6.DeYoung M. P., Horak P., Sofer A., Sgroi D., Ellisen L. W. (2008) Genes Dev. 22, 239–251 [DOI] [PMC free article] [PubMed] [Google Scholar]
- 7.Shoshani T., Faerman A., Mett I., Zelin E., Tenne T., Gorodin S., Moshel Y., Elbaz S., Budanov A., Chajut A., Kalinski H., Kamer I., Rozen A., Mor O., Keshet E., Leshkowitz D., Einat P., Skaliter R., Feinstein E. (2002) Mol. Cell. Biol. 22, 2283–2293 [DOI] [PMC free article] [PubMed] [Google Scholar]
- 8.Aprelikova O., Wood M., Tackett S., Chandramouli G. V., Barrett J. C. (2006) Cancer Res. 66, 5641–5647 [DOI] [PubMed] [Google Scholar]
- 9.Jin H. O., Seo S. K., Woo S. H., Kim E. S., Lee H. C., Yoo D. H., Choe T. B., Hong S. I., Kim J. I., Park I. C. (2009) FEBS Lett. 583, 123–127 [DOI] [PubMed] [Google Scholar]
- 10.Jin H. O., Seo S. K., Woo S. H., Kim E. S., Lee H. C., Yoo D. H., An S., Choe T. B., Lee S. J., Hong S. I., Rhee C. H., Kim J. I., Park I. C. (2009) Free Radic. Biol. Med. 46, 1158–1167 [DOI] [PubMed] [Google Scholar]
- 11.Whitney M. L., Jefferson L. S., Kimball S. R. (2009) Biochem. Biophys. Res. Commun. 379, 451–455 [DOI] [PMC free article] [PubMed] [Google Scholar]
- 12.Ellisen L. W., Ramsayer K. D., Johannessen C. M., Yang A., Beppu H., Minda K., Oliner J. D., McKeon F., Haber D. A. (2002) Mol. Cell 10, 995–1005 [DOI] [PubMed] [Google Scholar]
- 13.Lin L., Stringfield T. M., Shi X., Chen Y. (2005) Biochem. J. 392, 93–102 [DOI] [PMC free article] [PubMed] [Google Scholar]
- 14.Tanti J. F., Jager J. (2009) Curr. Opin. Pharmacol. 9, 753–762 [DOI] [PubMed] [Google Scholar]
- 15.Regazzetti C., Peraldi P., Grémeaux T., Najem-Lendom R., Ben-Sahra I., Cormont M., Bost F., Le Marchand-Brustel Y., Tanti J. F., Giorgetti-Peraldi S. (2009) Diabetes 58, 95–103 [DOI] [PMC free article] [PubMed] [Google Scholar]
- 16.Aouadi M., Jager J., Laurent K., Gonzalez T., Cormont M., Binétruy B., Le Marchand-Brustel Y., Tanti J. F., Bost F. (2007) FEBS Lett. 581, 5591–5596 [DOI] [PubMed] [Google Scholar]
- 17.Jager J., Grémeaux T., Gonzalez T., Bonnafous S., Debard C., Laville M., Vidal H., Tran A., Gual P., Le Marchand-Brustel Y., Cormont M., Tanti J. F. (2010) Diabetes 59, 61–70 [DOI] [PMC free article] [PubMed] [Google Scholar]
- 18.Kong D., Park E. J., Stephen A. G., Calvani M., Cardellina J. H., Monks A., Fisher R. J., Shoemaker R. H., Melillo G. (2005) Cancer Res. 65, 9047–9055 [DOI] [PubMed] [Google Scholar]
- 19.Taniguchi C. M., Emanuelli B., Kahn C. R. (2006) Nat. Rev. Mol. Cell. Biol. 7, 85–96 [DOI] [PubMed] [Google Scholar]
- 20.Semenza G. L. (2007) Sci, STKE 2007, cm8. [DOI] [PubMed] [Google Scholar]
- 21.Treins C., Giorgetti-Peraldi S., Murdaca J., Semenza G. L., Van Obberghen E. (2002) J. Biol. Chem. 277, 27975–27981 [DOI] [PubMed] [Google Scholar]
- 22.Glassford A. J., Yue P., Sheikh A. Y., Chun H. J., Zarafshar S., Chan D. A., Reaven G. M., Quertermous T., Tsao P. S. (2007) Am. J. Physiol. Endocrinol. Metab. 293, E1590–E1596 [DOI] [PMC free article] [PubMed] [Google Scholar]
- 23.Gordan J. D., Simon M. C. (2007) Curr. Opin. Genet. Dev. 17, 71–77 [DOI] [PMC free article] [PubMed] [Google Scholar]
- 24.Denko N. C. (2008) Nat. Rev. Cancer 8, 705–713 [DOI] [PubMed] [Google Scholar]
- 25.Datta K., Li J., Bhattacharya R., Gasparian L., Wang E., Mukhopadhyay D. (2004) Cancer Res. 64, 456–462 [DOI] [PubMed] [Google Scholar]
- 26.Lee J. W., Park J. A., Kim S. H., Seo J. H., Lim K. J., Jeong J. W., Jeong C. H., Chun K. H., Lee S. K., Kwon Y. G., Kim K. W. (2007) Cancer Sci. 98, 1476–1481 [DOI] [PMC free article] [PubMed] [Google Scholar]
- 27.Gual P., Le Marchand-Brustel Y., Tanti J. F. (2005) Biochimie 87, 99–109 [DOI] [PubMed] [Google Scholar]
- 28.Frost R. A., Huber D., Pruznak A., Lang C. H. (2009) J. Cell. Biochem. 108, 1192–1202 [DOI] [PMC free article] [PubMed] [Google Scholar]
- 29.Eriksson J. W. (2007) FEBS Lett. 581, 3734–3742 [DOI] [PubMed] [Google Scholar]
- 30.Elam M. B., Cowan G. S., Jr., Rooney R. J., Hiler M. L., Yellaturu C. R., Deng X., Howell G. E., Park E. A., Gerling I. C., Patel D., Corton J. C., Cagen L. M., Wilcox H. G., Gandhi M., Bahr M. H., Allan M. C., Wodi L. A., Cook G. A., Hughes T. A., Raghow R. (2009) Obesity 17, 1563–1573 [DOI] [PubMed] [Google Scholar]


