Abstract
Ras-related nuclear protein (Ran) is a Ras family GTPase, and its documented functions are the regulation of DNA replication, cell cycle progression, nuclear structure formation, RNA processing and exportation, and nuclear protein importation. In this study, we performed detailed mapping of Ran expression during mouse ontogeny using in situ hybridization. High Ran expression was found in various organs and tissues including the thymus cortex and spleen white pulp. Ran was induced in T cells 24 h after their activation. The function of Ran in the immune system was investigated using Ran transgenic (Tg) mice. In Ran Tg T cells, there was compromised activation marker expression, lymphokine secretion, and proliferation upon T cell receptor activation in vitro when compared with wild type T cells. Tg mice also manifested defective delayed type hypersensitivity in vivo. Upon PMA and ionomycin stimulation, Tg T cells were defective in nuclear accumulation of AP-1 factors (c-Jun and c-Fos) but not NF-κB family members. Our experiments showed that Ran had important regulatory function in T cell activation. One of the possible mechanisms is that intracellular Ran protein levels control the nuclear retention for selective transcription factors such as c-Jun and c-Fos of AP-1, which is known to be critical in T cell activation and proliferation and lymphokine secretion.
Keywords: Cell/Differentiation, Gene, Gene/Regulation, Immunology/T cell Receptor, Protein/Binding/DNA, Protein/Translocation, Receptors/Cytokine
Introduction
Ras-related nuclear protein (Ran)3 GTPase was first identified as a member of Ras family guanine nucleotide-binding proteins in 1990 from teratocarcinoma cells (1). It is a rather abundant 25-kDa protein, about 80% of which is located in the nucleus (2). Ran is a highly conserved gene from yeast to mammals (1, 3). It forms a complex with RCC1 (regulator of chromosomal condensation) (4), and the complex performs critical functions in many cellular events, such as DNA replication (5), cell cycle progression (5), nuclear structure (6, 7), RNA processing and exportation (8), and nuclear protein importation (9). In the mouse genome, Ran resides in chromosome 5 (GenBankTM accession number NM_009391). Multiple Ran isoform genes are located in different genomic loci in mice (10). An actively transcribed isoform, Ran/M2, is coded by a gene in chromosome 7 (GenBank accession number: NM_009028); Ran and Ran/M2 share 94.6% identity in the nucleotide coding sequence and 94.0% identity and 98.1% similarity (allowing amino acid substitution) in their peptide sequences (11). It is likely that multiple isoforms are the result of gene duplication during evolution. Ran is expressed in various tissues, whereas Ran/M2 has restricted expression in the testis according to real-time reverse transcription-PCR (RT-PCR) analysis (11).
The roles of Ran in the immune system have been reported in a few articles (12–14). Cells overexpressing Ran by in vitro transfection seem to gain the ability of T cell costimulation. For example, COS cells transfected with Ran can costimulate mouse CD8 but not CD4 cells; RMA lymphoma cells transfected with Ran become less tumorigenic in vivo (12). Consistent with the role of Ran in protein importation into nuclei, IFN-γ-dependent STAT-1 translocation to nuclei depends on Ran and its GTPase activity (13).
In this study, we mapped the expression pattern of Ran during ontogeny. We generated transgenic mice overexpressing Ran using an actin promoter. Ran transgenic (Tg) T cells presented compromised functions and reduced c-Jun and c-Fos nuclear import upon activation. Our results suggest that the Ran expression level controls the nuclear presence of selective transcription factors, which in turn modulate T cell immune responses.
MATERIALS AND METHODS
In Situ Hybridization (ISH)
The 1091-bp full-length Ran cDNA in pCMV-SPORT6 (clone MGC-18932 from the American Type Culture Collection, Manassas, VA) was employed to generate sense and antisense riboprobes using SP6 and T7 RNA polymerase for both [35S]UTP and [35S]CTP incorporation, as described elsewhere (14). Tissues were frozen in −35 °C isopentane and kept at −80 °C until cut. ISH was performed on 10-μm cryostat sections, as outlined previously (15). Anatomic ISH was conducted with x-ray films. ISH microscopy was obtained by photographic emulsion followed by 8-day exposure. The slides were developed and then counterstained with hematoxylin.
Generation of Ran Tg Mice
Mouse full-length Ran cDNA (MGC-18932) was excised from the vector with SmaI/Xba, and cloned into the BamHI (blunted)/XbaI sites in vector pAC between the human β-actin promoter and β-actin poly(A) signals. The resulting construct was named pAC-Ran. The 4.9-kb ClaI/ClaI fragment containing the β-actin promoter, Ran cDNA, and β-actin poly(A) signal was excised and injected into fertilized C3H × C57BL/6 eggs.
Genotyping of the Tg mice was first performed by Southern blot analysis. Tail DNA of the founders (10 μg/each) was digested with PstI and resolved by 1% agarose gel electrophoresis. The DNA was transferred onto N+ Hybond nylon membranes after denaturation. A 559-bp NotI/SalI fragment from Ran/M2 cDNA (clone H2101F02, NIA, National Institutes of Health, mouse 15,000 cDNA clone set; positions 416–1075, according to the sequence in GenBank, accession number NM_009028) was labeled with digoxin by a digoxin labeling kit from Roche Applied Sciences (Laval, QC, Canada). The membranes were hybridized with digoxin-labeled probes, and the signals were revealed by a digoxin detection kit (Roche Applied Sciences). A 2.38-kb band specific to the transgene was detected.
PCRs were conducted for subsequent genotyping. The 5′ and 3′ primers were GAGGTTGCTCAGACGACTGCT (derived from Ran/M2 cDNA with 90.4% homology to the Ran cDNA) and GAATGCAATTGTTGGTAACTTG (derived from a sequence downstream of the insert in the plasmid construct), respectively, to detect a 529-bp band. The following PCR conditions were employed: 94 °C × 5 min, 1 cycle; 94 °C × 1 min, 55 °C × 1 min, 72 °C × 1 min, 30 cycles; 72 °C × 5 min, 1 cycle.
Real-time RT-PCR for Ran mRNA Expression
Ran mRNA in the Tg and WT lymphocytes was measured by real-time RT-PCR, with the 5′ and 3′ primers of GTATTGTGTGGCAACAAAAGTG and GAGCTTTCTGGCAAGCCAG, respectively. A 153-bp product was detected with the following amplification program: 95 °C × 15 min, 1 cycle; 94 °C × 15 s, 55 °C × 30 s, 72 °C ×x 30 s, 40 cycles. β-Actin mRNA levels of the samples were measured as internal controls; the 5′ and 3′ primers were TGGTACCACAGGCATTGTGAT and TGATGTCACGCACGATTTCCCT, respectively, with the same amplification program as for Ran mRNA. PCR was conducted in triplicate, and the ratios of Ran versus β-actin signals represent the normalized levels of Ran expression.
T Cell Lymphokine Secretion and Proliferation
T cells, CD4 cells, and CD8 cells were purified according to established methods (15). T cells were stimulated with solid phase anti-CD3 or solid phase anti-CD3 plus anti-CD28 (15). In some experiments, total spleen cells were stimulated with mitomycin-C-treated BALB/c spleen cells in mixed lymphocyte culture. Cell supernatants were collected and assayed for IL-2, IFN-γ, and IL-4 by enzyme-linked immunosorbent assay. T cell or spleen cell proliferation was measured with [3H]thymidine uptake. All these methods have been detailed in our previous publication (15).
In some experiments, Th1 and Th2 populations were polarized from naive CD4+ T cells, which were isolated from pooled splenocytes and lymph node cells using a naive CD4+ T cell isolation kit (R&D Systems, Minneapolis, MN). The purity of naive CD4+ cells was routinely greater than 95%, and they (105 cells/ml) were mixed with irradiated (3000 radians) C57BL/6 feeder splenocytes at a ratio of 1:6 and cultured in RPMI 1640 medium containing antibiotics, 1 mm l-glutamine, 50 μm β-mercaptoethanol, 10% fetal bovine serum, and soluble anti-CD3ϵ mAb (clone 145–2C11, 2 μg/ml). For Th1 polarization, 10 ng/ml rmIL-12 and 10 μg/ml anti-IL-4 mAb (clone 11B11) were added to the culture, whereas for Th2 polarization, 1000 units/ml rmIL-4 and 10 μg/ml of both anti-IL-12 mAb (clone C15.6) and anti-IFN-γ mAb (clone XMG1.2) were added. Two days after the initiation of culture, cells were supplemented with 50 units/ml rmIL-2 daily until used between day 5 and 7. At that time, Th1 and Th2 cells were washed and stimulated overnight with 5 nm PMA and 500 ng/ml ionomycin; the supernatants were then collected for cytokine analyze. Cytokines used in this experiment were from R&D Systems, and mAbs were from BD Biosciences (Mississauga, ON, Canada). The level of IFN-γ and IL-4 in the culture supernatants was measured by enzyme-linked immunosorbent assay in triplicate, using mouse IFN-γ and IL-4 DuoSet (all from R&D Systems).
Assay for Delayed Type Hypersensitivity
Mice were first sensitized by painting their shaved abdominal skin with fluorescein isothiocyanate. After 6 days, ear thickness was measured, and then the ears were painted with fluorescein isothiocyanate. Ear thickness was again measured after 24 h, and any increases were registered. This method has been described elsewhere (16).
Immunobloting
Spleen T cells were isolated with a mouse T cell enrichment kit (StemCell Technologies, Vancouver, BC, Canada) and stimulated with PMA (5 nm) and ionomycin (1 μg/ml) at 37 °C for various time periods. Cytosolic and nuclear extracts of these cells were prepared with the NE-PER nuclear and cytoplasmic extraction kit (Pierce Biotechnology) according to the manufacturer's instructions. In some experiments, the T cells were reacted to biotinylated anti-CD3 (clone 2C11) and anti-CD4 (clone L3T4) for 60 min on ice and cross-linked with streptavidin (10 μg/200 μl) at 37 °C for 0–5 min. Various proteins were detected by immunoblotting according to our previous publications (15). The following Abs were used in immunoblotting: rabbit Abs against RelB, NFAT, and Ran and mouse mAb (clone B-6) against c-Rel (Santa Cruz Biotechnology, Santa Cruz, CA); rabbit Abs against c-Jun, c-Fos, histone H3, NF-κB RelA/p65, NF-κB p50, p-Lck, total Lck, p-ZAP-70, total ZAP-70, β-actin, and mAb against α-tubulin (Cell Signaling, Beverly, MA).
Electrophoresis Mobility Shift Assay (EMSA)
Nuclear protein (5 μg) was incubated on ice with biotinylated double-stranded oligonucleotides. The sequences of the oligonucleotides used for AP-1 were 5′-CTAGTGATGAGTCAGCCGGATC-3′ and 3′-GATGACTACTCAGTCGGCCTAG-5′, and for NFAT, the sequences were 5′-AAGAGGAAAATTTGTTTCATACAGAAGGCG-3′ and 3′-TTCTCCTTTTAAACAAAGTATGTCTTCCGCTTAA-5′ (Integrated DNA Technologies, San Diego, CA). One hundredfold molar excess of unlabeled double-stranded oligonucleotides was added to some samples to determine the binding specificity. The reaction mixture was resolved on a 5% nondenaturing polyacrylamide gel with 0.5× Tris acetate and EDTA as electrophoresis buffer. The oligonucleotides were transferred to Hybond-N+ nylon membranes (Amersham Biosciences, Oakville, ON, Canada) and cross-linked at 120 mJ/cm2 using a UV cross-linker for 12 min. The signals were detected with the LightShift chemiluminescent EMSA kit (Pierce Biotechnology).
RESULTS
Ran Expression during Ontogeny and Lymphocyte Activation
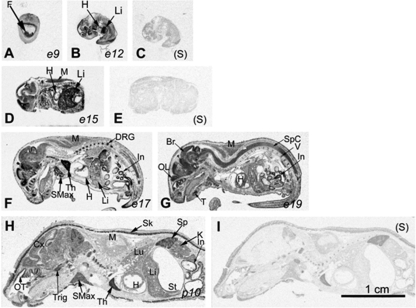
Although the mapping of Ran expression by ISH during early mouse embryo development before embryonic day 11.5 (e11.5) was reported by Lopez-Casas et al. (16), we conducted the first comprehensive mapping of Ran expression on e9, e12, e15, e17, e19, parturition day 10 (p10), and in adulthood using ISH. Ran mRNA signal was detectable in various tissues from e9 (Fig. 1) to p10. Ran mRNA was abundant in the central nervous system, showing pan-neuronal expression from its most rostrally located olfactory lobe (OL) to the caudal tip of the spinal cord (SpC) (Fig. 1G). The cerebral cortex (Cx) (Fig. 1H) and olfactory neuroepithelium in the olfactory turbinates (OT) (Fig. 1H) were both labeled. In the peripheral nervous system, the trigeminal ganglion (Trig) (Fig. 1H) and the dorsal root ganglion (DRG) (Fig. 1F) displayed strong hybridization signals.
FIGURE 1.
Ran expression during ontogeny according to in situ hybridization. X-ray autoradiography (bright field) of Ran in situ hybridization in mice from e9 to p10, as indicated, is shown in panels A, B, D, F, G, and H. Hybridization with the sense probe (S) is presented as controls in panels C, E, and I. The abbreviations are as follows: Br, brain; Cx, cerebral cortex; DRG, dorsal root ganglion; F, fetus; H, heart; In, intestines; K, kidney; Li, liver; Lu, lung; M, muscles; OL, olfactory lobe; OT, olfactory turbinates; T, teeth; Th, thymus; Sk, skin; SMax, submaxillary gland; Sp, spleen; Spc, spinal cord; St, stomach; Trig, trigeminal ganglion; V, vertebrae. Bar = 1 cm.
In the digestive system, high Ran mRNA levels were noted in the developing liver (Li), especially during mid-gestation on e12 and e15 (Fig. 1, B and D). This level declined throughout the prenatal and postnatal stages (Fig. 1, F and H) to adult levels, which remained low (Fig. 1H). Signals were detected in emerging teeth (T) on e19 (Fig. 1G). The submaxillary gland (SMax) emitted moderately high signals (Fig. 1, F and H).
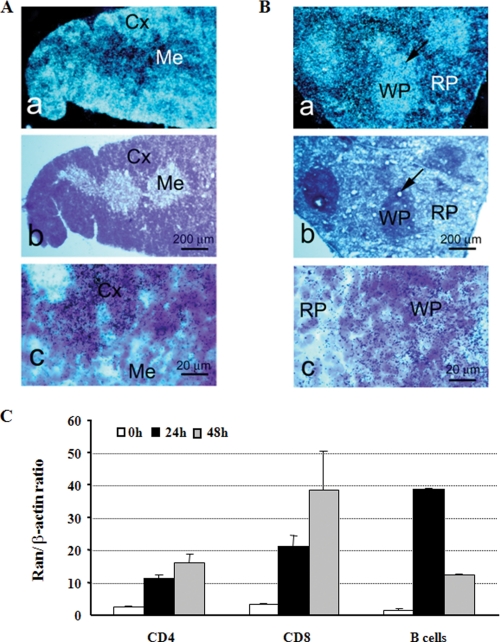
In the cardiovascular and respiratory systems, moderate Ran signals were detected in the embryonic and neonatal hearts (H) (Fig. 1, D–H). In the immune system, very strong Ran signals were detected in the e17 thymus (Fig. 1F); on p10, the thymus and spleen were positive under ISH. In the thymus, the cortex (Cx) but not the medulla (Me) was highly positive (Fig. 2A); in the spleen, Ran signals were concentrated in the white pulp (WP) but not in the red pulp (RP) (Fig. 2B).
FIGURE 2.
Ran expression in lymphoid organs and cells. A and B, in situ hybridization of the thymus and spleen with antisense Ran probes. Panel a, dark field x-ray autoradiography; panel b, consecutive sections stained by hematoxylin; panel c, bright field emulsion autoradiography with hematoxylin counter staining. Cx, cortex; Me, medulla; WP, white pulp (indicated by arrows); RP, red pulp. C, real-time RT-PCR of Ran expression in lymphocytes. CD4 and CD8 cells were stimulated by solid phase anti-CD3 (0.57 μg/ml; concentration for coating the wells) plus anti-CD28 (2.86 μg/ml; concentration for coating the wells). B cells were stimulated by soluble anti-CD40 (0.1 μg/ml) plus IL-4 (10 ng/ml). The cells were harvested at 24 and 48 h, and total RNA was extracted for real-time RT-PCR, which was carried out in triplicate. Means ± S.D. of Ran versus β-actin signal ratios are shown. Data are representative of three similar experiments.
Ran expression during lymphocyte activation was investigated by real-time RT-PCR (Fig. 2C). CD4+ and CD8+ T cells were stimulated with solid phase anti-CD3 plus anti-CD28, and the cells were harvested at 24 and 48 h later. Ran mRNA was significantly induced, with signals higher in 48 h than in 24 h. B cells were stimulated with anti-CD40 plus IL-4. Ran expression in B cells was drastically augmented, with the peak at 24 h.
Generation of Ran Tg Mice
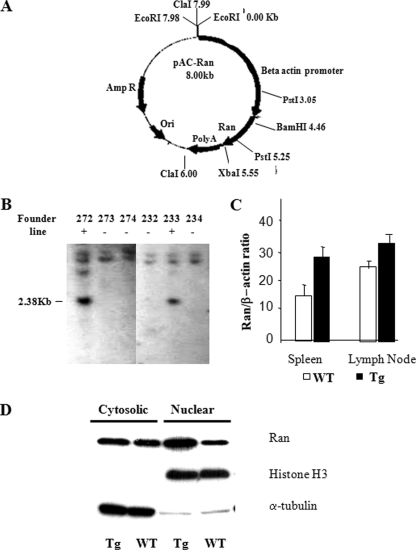
To understand the function of Ran, Tg mice expressing human β-actin promoter-driven Ran were generated. The plasmid construct for Tg mice generation is illustrated in Fig. 3A. Two Tg founders were identified by Southern blot analysis, which showed 2.38-kb bands specific to Tg mice (Fig. 3B, lines 272 and 233). Increased Ran transcripts in the spleen cells of line 272 were confirmed by real-time RT-PCR (Fig. 3C). Similar data were obtained from line 233 (data not presented). It is to be noted that although Ran is mainly present in the nucleus in COS cells (2), in WT T cells, more than 50% of Ran existed in the cytosol (Fig. 3D). In Tg T cells, there was a significant increase of Ran protein in the nuclear fraction according to immunoblotting.
FIGURE 3.
Generation and characterization of Ran Tg mice. A, pAC-Ran construct for Ran Tg mice generation. The 4.9Kb ClaI/ClaI fragment was used for microinjection. B, Southern blot genotyping of Ran founder tail DNA. The 2.38-kb band specific to the Ran transgene is indicated. C, real-time RT-PCR of Ran mRNA from spleen and lymph node cells. Mean ± S.D. of ratios of Ran versus β-actin signals are shown. Samples are in triplicate. D, Ran overexpression in Tg T cells according to immunoblotting. Cytosolic and nuclear proteins were fractionated from Tg and WT T cells and were analyzed for Ran protein expression using immunoblotting (20 μg/lane). The cytosolic and nuclear protein purity was verified by α-tubulin and histone H3 levels.
Lines 272 and 233 were expanded for detailed study. The mice were fertile and manifested no gross anomalies upon visual inspection except for their spleen size. Both of the lines had a similar phenotype. Therefore, in most of the cases, representative data from line 272 are shown.
Compromised in Vitro T Cell Responses in Ran Transgenic Mice
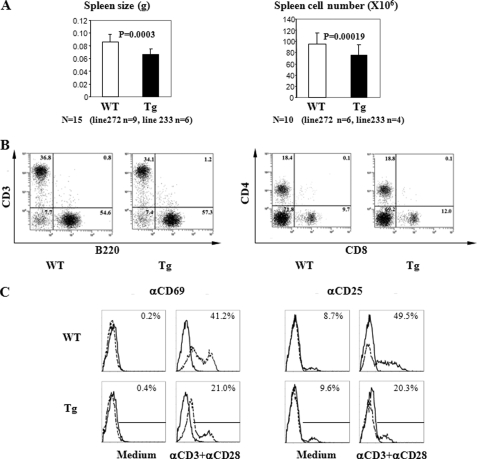
Spleen size and cellularity (Fig. 4A) were moderately but consistently reduced in Ran Tg mice, although thymus size and cellularity remained unchanged (data not illustrated), in comparison with their wild type littermates. T versus B cell and CD4 versus CD8 cell ratios in the spleen of Tg mice were comparable with those of the WT controls (Fig. 4B). This suggests that the reduced spleen size and cellularity are due to reduction of all cell populations rather than selected ones. Tg T cells showed diminished induction of CD69 and CD25 after activation by solid phase anti-CD3 and anti-CD28 when compared with WT T cells (Fig. 4C).
FIGURE 4.
Spleen size and cellularity as well as spleen cell subpopulation and expression of their activation marker in Ran Tg mice. A, reduced spleen weight and cellularity in Ran Tg mice. Fifteen pairs of Tg mice and their WT littermates (nine pairs from line 272 and six pairs from line 233) were compared for their spleen weight, and 10 pairs (six pairs from line 272 and four pairs from line 233) were compared for their spleen cellularity. The difference was highly significant (p < 0.001, paired Student's t test) for both parameters. Error bars indicate ± S.D. B, spleen cell subpopulations of Ran Tg mice. The T cell (CD3+) and B cell (B220+) populations and CD4+ and CD8+ T cell populations in the spleens of Ran Tg mice (line 272) and their WT littermates were analyzed by two-color flow cytometry. The percentages are indicated in the histogram. C, C69 and CD25 expression on activated Ran Tg T cells. Ran Tg or WT T cells were stimulated overnight by solid phase anti-CD3 (4 μg/ml, concentration used during coating). The CD69+ or CD25+ expression on gated T cells (Thy1.2+) was measured by two-color flow cytometry (CD69/Thy1.2 and CD25/Thy1.2). The experiments described in panels B and C were repeated more than three times, and representative data are shown.
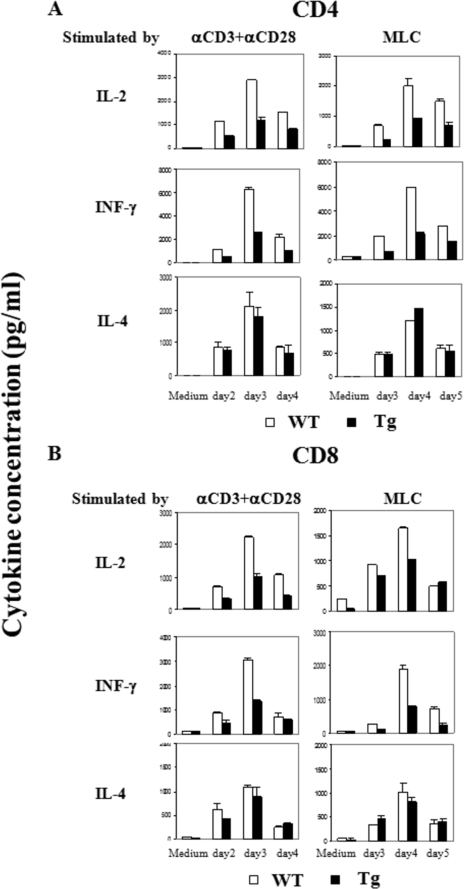
We next examined the cytokine production of Tg T cells (Fig. 5). When compared with WT cells, both CD4 (Fig. 5A) and CD8 (Fig. 5B) Tg T cells showed reduced secretion of IL-2 and IFN-γ upon stimulation by solid phase anti-CD3 plus anti-CD28 or mitomycin-C-treated allogeneic BALB/c spleen cells. On the other hand, IL-4 secretion by anti-CD3- plus anti-CD28-stimulated Tg CD4 or CD8 cells was comparable with that of WT cells.
FIGURE 5.
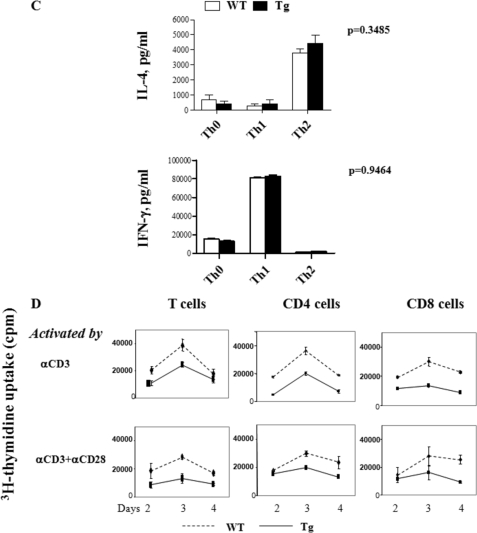
Lymphokine production and proliferation of Ran Tg T cell. A and B, lymphokine secretion by CD4 and CD8 cells. Spleen CD4 (panel A) or CD8 (panel B) T cells from Ran Tg mice or WT littermates were stimulated by the following reagents or cells: solid phase anti-CD3 (0.57 μg/ml) plus anti-CD28 (2.86 μg/ml) (concentrations used during plate coating); mitomycin C-treated allogeneic BALB/c spleen cells in mixed lymphocyte culture (MLC); no stimulation (Medium). Supernatants were harvested on the days as indicated and assayed in duplicate for lymphokines by enzyme-linked immunosorbent assay. C, cytokine secretion by Th1 and Th2 cells. Naive CD4 cells (Th0) were driven into Th1 and Th2 cells under their respective culture conditions. The cells were stimulated overnight with 5 nm PMA and 500 ng/ml ionomycin, and the supernatants were then collected for cytokine analysis. D, proliferation of Ran Tg and WT total T cells, CD4 cells, or CD8 cells. The cells were stimulated by solid phase anti-CD3 (4 μg/ml) (concentration used during plate coating) or solid phase anti-CD3 (0.57 μg/ml) plus anti-CD28 (2.86 μg/ml). The cells were pulsed for 16 h with [3H]thymidine before harvest, and their [3H]thymidine uptake was measured on days 2, 3, and 4. The experiments were repeated more than three times, and representative data with means ± S.D. are shown.
The observed decrease of IFN-γ but not IL-4 production in anti-CD3- and anti-CD28-stimulated Tg T cells prompted us to assess whether there was a preferential blockage of Th1 but not Th2 cell differentiation of Ran Tg T cells in vitro. Naive WT and Tg T cells were cultured under Th1 or Th2 differentiation conditions, and after 5–7 days, their cytokine secretion was determined. As shown in Fig. 5C, Tg and WT T cells had comparable IFN-γ and IL-4 production at the Th0 stage (naive T cells cultured in the IL-2 without being driven to Th1 or Th2) and at the Th1 and Th2 stages, indicating that there was no abnormality in Tg T cells in their ability to differentiate into Th1 or Th2 cells in vitro. The compromised IFN-γ secretion seen in Tg T cells immediately upon stimulation by anti-CD3 and plus anti-CD28 Abs may reflect defects under that condition that are not mimicked by the in vitro Th1 differentiation environment.
T cell proliferation was assessed subsequently. We purified spleen T cells, CD4 cells, and CD8 cells and subjected them to stimulation by solid phase anti-CD3 or solid phase anti-CD3 plus anti-CD28. It is to be noted that we used a higher anti-CD3 mAb concentration in stimulation with anti-CD3 alone than with anti-CD3 plus anti-CD28; consequently, in the control WT T cells, the former stimulation yielded a stronger proliferation than the latter. Tg cells showed a reduced response to these stimulations in comparison with their WT counterparts (Fig. 5D).
Compromised in Vivo T Cell-mediated Immune Response in Ran Transgenic Mice
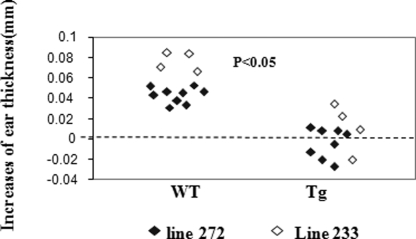
So far, there have not been any in vivo studies of Ran function. Using Ran Tg mice, we investigated the role of this molecule in T cell immune responses. As seen in Fig. 6, Tg mice had significantly reduced delayed type hypersensitivity (p < 0.01), which is a T cell-mediated Th1 type immune response. This is consistent with the in vitro finding that the Th1-type cytokine IFN-γ secretion and proliferation of Tg T cells were decreased.
FIGURE 6.
Reduced delayed type hypersensitivity against fluorescein isothiocyanate in vivo in Ran Tg mice. Delayed type hypersensitivity of Ran Tg mice (total n = 11; n = 8 for line 272, and n = 4 for line 233) and their WT littermates (total n = 13; n = 9 for line 272, and n = 4 for line 233) was determined by measuring ear thickness before and 24 h after ear painting. The increase in ear thickness of each mouse is presented. The difference between the two groups is statistically significant (p < 0.05, two-tailed Student's t test).
Compromised AP1 Nuclear Accumulation in Ran Tg T Cells
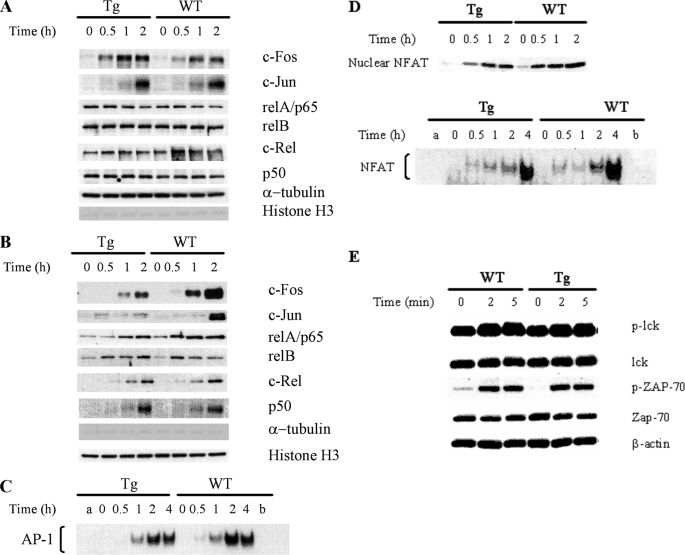
The compromised T cell proliferation and lymphokine secretion upon TCR stimulation are likely the result of an abnormal T cell activation program, for which multiple transcription factors are involved. Proper levels of nuclear transcription factors are essential for T cell lymphokine secretion and proliferation, and the levels are determined by dynamic equilibrium of import, degradation, and export of these factors in the nuclei. We assessed whether the nuclear levels of certain transcription factors were affected by Ran overexpression. Nuclear and cytosolic proteins from WT or Tg spleen T cells were fractionated with an NE-PER nuclear and cytoplasmic extraction kit from Pierce Biotechnology. The purity of the cytoplasmic and nuclear fraction was verified with anti-α-tubulin and anti-histone H3 immunoblotting, respectively. As shown in Fig. 7, A and B, in the last two rows, there was no gross cross-contamination of nuclear proteins in the cytoplasmic protein fraction and vice versa, according to their α-tubulin and histone H3 contents. In Tg and WT T cells, the cytosolic protein levels of c-Fos, c-Jun, and members of NF-κB family RelA/p65, RelB, c-Rel, and p50 remained unchanged after PMA and ionomycin stimulation (Fig. 7A), as expected. In the WT T cell nuclear fraction, within 1–2 h after such stimulation, the levels of these transcription factors were apparently increased; however, in Tg T cells, the increase of nuclear c-Fos and c-Jun was significantly dampened when compared with that of WT cells, whereas WT and Tg T cell nuclei seemed to present similar levels of increases of NF-κB family members (Fig. 7B). The reduced c-Jun and c-Fos nuclear levels in Tg T cells when compared with WT T cells were confirmed by AP-1 electrophoresis mobility shift (Fig. 7C). We also examined nuclear NFAT after T cell activation. As shown in Fig. 7D, there was only moderately dampened increase of nuclear NFAT in Tg T cells, using WT T cells as control, according to immunoblotting and EMSA. These results clearly indicate that Ran expression is critical in controlling a subset of transcription factor nuclear levels; a higher intracellular Ran level is protagonist to AP-1 nuclear accumulation.
FIGURE 7.
AP-1 and NF-κB protein nuclear import in T cells according to immunoblotting and EMSA. WT and Tg spleen T cells were stimulated with PMA (5 nm) and ionomycin PMA (1 μg/ml) at 37 °C for various time periods as indicated. Cytosolic and nuclear proteins were then extracted from the cells. The nuclear and cytosolic fractions were resolved in 10% SDS gels and analyzed by immunoblotting using Abs against AP-1 and NF-κB members. α-Tubulin and histone H3 levels were used to monitor the cross-contamination of cytosolic proteins in the nuclear fraction and vice versa. The nuclear fractions were also employed in AP-1 EMSA. The experiments were performed at least twice, and representative results are shown. A, protein levels of AP-1 and NF-κB members in the cytosol of Tg and WT T cells remain constant during PMA and ionomycin stimulation according to immunoblotting. B, compromised AP-1 but not NF-κB members nuclear import in Tg T cells upon PMA and ionomycin stimulation according to immunoblotting. C, compromised AP-1 nuclear import in Tg T cells upon PMA and ionomycin stimulation according to EMSA. Nuclear protein extracted from PMA plus ionomycin-stimulated WT and Tg T cells were employed in AP-1 EMSA. Lane a is a control with no nuclear protein added. Competition was performed by incubating extracts with a 100-fold molar excess of unlabeled oligonucleotide before the addition of labeled probe (lane b). Data are representative of at least three independent experiments. D, moderately compromised NFAT nuclear import in Tg T cells. Nuclear protein extracted from PMA plus ionomycin-stimulated WT and Tg T cells were employed in NFAT EMSA. Lane a is a control with no nuclear protein added. Competition was performed by incubating extracts with a 100-fold molar excess of unlabeled oligonucleotide before the addition of labeled probe (lane b). Data are representative of at least three independent experiments. E, normal early TCR signaling in Ran Tg T cells. Ran Tg CD4 T cells were cross-linked by anti-CD3 and anti-CD4 for 0–5 min, and their Lck and ZAP-70 phosphorylation (indicated by p-Lck and p-ZAP-70) in total cell lysates was assessed by immunoblotting. Total Lck, ZAP-70, and β-actin were used to ascertain even protein loading.
As a significant portion of Ran is also present in the T cell cytosol, we investigated whether very early TCR signaling in the cytosol is affected in Tg T cells. We cross-linked CD4 T cells with anti-CD3 and anti-CD4 Abs and examined their Lck and ZAP-70 phosphorylation. As shown in Fig. 7E, Lck and ZAP-70 phosphorylation in WT and Tg T cells was similar, indicating that these very early TCR signaling events in the cytosol are normal in Tg T cells.
DISCUSSION
In this study, we undertook the first comprehensive mapping of Ran expression during mouse ontogeny. The ubiquitous Ran expression in the early gestation stages suggests critical roles of Ran in embryonic development. Ran is involved in DNA replication and cell cycle progression. It is, therefore, not surprising to find its high expression in cells or regions of organs that have vigorous proliferation capability, such as the thymus cortex (Fig. 1), the gastric epithelium, the germinal centers of the hair follicles, and spermatogonia (data not shown). However, certain tissues, such as the cerebral cortex, the olfactory neuroepithelium, the trigeminal ganglion, and the dorsal root ganglion, do not contain fast growing cells, yet they have high levels of Ran transcripts, indicating that the function of Ran is not restricted to proliferation.
High Ran mRNA expression of in the thymus and spleen prompted us to conduct an in-depth investigation on its role in T cells. We found that the activation marker expression, lymphokine production, and proliferation after TCR ligation or TCR plus anti-CD28 ligation were compromised in vitro in Ran Tg T cells. We also found that when compared with WT mice, Ran Tg mice presented dampened in vivo delayed type hypersensitivity reaction, which is a T cell-mediated process. On the other hand, the proliferation of Ran Tg B cells stimulated by lipopolysaccharide was not significantly different from that of WT B cells (data not shown); Tg and WT mice had comparable levels of different serum Ig isotypes (data now shown), probably a reflection of lower Tg Ran overexpression in B cells (data not shown).
During T cell activation, transcription factors need to be accumulated to certain high levels in the nuclei to initiate the activation program. We selected a group of well studied transcription factors, i.e. AP-1 proteins and NF-κB members, to assess the effect of Ran on their nuclear levels, which depend on dynamic equilibrium between their nuclear import, degradation, and in some cases, their export from the nuclei (17). For all these proteins examined, Ran overexpression did not affect their cytoplasmic levels, suggesting that their synthesis and degradation in the cytosol are not influenced by Ran overexpression. However, certain (e.g. AP-1), but not all, transcription factor levels in the nuclei were affected by Ran overexpression. AP-1 is composed of c-Jun and c-Fos heterodimers and is essential in the TCR signaling pathway, lymphokine production, and lymphokine receptor signaling (18–21). Its nuclear level in Ran-overexpressing Tg T cells shortly after T cell activation (within 1 h) failed to increase to a level comparable with that of WT T cells. c-Jun and c-Fos nuclear import depends on several importins and transportins (22, 23). Undimerized c-Fos can also be shuttled back to cytosol from the nuclei independent of Crm-1 exportin (17). Ran has been well documented for its role in protein nuclear import (9). Thus, it is conceivable that Ran overexpression interferes with proper c-Jun and c-Fos import, and this contributes to compromised AP-1 retention in the nuclei. Whether Ran overexpression also causes increased c-Fos and c-Jun export leading to lower AP-1 accumulation in the nuclei remains an open question.
We propose the following model for the function of Ran in T cells related to AP-1 nuclear accumulation. In resting WT T cells at the peri-activation stage, there is a low Ran level, which facilitates AP-1 nuclear accumulation in the nuclei and allows AP-1 to perform its function in the nuclei in the early stage of the T cell activation program. Ran expression is up-regulated 24–48 h after TCR activation. At that time, most needs for AP-1 have been fulfilled; the Ran up-regulation at that time serves to reduce AP-1 nuclear levels, with a purpose to terminate the T cell activation program. Following the peak AP-1 accumulation at 48 h, T cell cytokine production and proliferation all start to decline. In Tg T cells, the forced Ran overexpression in resting T cells prevented the increase of AP-1 nuclear levels at the beginning of the activation program, and as a consequence, T cell lymphokine secretion, proliferation, and in vivo function were compromised.
Another interesting discovery is that although Ran is known to be essential in nuclear protein accumulation, it does not seem to act in that capacity universally for all proteins. The mechanism of such differential regulation certainly is worth further investigation. On the other hand, we would also like to mention that AP-1 members are probably not the only transcription factors whose nuclear import is regulated by Ran. We did not conduct an exhaustive survey of all the transcription factors involved in T cell activation, but we noticed that there was a moderately dampened increase of NFAT (Fig. 7D) and STAT-4 (data not shown) levels in nuclei of T cells after TCR activation. Obviously, as Ran regulates multiple important cellular functions as summarized in the Introduction, what we identified here in terms of compromised AP-1 nuclear retention is probably but one of the multifaceted impacts of Ran on T cell activation.
Acknowledgments
We thank Ovid Da Silva for editorial assistance and Dr. Martin Marcinkiewicz for in situ hybridization analysis.
This work was supported by grants from the Canadian Institutes of Health Research (Grants MOP57697, MOP69089, and PPP86159 to J. W. and Grants IMH-79565 and MOP97829 to H. L.), the Kidney Foundation of Canada, the Heart and Stroke Foundation of Quebec, and the J.-Louis Levesque Foundation (to J. W.). It was also supported by a group grant from Fonds de la recherche en santé du Québec for Transfusional and Hemovigilance Medical Research.
- Ran
- Ras-related nuclear protein
- Tg
- transgenic
- TCR
- T cell receptor
- Th
- T helper cells
- WT
- wild type
- RT-PCR
- reverse transcription-PCR
- EMSA
- electrophoretic mobility shift assay
- IFN
- interferon
- ISH
- in situ hybridization
- IL
- interleukin
- rmIL
- recombinant mouse IL
- Ab
- antibody
- mAb
- monoclonal antibody
- PMA
- phorbol 12-myristate 13-acetate
- NFAT
- nuclear factor of activated T-cells
- e
- embryonic day
- p
- parturition day.
REFERENCES
- 1.Drivas G. T., Shih A., Coutavas E., Rush M. G., D'Eustachio P. (1990) Mol. Cell. Biol. 10, 1793–1798 [DOI] [PMC free article] [PubMed] [Google Scholar]
- 2.Ren M., Drivas G., D'Eustachio P., Rush M. G. (1993) J. Cell Biol. 120, 313–323 [DOI] [PMC free article] [PubMed] [Google Scholar]
- 3.Belhumeur P., Lee A., Tam R., DiPaolo T., Fortin N., Clark M. W. (1993) Mol. Cell. Biol. 13, 2152–2161 [DOI] [PMC free article] [PubMed] [Google Scholar]
- 4.Bischoff F. R., Ponstingl H. (1991) Nature 354, 80–82 [DOI] [PubMed] [Google Scholar]
- 5.Matsumoto T., Beach D. (1993) Mol. Biol. Cell. 4, 337–345 [DOI] [PMC free article] [PubMed] [Google Scholar]
- 6.Sazer S., Nurse P. (1994) EMBO J. 13, 606–615 [DOI] [PMC free article] [PubMed] [Google Scholar]
- 7.Matsumoto T., Beach D. (1991) Cell 66, 347–360 [DOI] [PubMed] [Google Scholar]
- 8.Kadowaki T., Goldfarb D., Spitz L. M., Tartakoff A. M., Ohno M. (1993) EMBO J. 12, 2929–2937 [DOI] [PMC free article] [PubMed] [Google Scholar]
- 9.Moore M. S., Blobel G. (1993) Nature 365, 661–663 [DOI] [PubMed] [Google Scholar]
- 10.Drivas G., Massey R., Chang H. Y., Rush M. G., D'Eustachio P. (1991) Mamm. Genome 1, 112–117 [DOI] [PubMed] [Google Scholar]
- 11.Coutavas E. E., Hsieh C. M., Ren M., Drivas G. T., Rush M. G., D'Eustachio P. D. (1994) Mamm. Genome 5, 623–628 [DOI] [PubMed] [Google Scholar]
- 12.Nieland J. D., Haks M. C., Kremers B. L., Leupers T. J., Bakker A. Q., Offringa R., Kruisbeek A. M. (1998) Cancer Gene Ther. 5, 259–273 [PubMed] [Google Scholar]
- 13.Sekimoto T., Nakajima K., Tachibana T., Hirano T., Yoneda Y. (1996) J. Biol. Chem. 271, 31017–31020 [DOI] [PubMed] [Google Scholar]
- 14.Marcinkiewicz M. (2002) J. Neuropathol. Exp. Neurol. 61, 815–829 [DOI] [PubMed] [Google Scholar]
- 15.Luo H., Yu G., Tremblay J., Wu J. (2004) J. Clin. Invest. 114, 1762–1773 [DOI] [PMC free article] [PubMed] [Google Scholar]
- 16.López-Casas P. P., López-Fernández L. A., Krimer D. B., del Mazo J. (2002) Mech. Dev. 113, 103–106 [DOI] [PubMed] [Google Scholar]
- 17.Malnou C. E., Salem T., Brockly F., Wodrich H., Piechaczyk M., Jariel-Encontre I. (2007) J. Biol. Chem. 282, 31046–31059 [DOI] [PubMed] [Google Scholar]
- 18.Chen C. Y., Del Gatto-Konczak F., Wu Z., Karin M. (1998) Science 280, 1945–1949 [DOI] [PubMed] [Google Scholar]
- 19.Lederer J. A., Liou J. S., Todd M. D., Glimcher L. H., Lichtman A. H. (1994) J. Immunol. 152, 77–86 [PubMed] [Google Scholar]
- 20.Mondino A., Whaley C. D., DeSilva D. R., Li W., Jenkins M. K., Mueller D. L. (1996) J. Immunol. 157, 2048–2057 [PubMed] [Google Scholar]
- 21.Marusina A. I., Burgess S. J., Pathmanathan I., Borrego F., Coligan J. E. (2008) J. Immunol. 180, 409–417 [DOI] [PubMed] [Google Scholar]
- 22.Waldmann I., Wälde S., Kehlenbach R. H. (2007) J. Biol. Chem. 282, 27685–27692 [DOI] [PubMed] [Google Scholar]
- 23.Arnold M, Nath A., Wohlwend D., Kehlenbach R. H. (2006) J. Biol. Chem. 281, 5492–5499 [DOI] [PubMed] [Google Scholar]


