

Abstract
CcdBVfi from Vibrio fischeri is a member of the CcdB family of toxins that poison covalent gyrase-DNA complexes. In solution CcdBVfi is a dimer that unfolds to the corresponding monomeric components in a two-state fashion. In the unfolded state, the monomer retains a partial secondary structure. This observation correlates well with the crystal and NMR structures of the protein, which show a dimer with a hydrophobic core crossing the dimer interface. In contrast to its F plasmid homologue, CcdBVfi possesses a rigid dimer interface, and the apparent relative rotations of the two subunits are due to structural plasticity of the monomer. CcdBVfi shows a number of non-conservative substitutions compared with the F plasmid protein in both the CcdA and the gyrase binding sites. Although variation in the CcdA interaction site likely determines toxin-antitoxin specificity, substitutions in the gyrase-interacting region may have more profound functional implications.
Keywords: Biophysics, Protein/Conformation, Protein/Stability, Protein/Structure, Gyrase Poison, Toxin-Antitoxin
Introduction
Toxin-antitoxin (TA)6 modules are a class of operons that are abundant on the chromosomes of bacteria and archaea (1–3). They were originally discovered on low copy number plasmids and bacteriophages (4), where they are believed to act as addiction systems. The role of chromosome-encoded TA modules, however, is heavily debated. A whole series of functions has been proposed (5) ranging from DNA parasites over stabilization of chromosomal regions to regulators of metabolism response, mediators of persister cell formation, and altruistic suicide modules. Although each potential function has its drawbacks, regulation of metabolism during periods of nutritional stress is the most widely accepted hypothesis. This results from the observations that TA modules are activated during stress response (6), that this activation at least under some circumstances is reversible (7), and that after induction metabolic activity within the cells can still be observed (8). The latter property has been exploited to design a single protein production system in Escherichia coli (8). Recent data suggest that at least one family of TA modules may be under quorum sensing control (9) and that a lone MazF TA toxin mediates programmed cell death during multicellular fruiting body development of Myxococcus xanthus (10).
The F plasmid ccd operon is the oldest known TA module, encoding the toxin CcdBF and the antitoxin CcdAF. It was originally discovered as an operon that couples plasmid replication to cell division. Later it was shown that its action can be described as a plasmid addiction system that relies on the difference in lifetime of CcdAF and CcdBF. As long as the F plasmid is present in the cell, both proteins are present in low amounts. They form a complex, preventing CcdBF to exert its toxic action. This complex acts as a repressor for the ccd operon (11). CcdAF is under constant degradation by the Lon protease (12), but when the CcdAF pool becomes too small, this activates transcription from the ccd operon, leading to the establishment of a dynamic equilibrium.
This situation changes dramatically when the plasmid is lost, e.g. after cell division. The diminishing CcdAF pool can no longer be replenished. This leads after a short time to the accumulation of free CcdBF that then can attack its target. The target of CcdBF is gyrase (13). If CcdBF binds gyrase when it is covalently attached to a double strand DNA segment, the ternary complex leads to an inhibition of transcription and to the accumulation of breaks in the chromosomal DNA (14). This induces the SOS response and ultimately leads to cell death. The ternary complex can, however, be dissociated by CcdAF in a process termed the rejuvenation (15, 16). Transcription regulation and the rejuvenation action of CcdAF are mechanistically intertwined and fundamentally depend on the intrinsically disordered nature of the CcdAF C-terminal domain (17).
Although F plasmid-encoded CcdBF has been studied in detail both in vivo and in vitro, very little information is available on the proteins of chromosome-encoded ccd modules. The biological functions of plasmid- and chromosome-encoded TA proteins are believed to be different, and thus they may have developed distinct structural or biophysical properties. The chromosome from the marine bacterium Vibrio fischeri contains such a ccd module. The V. fischeri ccd module has not been characterized in terms of its in vivo activities, but it is expected that CcdBVfi will be a gyrase poison, because it was demonstrated to form a complex with GyrA14, a fragment of GyrA that also contains the binding site for F plasmid CcdBF (18). Here we provide basic information on the structure and the thermodynamics of unfolding of CcdBVfi.
EXPERIMENTAL PROCEDURES
Crystal Structure Determination
The expression, purification, crystallization, and x-ray data collection of two crystal forms of CcdBVfi have been described (18). The structure of CcdBVfi form I (pH 7.0, 1.5-Å resolution, space group I213) was determined by molecular replacement with PHASER (19) using the coordinates of F plasmid CcdBF (monomer A from pdb entry 1vub (20)) as the search model. For the CcdBVfi form II crystals (pH 5.6, 1.7-Å resolution, space group C2) the search model for molecular replacement was the refined coordinates of the CcdBVfi form I monomer. Refinement was carried out with REFMAC5 (21) from the CCP4 program suite (22) and phenix.refine (23) from the PHENIX software suite (24). All model building was done using COOT (25). Refinement and data collection statistics are summarized in Table 1.
TABLE 1.
X-ray data collection and refinement statistics
Numbers in parentheses refer to the high resolution shell.
| Form I, pH 7.0 | Form II, pH 5.6 | |
|---|---|---|
| Data collection | ||
| Beamline | X11 (DESY) | X11 (DESY) |
| Wavelength (Å) | 0.8162 | 0.8162 |
| Unit cell parameters (Å, °) | a = b = c = 84.5 | a = 58.5, b = 43.6, c = 37.5, β = 110.0 |
| Space group | I213 | C2 |
| Resolution (Å) | 19.9-1.50 (1.55-1.50) | 19.9-1.70 (1.76-1.70) |
| Number of unique reflections | 16,225 (1,589) | 9,956 (986) |
| Rmerge | 0.047 (0.176) | 0.040 (0.237) |
| Completeness (%) | 100.0 (100.0) | 99.9 (100.0) |
| I/σ(I) | 34.2 (12.2) | 23.0 (8.0) |
| Redundancy | 18.9 | 6.3 |
| Data refinement | ||
| R-factors | ||
| Rcryst | 0.172 | 0.168 |
| Rfree | 0.202 | 0.199 |
| Overall B-factors (Å2) | ||
| From Wilson plot | 15.7 | 18.6 |
| All atoms | 17.7 | 18.8 |
| All protein atoms | 16.3 | 18.0 |
| Main-chain atoms | 14.6 | 16.2 |
| Side-chain atoms | 18.0 | 19.9 |
| Water atoms | 32.5 | 26.9 |
| Other | 17.3 | |
| Geometry | ||
| r.m.s. bond lengths (Å) | 0.009 | 0.011 |
| r.m.s bond angles (°) | 1.330 | 1.395 |
| Ramachandran profile | ||
| % core regions | 92.9 | 93.1 |
| % additionally allowed | 7.1 | 6.9 |
| % disallowed | 0 | 0 |
| Data deposition | ||
| PDB entry | 3jsc | 3jrz |
NMR Experiments
All NMR spectra (three-dimensional 13C- and 15N-edited nuclear Overhauser effect spectroscopy-HSQCs, two-dimensional relaxation-edited 15N-HSQCs for T1, T2, and 15N-NOEs) were acquired on a Varian Unity INOVA 600-MHz spectrometer using an HCN triple-resonance probe with z axis gradients at 298 K. Samples of 0.5 mm 15N,13C-labeled CcdBVfi dissolved in 50 mm phosphate buffer (pH 6.5), including 10% D2O and 0.02% sodium azide were used. To obtain 15N relaxation times, a series of 15N-HSQC experiments containing a saturation recovery (T1) or a spin-echo (T2) sequence on the heteronuclear channel was recorded. The relaxation delays were varied between 0.1 and 5 s or 10 and 250 ms for T1 and T2 determinations, respectively. A NOE buildup time of 3 s was used for the 15N-NOE experiment. All spectra were processed using nmrPipe (26) and analyzed with NMRViewJ (27). A rough solution structure model of a monomer of CcdBVfi was obtained using the program CS23D (28) based on our previously reported chemical shifts (29). This structure showed the same fold as the x-ray structures (backbone r.m.s.d. of the monomer 3.5 Å). NOEs were calculated for this preliminary model and agree well with unambiguous NOE peaks, which were assigned manually. Therefore, this model, together with the x-ray structure of dimeric CcdBVfi, was used to help separate intermolecular from intramolecular NOEs for the manual assignment. The NOE peak volumes were integrated with the program NMRViewJ and translated into distance restraints using the built-in median method. Additionally, ϕ and ψ dihedral angle restraints were obtained using the program TALOS (30). A total of 1682 NOEs and 114 dihedral angle restraints was used for each monomer resulting in a total of 3364 NOEs and 228 dihedral angle restraints for the full dimeric structure. The final structure calculation was carried out with the program CNS (31) using the full simulated annealing method.
Differential Scanning Calorimetry
Measurements
Samples were prepared in the following buffer solutions: sodium acetate (pH 4.0), sodium cacodylate (pH 6.1), sodium phosphate (pH 7.0, 8.0, and 11.0), sodium borate (pH 9.0), with 10 mm dithiothreitol added to each sample. Calorimetric scans were performed using a VP-DSC (MicroCal) high sensitivity differential scanning microcalorimeter with a 0.515-ml cell, except for the measurements at pH 4.0, which were performed using a Nano DSC Series III System (TA Instruments) with a capillary cell (0.3-ml cell volume). All samples were filtered and degassed for 10 min at 283 K prior to the experiment. Three different scanning rates (1.5, 1.0, and 0.5 K/min) were used to verify the scan rate independence of the unfolding process. The extent of repeatability of the thermally induced transitions was estimated as a ratio of model independent ΔHD,Tm values (see below) obtained from the second and the first heating scans of the same protein sample. The DSC thermograms are presented as ΔCp = C̄P,2 − C̄P,N versus temperature, T, curves (C̄P,2 = partial molar heat capacity of CcdBVfi obtained from the raw signal corrected for the buffer contribution and normalized per mole of CcdBVfi dimer contained in the measuring cell; C̄P,N = partial molar heat capacity of the native (N2 dimer) state extrapolated over the measured temperature range).
Model-independent Analysis
Heat capacity of denaturation, ΔCP,D, was determined as a difference in the pre- and post-transition baselines extrapolated to a reference temperature, which was for comparative purposes chosen as the melting temperature, Tm, obtained by model-dependent analysis of DSC data (see below). The enthalpy of denaturation at Tm, ΔHD,Tm, was calculated by integration of the area enclosed by the ΔCP versus T curve, the pre- and post-transition baselines and Tm.
Thermodynamic Profile of Unfolding
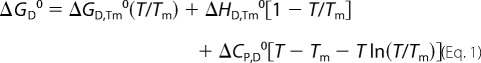
Assumptions that ΔCP,D is a temperature-independent quantity and that ΔHD,Tm and ΔCP,D are not functions of protein concentration and thus equal to their values in the standard state (ΔHD,Tm = ΔHD,Tm0 and ΔCP,D = ΔCP,D0) enables the calculation of standard Gibbs free energy of denaturation ΔGD0 as a function of T from the integrated Gibbs-Helmholtz equation (Equation 1).
 |
Because at pH > pI the observed unfolding transition can be considered an equilibrium process, one can express the standard Gibbs free energy of unfolding at Tm, ΔGD,Tm0, that corresponds to the N2 ↔ 2D reaction performed in the 1 m standard state as: ΔGD,Tm0 = −RTm ln(2CT), where CT represents the total molar concentration of the protein expressed in moles of dimers per liter. The standard enthalpy of unfolding, ΔHD0, and the corresponding entropy contribution, TΔSD0, as functions of temperature were calculated from Kirchhoff's law (integrated form),
and from the general relation in Equation 3.
Model-dependent Analysis
Thermal unfolding of CcdBVfi can be described in its simplest way in terms of a reversible two state process in which the protein molecule can exist either in a native dimeric N2 macro state or in a thermally denatured monomeric D macro state (N2 ↔ 2D). According to this model description one can express the partial molar enthalpy of the protein, H̄2, in terms of the corresponding contributions H̄N and H̄D that characterize species N2 and D as: H̄2 = H̄N + αD(2H̄D − H̄N), where αD represents a fraction of protein molecules in the denatured state. The relative partial molar enthalpy, ΔH, can be expressed as,
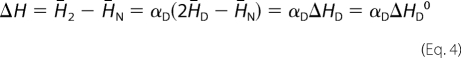 |
where ΔHD is defined as the enthalpy change accompanying the transition of 1 mol of the N2 into 2 mol of D. We considered ΔHD to be independent of concentration and thus equal to its value in the standard state (ΔHD = ΔHD0). The model function that describes the measured relative partial molar heat capacity of the protein, ΔCp, can be derived from the first partial derivative of Equation 4 with respect to T at constant pressure (32–35).
According to the N2 ↔ 2D model αD and (∂αD/∂T)P can at any temperature be expressed analytically in terms of the parameters ΔHD,Tm0, ΔCP,D0, and Tm (T at which αD = 0.5) by combination of Equations 1 and 2 and relation ΔGD0 = −RT ln[4CTαD2/(1 − αD)]. For this reason, the model-dependent values of ΔHD,Tm0, ΔCP,D0, and Tm can be obtained from fitting the model function (Equation 5) to the experimental DSC thermograms using the Levenberg-Marquardt non-linear χ2 regression procedure (36).
CD Measurements
Far-UV-CD spectra were recorded on a J-715 spectropolarimeter (Jasco). Scans were taken using a 0.1-cm cuvette. Spectra of CcdBVfi at different pH values were taken using a protein concentration of 0.3 mg/ml. All samples were preincubated at the selected temperature 10 min before taking the spectrum (20 °C for native and refolded spectra, and 85 °C for unfolded spectra). The mean residue ellipticities ([θ], degrees cm2 mol−1) were obtained from the raw data after correcting for the buffer solution, according to [θ] = θ·Mw/(N·c·l), where Mw is the molecular weight, c is the mass concentration, l is the optical path length, and N is the number of amino acid residues. The temperature of the cuvette was monitored using a probe, and a water bath was used for maintaining the temperature of the sample constant. The measurements were performed in the same buffer conditions as the DSC experiments.
Structure-based Calculation of Heat Capacity Changes
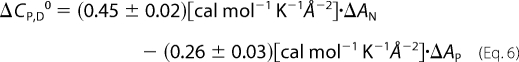
The non-polar, AN, and polar, AP, solvent-accessible surface areas of the native CcdBVfi were calculated with the program NACCESS (37). AN and AP of the native CcdBVfi were obtained from the crystal (average over both forms) and NMR (average over the 20 lowest energy models) structures of the dimer with a probe size of 1.4 Å. The unstructured residues were assumed to be exposed to solvent in the same way as they are in the extended Ala-X-Ala tripeptide (X = amino acid residue). AN and AP of the unfolded CcdBVfi were estimated as the sum of the corresponding accessibilities of the protein residues in an extended Ala-X-Ala tripeptide. The change in solvent-accessible surface area on CcdBVfi (complete) unfolding (N2 ↔ 2D), ΔA, is the difference between solvent-accessible surface area of the native dimer and the two denatured monomers. For comparative purposes we also calculated ΔA that would accompany dissociation of the dimer to two native monomers N2 ↔ 2N. In these calculations, the atomic coordinates of each dissociated monomer were extracted from the structure of the dimer by deleting the coordinates of the other monomer. AN and AP were then calculated in the same way as for the native dimer. ΔCP,D0 accompanying CcdBVfi unfolding or dissociation was calculated from the corresponding changes in non-polar and polar solvent-accessible surface area using the expression (Equation 6) introduced by Murphy and Freire (38).
 |
Structure Analysis
For the mapping of the interaction surfaces V ↔ L, A, and I; P ↔ L; M ↔ L; A ↔ I; D ↔ E and Q; W ↔ F; I ↔ L; N ↔ D; L ↔ F; and F ↔ I substitutions were considered as conservative, whereas all other substitutions were considered non-conservative mutations.
RESULTS AND DISCUSSION
Crystal Structure of CcdBVfi
The crystal structure of CcdBVfi was determined from two crystal forms at high resolution: at pH 7.0 in space group I213 at 1.5-Å resolution and at pH 5.6 in space group C2 at 1.7-Å resolution (Table 1). In both crystal forms, the asymmetric unit contains a monomer and the dimer is formed through crystal symmetry. The CcdBVfi monomer consists of a major five-stranded N-terminal β-sheet, a smaller three-stranded β-sheet, and a C-terminal α-helix (Fig. 1A). No electron density is visible, and hence no model can be build for the N-terminal methionine, for residues Leu46–His53 of the pH 7.0 structure and for residues Lys48–Ser52 of the pH 5.6 structure.
FIGURE 1.

Crystal structure of CcdBVfi. A, crystal structure of the CcdBVfi monomer (crystal form II). The β-strands belonging to the N-terminal β-sheet are shown in blue, the β-strands belonging to the smaller three-stranded β-sheet are shown in red, and the C-terminal α-helix is shown in green. B, superposition of the monomers of both crystal forms of CcdBVfi. Form I is shown in blue, and form II is shown in green. The orientation is the same as shown in panel A. C, surface electrostatic potentials of CcdBVfi dimer (left) and the CcdBF dimer (right). Positive potentials are shown in blue, negative potentials in red. The pronounced concentration of positive charges observed for CcdBF and previously hypothesized to be a DNA-interacting surface is absent in CcdBVfi. D, the anion binding site described for CcdBF is absent in CcdBVfi. Shown is a superposition of CcdBF and CcdBVfi centered on the CcdBF-anion binding site. The backbone of CcdBF is shown in a light blue schematic representation, and the side chains of His55, His85, and Arg86, which constitute its anion binding site, are shown in ball-and-stick representation and are labeled. The bound chlorine ion is shown as a red sphere, and its hydrogen bonds with CcdBF side chains are indicated as thin blue lines. The corresponding side chains of the superimposed CcdBVfi (His59, Thr89, and Phe90) are represented in green ball-and-stick representation, and the virtual clash between Phe90 and the chlorine ion is indicated.
The monomers of the two crystal forms superimpose with an r.m.s.d. of 1.0 Å for 96 Cα pairs (Fig. 1B). Although relatively large, it is within the range normally observed for globular protein domains for which multiple crystal forms can be compared and comparable with values calculated for different structures of F plasmid CcdB (20). When looking at the r.m.s.d. in function of amino acid position, the lower values typically but not exclusively correspond to the secondary structure elements, whereas the larger deviations are found in loop regions.
Comparison with the available crystal structures of F plasmid CcdBF (20) reveals a very similar architecture, as expected for two proteins with 41% sequence identity, but also a lot of variation in the details of the structures. CcdBF has a very pronounced charge separation on its surface with the β-sheet side being dominated by a large number of arginine and lysine residues and the helix side being more negatively charged (20) (Fig. 1C). It was proposed that this charge distribution was relevant with respect to its interaction with gyrase and with its putative interaction with substrate DNA bound to gyrase. CcdBVfi does not show such a pronounced bipolar charge distribution, the clustering arginine and lysine residues of CcdBF not being generally conserved (Fig. 1C).
F plasmid CcdBF contains an anion binding site known to occupy Cl− or SO42− depending on the crystallization conditions used (20) (Fig. 1D). The strong structural resemblance between the CcdB and MazF families of toxins almost certainly implies a common evolutionary origin despite the MazF proteins being ribonucleases rather than gyrase inhibitors (2). The anion binding site of CcdBF might thus be a relic of a former nucleotide binding site. This anion binding site is, however, not present in CcdBVfi (Fig. 1D) arguing against an evolutionary relic. It also does not coincide with the presumed mRNA binding site of MazF (39).
NMR Solution Structure of CcdBVfi
The structure of CcdBVfi was further studied in solution by NMR spectroscopy (Table 2). Only a single set of resonances is observed in the NMR spectra indicating a single conformation or population of structures that are interconverting fast on the NMR timescale (lifetimes shorter than milliseconds). The 20 lowest energy structures (out of 100 calculated ones) show a backbone r.m.s.d. of 0.77 Å for the whole backbone (residues 1–105), as expected for a generally well structured protein (Fig. 2A). A few loops are less well defined, including, most prominently, the region between residues Leu46 and Pro56, which is not seen in the x-ray structure. Excluding this region and the N- and C-terminal 5-residues, the backbone r.m.s.d. drops to 0.62 Å. The closest-to-mean structure superimposes on the cubic pH 7.0 dimer with an r.m.s.d. of 2.1 Å and on the monoclinic pH 5.6 dimer with 2.4 Å (for backbone atoms between residues 5–43 and 60–100). To obtain hints from the NMR data if any of the two crystal structures is closer to the solution NMR structure, we looked for NOEs that should be present in one of the x-ray conformations only. So, we checked for proton-proton distances that are shorter than 3 Å in one conformer but longer than 5 Å in the other. These theoretical NOEs were then checked manually on the experimental NOE data. Out of 64 and 115 theoretically calculated NOEs for the cubic and the monoclinic x-ray conformers, respectively 14 and 15 can be considered as unique for one conformer (supplemental Table S1). Thus the NMR structure can be said to be either between the x-ray conformers or in a fast equilibrium between these two (and possibly others).
TABLE 2.
Conformational restraints and statistics for the ensemble of 20 lowest energy structures of CcdBVfi
| Restraints used for structure calculations | |
| Intraresidue NOEs | 1604 |
| Sequential NOEs (residue i to i+1) | 508 |
| Medium-range NOEs (residue i to i+2, 3, 4) | 364 |
| Long-range NOEs (residue i to i+n, n = >5) | 872 |
| Intermolecular | 16 |
| Dihedral angle restraints (phi and psi) | 228 |
| Total structural restraints | 3592 |
| Structural statistics | |
| r.m.s.d. for backbone atoms (residues 1–105) | 0.765 |
| r.m.s.d. for backbone atoms (residues 5–43, 60–100) | 0.621 |
| r.m.s.d. for all atoms (residues 1–105) | 1.378 |
| r.m.s.d. for all atoms (residues 5–43, 60–100) | 1.234 |
| Average number of NOE violations >0.2 Å (per structure) | 61 ± 4 |
| Number of NOE violations >0.5 Å | 0 |
| Average number of dihedral angle violations >2° (per structure) | 11 ± 2 |
| Number of dihedral angle violations >5° | 0 |
| Residues in most favored regions of Ramachandran plot (%) | 59.7 |
| Residues in additional allowed regions of Ramachandran plot (%) | 34.1 |
| Residues in generously allowed regions of Ramachandran plot (%) | 4.3 |
| Residues in disallowed regions of Ramachandran plot (%) | 1.9 |
| r.m.s.d. for covalent bonds (Å) | 0.005 ± 0.0001 |
| r.m.s.d. for covalent angles (°) | 0.71 ± 0.01 |
| r.m.s.d. for improper angles (°) | 0.59 ± 0.01 |
| Energies (kcal/mol) | |
| Total | 1694 ± 54 |
| Bond | 85 ± 3 |
| Angle | 482 ± 15 |
| Improper | 90 ± 5 |
| van der Waals | 487 ± 25 |
| NOE | 536 ± 22 |
| Dihedral | 15 ± 2 |
| Data deposition | |
| PDB entry | 2kmt |
FIGURE 2.

Flexibility of the CcdBVfi dimer. A, NMR solution structure of dimeric CcdBVfi. Least-square fitted superposition of 20 lowest energy structures. Loops showing increased flexibility are annotated. B, inherent plasticity of the CcdBVfi dimer. Superposition of both crystal form dimers of CcdBVfi demonstrates the inherent plasticity in the dimer. One chain of the dimer (shown in gray) was superimposed. CcdBVfi-form I is shown in orange, and CcdBVfi-form II is shown in green. C, schematic representation of the deformation that causes the inter-monomer rotation in the CcdBVfi dimer compared with a rigid body movement of the monomers.
Conformational Flexibility
Heteronuclear 15N relaxation data provide information about the per residue flexibility of a protein. CcdBVfi shows most pronounced flexibility in the region between residues Leu46 and Pro56 as indicated by high R1, low R2, and low 15N NOE values (supplemental Fig. S1) (29). This higher mobility correlates very well with the absence of electron density for most of these residues in the x-ray structures. In addition a somewhat increased flexibility can be inferred for the loop between Asn9 and Ala15 and to a lesser extend (mainly seen on R1 and R2 values) also for the loop between Gln25 and Arg35. The loop between residues Asn9 and Ala15 also displays high B-factors in the cubic crystal at pH 7.0, indicative of flexibility and corresponds to a region that in F plasmid CcdBF is disordered, but gets ordered upon binding of CcdAF.
The loops with higher flexibility based on the relaxation data are also less well defined in the NMR structure. The backbone r.m.s.d., excluding these loops, drops down to 0.46 Å for each monomer and 0.62 Å for the same regions in the dimer. The higher flexibility of these regions results from a lower number of long range NOEs. However, these loops cannot be considered as unstructured, because for example a short α-helix is found in the loop between Asn9 and Ala15.
CcdBVfi forms a dimer through sheet extension with the hydrophobic core of the protein crossing the dimer interface. Comparison of the two crystal forms reveals that this dimer is not a rigid entity. When superimposing one monomer of each dimer onto each other, the second monomer undergoes a relative 10.2° rotation between the two crystal forms. This is achieved without significant disturbance of the dimer interface. Rather, the relative movement of the monomers occurs through the inherent plasticity of the monomer itself (Fig. 2, B and C). The experimental NOEs equally indicate a well structured dimer interface, which is reflected in the NMR ensemble.
This plasticity-driven change in dimer organization seems to be absent in CcdBF. For the latter, seven independent dimer structures are available for the unliganded form of the protein through three crystal forms grown at a wide pH range (one dimer at pH 4.5, two dimers at pH 7.5, and four dimers at pH 9.0) (20). Superposition of the first monomer of each dimer shows that the relative orientations and positions of the second monomer do not change significantly (all rotations within 2°). Rather, the CcdBF dimer undergoes a rigid inter-subunit rotation upon binding gyrase or CcdAF (17, 40). The functional consequences of this inherent plasticity of CcdBVfi, which we observe both in the crystal and in solution, will however only become clear when we obtain the structures of CcdBVfi in complex with its cognate CcdAVfi and GyrA14Vfi.
Thermodynamic Stability of CcdBVfi
Detailed information on conformational stability of CcdBVfi was obtained using DSC. The high degree of reversibility (>80%) of the DSC experiments at pH > pI suggests that CcdBVfi thermal unfolding at these conditions might be an equilibrium process (the pI of the CcdBVfi protein was determined experimentally as 5.4 with isoelectric focusing). Furthermore, the shape of the DSC thermograms was found to be independent of the scanning rate (not shown), indicating that the thermal unfolding of CcdBVfi can be considered an equilibrium process. It can be seen in Fig. 3A that the DSC thermograms appear to be monophasic and show significant concentration dependence. They can be reasonably well described with a two-state model assuming dissociation of the CcdBVfi dimer (N2 ↔ 2D). This finding, together with the average ΔHD,Tm0(model-dependent)/ΔHD,Tm0(model-independent) ratio of 1.1 ± 0.1, suggests that the applied model may be considered appropriate for the description of the CcdBVfi thermal unfolding. The corresponding model-independent and model-dependent thermodynamic parameters are presented in Table 3. The observation that folding of CcdBVfi in the standard state at physiological temperatures is an enthalpy- driven process accompanied by an unfavorable entropy contribution and negative heat capacity change (Fig. 3, B–D) is a general feature of globular proteins (41). At these conditions CcdBVfi exhibits the highest stability at pH ≈ 7 (Fig. 3E), and its stability remains appreciable even at pH 11.0. At pH 4.0 (<pI), however, the transition was found to be irreversible (but without visible precipitation). Because in this case the two-state model analysis has no physical meaning, only the model-independent parameters are presented for comparative purposes (Table 3).
FIGURE 3.

Thermodynamics of CcdBVfi unfolding at various pH values. A, DSC thermograms. Every second experimental point is presented for clarity. Lines represent the best fits of the model function (Equation 5) to the experimental data. Inset: example of protein concentration dependence of thermograms measured at pH 7.0, indicating that CcdBVfi dimer unfolding is accompanied by dissociation of the subunits. B–D, standard Gibbs free energy of unfolding, ΔGD0; standard enthalpy of unfolding, ΔHD0, and the corresponding entropy contribution, TΔSD0, as functions of temperature, T, were calculated using model-independent parameter values (Table 3) and Equations 1–3. Color legends are defined in panel A and used consistently in all other panels. E, thermodynamic stability of CcdBVfi in correlation with the degree of its unfolding. The thermodynamic stability, ΔGD0, at 37 °C (filled circles) is compared with the degree of unfolding estimated from the experimental heat capacities and enthalpies of CcdBVfi unfolding (open circles) extrapolated to T = 60 °C (Equation 2) and the expected values obtained using Robertson and Murphy's correlations of ΔCP,D0 and ΔHD0 (at T = 60 °C) to the number of amino acid residues, N (47). The presented relative degree of unfolding was calculated as: [ΔCP,D0(exp)/ΔCP,D0(R&M) + ΔHD0(exp)/ΔHD0(R&M)]/2. F, CD-pH profiles: Mean-residue molar ellipticity of CcdBVfi in the low temperature (T = 20 °C, open circles) native state and in the high temperature-denatured state (T = 85 °C, 10 min, filled circles) measured at 215 nm, where the changes in the measured ellipticity accompanying thermal unfolding were most pronounced.
TABLE 3.
Thermodynamic parameters of CcdBVfi thermal unfolding obtained from the model-independent (cal) and model-dependent (model, Equations 4 and 5) analysis of DSC data
| pH | CT | Tm | ΔHD,Tm0 |
ΔCP,D0 |
||
|---|---|---|---|---|---|---|
| cal | model | cal | model | |||
| μm | °C | kcal mol−1 | kcal mol−1K−1 | |||
| 4.0a | 30.0 | 70.3 | 63 | 0.9 | ||
| 6.1 | 10.0 | 75.7 | 135 | 144 | 2.3 | 1.7 |
| 7.0 | 11.0 | 71.6 | 140 | 148 | 2.1 | 2.1 |
| 8.0 | 10.0 | 63.8 | 97 | 111 | 1.8 | 1.5 |
| 9.0 | 10.0 | 56.9 | 81 | 97 | 1.3 | 0.7 |
| 11.0 | 10.0 | 54.0 | 74 | 83 | 1.2 | 1.2 |
| Error (±)b | 0.1 | 0.3 | 4 | 4 | 0.3 | 0.3 |
a The transition was found irreversible. Therefore, only the model-independent parameters are presented for comparative purposes. Tm was estimated as the temperature that corresponds to the peak of the thermograms.
b The absolute errors of thermodynamic parameters were estimated by variation of possible base-line positions and are higher than those obtained as square roots of diagonal elements of the variance-covariance matrix from the fitting procedure.
In general thermal unfolding of antitoxins is highly reversible, whereas for the toxins it is usually irreversible. Thus detailed characterizations have been published of thermodynamic parameters of unfolding for the antitoxins F plasmid CcdA (42), ParD from plasmid RK2 (43), E. coli MazE (34, 35), and phage P1 Phd.7 On the other hand, F plasmid CcdBF is the only toxin for which some quantitative data have been produced via chemical unfolding (42, 44, 45) and via thermal unfolding in solutions containing at least 0.8 m guanidinium hydrochloride (46). In contrast, thermal unfolding of CcdBVfi is highly reversible over a wide pH range, making it a suitable model protein.
Structure-Stability Relationship
We compared the heat capacity and enthalpy of CcdBVfi unfolding, extrapolated to T = 60 °C (Equation 2) to the corresponding averages over a large set of proteins. The averages were obtained using Robertson and Murphy's (47) correlations of ΔCP,D0 and ΔHD,T0 (at T = 60 °C) to the number of amino acid residues, N. According to the size of the CcdBVfi cooperatively unfolding unit (dimer, n = 210), the expected values are ΔCP,D0 = 2.91 ± 0.05 kcal K−1 mol−1 and ΔHD,T0 = 147 ± 4 kcal mol−1. The experimental values at T = 60 °C correspond to ∼35% (pH 4), 75% (pH 6–7), 60% (pH 8), and 50% (pH 9–11) of the expected ΔCP,D0 and ΔHD,T0 (Fig. 3E). This indicates that up to 85 °C the degree of thermal unfolding of CcdBVfi at all monitored pH values is significantly lower than the degree of unfolding seen in an average protein of the Robertson and Murphy data set. Moreover, the comparison in Fig. 3E suggests that the relative degree of unfolding is correlated with the thermodynamic stability of the protein. The measured ΔCP,D0 values can also be compared with the corresponding heat capacity changes estimated on the basis of changes of solvent-accessible surface areas calculated based on the x-ray and NMR-derived coordinates (Equation 6). ΔCP,D0 values for complete unfolding (N2 ↔ 2D) and for dimer dissociation without additional unfolding (N2 ↔ 2N) were estimated to be 4.0 ± 0.5 (crystal structures), 4.8 ± 0.4 (NMR ensemble) kcal K−1 mol−1 and 0.47 ± 0.05 (crystal structures), 0.21 ± 0.03 (NMR ensemble) kcal K−1 mol−1, respectively. The values for complete unfolding are about two times higher than the corresponding experimental value (pH 6–7), whereas the value for dimer dissociation is about five to ten times lower. Therefore, it seems that the observed energetics of CcdBVfi results mainly from partial unfolding of both monomers while the contribution of dimer dissociation is small but significant. These findings suggest that, in the thermally denatured state, CcdBVfi monomers are not fully unfolded, which is in agreement with the CD spectroscopic observations (Fig. 3F). Moreover, the CD pH profile (Fig. 3F) is in accordance with the corresponding stability profile and with the degree of unfolding (Fig. 3E) profile. This indicates that the observed shape of the pH profiles may be ascribed mainly to the pH-induced changes in the structure of the thermally denatured state of CcdBVfi.
Consequences for CcdB Function
CcdBVfi shows 41% sequence identity with CcdBF. Not unexpectedly, all non-conservative amino acid substitutions are located on the surface of the protein. Interestingly, both the binding sites for GyrA14 (40) and for the C-terminal domain of CcdA (17) that were previously located on CcdBF, are hotspots for non-conservative substitutions (Fig. 4). This is not unexpected for the CcdA binding site, because CcdA sequences are more divergent than CcdB sequences (22% sequence identity between the C-terminal domains of CcdAVfi and CcdAF) and indicate co-evolution to generate specific non-exchangeable toxin-antitoxin pairs. Indeed, ample evidence for such lack of cross-talk is available not only in the ccd family but also in other TA families. For example the chromosomal E. coli O157 CcdA is unable to protect against F plasmid CcdBF (48). Similarly, toxins and antitoxins of two mazEF modules on the E. coli K12 chromosome and plasmid R1/R100 are not interchangeable (49) as is also the case for the two higBA modules on the chromosome of Vibrio cholerae (50).
FIGURE 4.

Conservation patterns of the interaction surfaces. The molecular surface of the CcdBF dimer is shown in two orientations 180° apart. The interaction surface with the peptide is colored yellow, whereas the interaction surface with gyrase is colored blue. Non-conservative substitutions in both binding sites are shown in red and are scattered over both interaction surfaces. Non-conservative substitutions outside the two interaction sites are omitted for clarity.
The sequences of gyrase subunits on the other hand are very well conserved. The GyrA subunits of E. coli and V. fischeri GyrA show 76% sequence identity, and very few substitutions can be found among the residues that constitute their CcdB binding sites. Gyrase is an essential enzyme and thus has undergone little divergence. It was therefore anticipated that this binding surface on CcdB would be well conserved. It is therefore surprising that the center of the GyrA binding surface on CcdB is a hotspot of non-conservative amino acid substitutions (Fig. 4). In particular, a threonine residue is found at position 103 of CcdBVfi. This position is occupied by a tryptophan residue in F plasmid CcdBF, and substitution of this tryptophan in CcdBF abolishes the gyrase-poisoning activity of CcdBF (51). The possible consequences of this observation for the mechanism of action of CcdBVfi and the generality of the conclusions drawn from the structural and mechanistic studies of the gyrase-CcdBF interaction require further investigation.
Acknowledgments
We acknowledge the use of beam time at the European Molecular Biology Laboratory beamlines at the Deutsches Elektronen-Synchrotron (Hamburg, Germany) synchrotron.
This work was supported in part by the Vlaams Interuniversitair Instituut voor Biotechnologie, the Fonds voor Wetenschappelijk Onderzoek Vlaanderen (FWO), and the Onderzoeksraad of the Vrije Universiteit Brussel. The work was also supported by the Ministry of Higher Education, Science and Technology and by the Agency for Research of Republic of Slovenia (Grants P1-0201 and J1-6653).
The atomic coordinates and structure factors (codes 2kmt, 3jsc, and 3jrz) have been deposited in the Protein Data Bank, Research Collaboratory for Structural Bioinformatics, Rutgers University, New Brunswick, NJ (http://www.rcsb.org/).

The on-line version of this article (available at http://www.jbc.org) contains supplemental Fig. S1 and Table S1.
A. Garcia-Pino and R. Loris, unpublished results.
- TA
- toxin-antitoxin
- HSQC
- heteronuclear single quantum coherence
- NOE
- nuclear Overhauser effect
- DSC
- differential scanning calorimetry
- r.m.s.d.
- root mean square deviation.
REFERENCES
- 1.Pandey D. P., Gerdes K. (2005) Nucleic Acids Res. 33, 966–976 [DOI] [PMC free article] [PubMed] [Google Scholar]
- 2.Buts L., Lah J., Dao-Thi M. H., Wyns L., Loris R. (2005) Trends Biochem. Sci. 30, 672–679 [DOI] [PubMed] [Google Scholar]
- 3.Gerdes K., Christensen S. K., Løbner-Olesen A. (2005) Nat. Rev. Microbiol. 3, 371–382 [DOI] [PubMed] [Google Scholar]
- 4.Ogura T., Hiraga S. (1983) Proc. Natl. Acad. Sci. U.S.A. 80, 4784–4788 [DOI] [PMC free article] [PubMed] [Google Scholar]
- 5.Magnuson R. D. (2007) J. Bacteriol. 189, 6089–6092 [DOI] [PMC free article] [PubMed] [Google Scholar]
- 6.Christensen S. K., Mikkelsen M., Pedersen K., Gerdes K. (2001) Proc. Natl. Acad. Sci. U.S.A. 98, 14328–14333 [DOI] [PMC free article] [PubMed] [Google Scholar]
- 7.Pedersen K., Christensen S. K., Gerdes K. (2002) Mol. Microbiol. 45, 501–510 [DOI] [PubMed] [Google Scholar]
- 8.Suzuki M., Zhang J., Liu M., Woychik N. A., Inouye M. (2005) Mol. Cell 18, 253–261 [DOI] [PubMed] [Google Scholar]
- 9.Kolodkin-Gal I., Hazan R., Gaathon A., Carmeli S., Engelberg-Kulka H. (2007) Science 318, 652–655 [DOI] [PubMed] [Google Scholar]
- 10.Nariya H., Inouye M. (2008) Cell 132, 55–66 [DOI] [PubMed] [Google Scholar]
- 11.Dao-Thi M. H., Charlier D., Loris R., Maes D., Messens J., Wyns L., Backmann J. (2002) J. Biol. Chem. 277, 3733–3742 [DOI] [PubMed] [Google Scholar]
- 12.Van Melderen L., Bernard P., Couturier M. (1994) Mol. Microbiol. 11, 1151–1157 [DOI] [PubMed] [Google Scholar]
- 13.Bernard P., Couturier M. (1992) J. Mol. Biol. 226, 735–745 [DOI] [PubMed] [Google Scholar]
- 14.Critchlow S. E., O'Dea M. H., Howells A. J., Couturier M., Gellert M., Maxwell A. (1997) J. Mol. Biol. 273, 826–839 [DOI] [PubMed] [Google Scholar]
- 15.Maki S., Takiguchi S., Horiuchi T., Sekimizu K., Miki T. (1996) J. Mol. Biol. 256, 473–482 [DOI] [PubMed] [Google Scholar]
- 16.Bernard P., Kézdy K. E., Van Melderen L., Steyaert J., Wyns L., Pato M. L., Higgins P. N., Couturier M. (1993) J. Mol. Biol. 234, 534–541 [DOI] [PubMed] [Google Scholar]
- 17.De Jonge N., Garcia-Pino A., Buts L., Haesaerts S., Charlier D., Zangger K., Wyns L., De Greve H., Loris R. (2009) Mol. Cell 35, 154–163 [DOI] [PubMed] [Google Scholar]
- 18.De Jonge N., Buts L., Vangelooven J., Mine N., Van Melderen L., Wyns L., Loris R. (2007) Acta Crystallograph. Sect. F. 63, 356–360 [DOI] [PMC free article] [PubMed] [Google Scholar]
- 19.McCoy A. J. (2007) Acta Crystallogr. D Biol. Crystallogr. 63, 32–41 [DOI] [PMC free article] [PubMed] [Google Scholar]
- 20.Loris R., Dao-Thi M. H., Bahassi E. M., Van Melderen L., Poortmans F., Liddington R., Couturier M., Wyns L. (1999) J. Mol. Biol. 285, 1667–1677 [DOI] [PubMed] [Google Scholar]
- 21.Murshudov G. N., Vagin A. A., Dodson E. J. (1997) Acta Crystallogr. D Biol. Crystallogr. 53, 240–255 [DOI] [PubMed] [Google Scholar]
- 22.Collaborative Computational Project, N. 4. (1994) Acta Crystallogr. D Biol. Crystallogr. 50, 760–76315299374 [Google Scholar]
- 23.Afonine P. V., Grosse-Kunstleve R. W., Adams P. D. (2005) Acta Crystallogr. D. Biol. Crystallogr. 61, 850–855 [DOI] [PMC free article] [PubMed] [Google Scholar]
- 24.Adams P. D., Grosse-Kunstleve R. W., Hung L. W., Ioerger T. R., McCoy A. J., Moriarty N. W., Read R. J., Sacchettini J. C., Sauter N. K., Terwilliger T. C. (2002) Acta Crystallogr. D. Biol. Crystallogr. 58, 1948–1954 [DOI] [PubMed] [Google Scholar]
- 25.Emsley P., Cowtan K. (2004) Acta Crystallogr. D. Biol. Crystallogr. 60, 2126–2132 [DOI] [PubMed] [Google Scholar]
- 26.Delaglio F., Grzesiek S., Vuister G. W., Zhu G., Pfeifer J., Bax A. (1995) J. Biomol. NMR 6, 277–293 [DOI] [PubMed] [Google Scholar]
- 27.Johnson B. A., Blevins R. A. (1994) J. Biomol. NMR 4, 603–614 [DOI] [PubMed] [Google Scholar]
- 28.Wishart D. S., Arndt D., Berjanskii M., Tang P., Zhou J., Lin G. (2008) Nucleic Acids Res. 36, W496–W502 [DOI] [PMC free article] [PubMed] [Google Scholar]
- 29.Respondek M., Buts L., De Jonge N., Haesaerts S., Loris R., Van Melderen L., Wyns L., Zangger K. (2009) Biomol. NMR Assign. 3, 145–147 [DOI] [PubMed] [Google Scholar]
- 30.Cornilescu G., Delaglio F., Bax A. (1999) J. Biomol. NMR 13, 289–302 [DOI] [PubMed] [Google Scholar]
- 31.Brünger A. T., Adams P. D., Clore G. M., DeLano W. L., Gros P., Grosse-Kunstleve R. W., Jiang J. S., Kuszewski J., Nilges M., Pannu N. S., Read R. J., Rice L. M., Simonson T., Warren G. L. (1998) Acta Crystallogr. D Biol. Crystallogr. 54, 905–921 [DOI] [PubMed] [Google Scholar]
- 32.Ladbury J. E., Chowdhry B. Z. (1998) Biocalorimetry: Applications of Calorimetry in the Biological Sciences, John Wiley, Chichester [Google Scholar]
- 33.Drobnak I., Korencic A., Loris R., Marianovsky I., Glaser G., Jamnik A., Vesnaver G., Lah J. (2009) J. Mol. Biol. 392, 63–74 [DOI] [PubMed] [Google Scholar]
- 34.Lah J., Simic M., Vesnaver G., Marianovsky I., Glaser G., Engelberg-Kulka H., Loris R. (2005) J. Biol. Chem. 280, 17397–17407 [DOI] [PubMed] [Google Scholar]
- 35.Lah J., Marianovsky I., Glaser G., Engelberg-Kulka H., Kinne J., Wyns L., Loris R. (2003) J. Biol. Chem. 278, 14101–14111 [DOI] [PubMed] [Google Scholar]
- 36.Press W. H., Teukolsky S. A., Vetterling W. T., Flannery B. P. (1992) Numerical Recipes in C. the Art of Scientific Computing, Cambridge University Press, Cambridge, UK [Google Scholar]
- 37.Hubbard S. J., Thornton J. M. (1993) NACCESS, Computer Program, Dept. of Biochemistry and Molecular Biology, University College London [Google Scholar]
- 38.Murphy K. P., Freire E. (1992) Adv. Protein Chem. 43, 313–361 [DOI] [PubMed] [Google Scholar]
- 39.Kamphuis M. B., Bonvin A. M., Monti M. C., Lemonnier M., Muñoz-Gómez A., van den Heuvel R. H., Díaz-Orejas R., Boelens R. (2006) J. Mol. Biol. 357, 115–126 [DOI] [PubMed] [Google Scholar]
- 40.Dao-Thi M. H., Van Melderen L., De Genst E., Afif H., Buts L., Wyns L., Loris R. (2005) J. Mol. Biol. 348, 1091–1102 [DOI] [PubMed] [Google Scholar]
- 41.Makhatadze G. I., Privalov P. L. (1995) Adv. Protein Chem. 47, 307–425 [DOI] [PubMed] [Google Scholar]
- 42.Dao-Thi M. H., Messens J., Wyns L., Backmann J. (2000) J. Mol. Biol. 299, 1373–1386 [DOI] [PubMed] [Google Scholar]
- 43.Oberer M., Lindner H., Glatter O., Kratky C., Keller W. (1999) Biol. Chem. 380, 1413–1420 [DOI] [PubMed] [Google Scholar]
- 44.Simic M., De Jonge N., Loris R., Vesnaver G., Lah J. (2009) J. Biol. Chem. 284, 20002–20010 [DOI] [PMC free article] [PubMed] [Google Scholar]
- 45.Simic M., Vesnaver G., Lah J. (2009) Acta Chim. Slov. 139–144 [Google Scholar]
- 46.Bajaj K., Chakshusmathi G., Bachhawat-Sikder K., Surolia A., Varadarajan R. (2004) Biochem. J. 380, 409–417 [DOI] [PMC free article] [PubMed] [Google Scholar]
- 47.Robertson A. D., Murphy K. P. (1997) Chem. Rev. 97, 1251–1268 [DOI] [PubMed] [Google Scholar]
- 48.Wilbaux M., Mine N., Guérout A. M., Mazel D., Van Melderen L. (2007) J. Bacteriol. 189, 2712–2719 [DOI] [PMC free article] [PubMed] [Google Scholar]
- 49.Santos Sierra S., Giraldo R., Díaz Orejas R. (1998) FEMS Microbiol. Lett. 168, 51–58 [DOI] [PubMed] [Google Scholar]
- 50.Christensen-Dalsgaard M., Gerdes K. (2006) Mol. Microbiol. 62, 397–411 [DOI] [PubMed] [Google Scholar]
- 51.Bahassi E. M., Salmon M. A., Van Melderen L., Bernard P., Couturier M. (1995) Mol. Microbiol. 15, 1031–1037 [DOI] [PubMed] [Google Scholar]