Abstract
Identifying biological roles for mammalian glycans and the pathways by which they are synthesized has been greatly facilitated by investigations of glycosylation mutants of cultured cell lines and model organisms. Chinese hamster ovary (CHO) glycosylation mutants isolated on the basis of their lectin resistance have been particularly useful for glycosylation engineering of recombinant glycoproteins. To further enhance the application of these mutants, and to obtain insights into the effects of altering one specific glycosyltransferase or glycosylation activity on the overall expression of cellular glycans, an analysis of the N-glycans and major O-glycans of a panel of CHO mutants was performed using glycomic analyses anchored by matrix-assisted laser desorption ionization-time of flight/time of flight mass spectrometry. We report here the complement of the major N-glycans and O-glycans present in nine distinct CHO glycosylation mutants. Parent CHO cells grown in monolayer versus suspension culture had similar profiles of N- and O-GalNAc glycans, although the profiles of glycosylation mutants Lec1, Lec2, Lec3.2.8.1, Lec4, LEC10, LEC11, LEC12, Lec13, and LEC30 were consistent with available genetic and biochemical data. However, the complexity of the range of N-glycans observed was unexpected. Several of the complex N-glycan profiles contained structures of m/z ∼13,000 representing complex N-glycans with a total of 26 N-acetyllactosamine (Galβ1–4GlcNAc)n units. Importantly, the LEC11, LEC12, and LEC30 CHO mutants exhibited unique complements of fucosylated complex N-glycans terminating in Lewisx and sialyl-Lewisx determinants. This analysis reveals the larger-than-expected complexity of N-glycans in CHO cell mutants that may be used in a broad variety of functional glycomics studies and for making recombinant glycoproteins.
Keywords: Glycosylation, Methods/Mass Spectrometry, CHO Cells, Glycomics, Lec Mutants, Poly-N-acetyllactosamine
Introduction
The N- and O-glycans that decorate glycoproteins at the cell surface serve many key biological functions, and thus it is essential to understand their structures and the factors that influence their synthesis. Mutants of mammalian cells affected in glycosylation pathways are a valuable resource for experiments aimed at structure/function analysis of mammalian glycans. A panel of glycosylation mutants that has been widely used for such purposes is the Chinese hamster ovary (CHO)4 mutant lines isolated following selection for various plant lectins (1, 2). These CHO mutants have been previously characterized biochemically and genetically, but their glycans have only been partially characterized structurally. In this study, we present glycomics profiles of the N-linked and O-GalNAc glycans of nine of the commonly used CHO glycosylation mutants, providing an important base line for future applications using these mutants in functional and biochemical studies and for glycosylation engineering. For example, it is very important to know the range of N-glycans that may be generated in the presence of GlcNAcT-III, the glycosyltransferase that in vitro adds the bisecting GlcNAc only to simple biantennary N-glycans (3). Similar considerations apply for CHO mutants expressing an α-1,3-fucosyltransferase that in vitro generates the Lewisx (Lex) and/or sialyl-Lewisx (sLex) determinants on comparatively simple acceptors (4). In hypomorphic mutants or mutants that are defective in the synthesis of a nucleotide sugar or the activity of a nucleotide sugar transporter, it is important to know the stringency of the phenotype and thus the extent of the block in glycosylation.
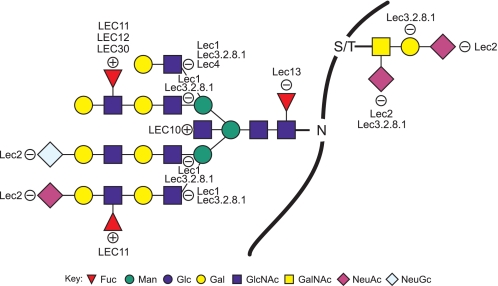
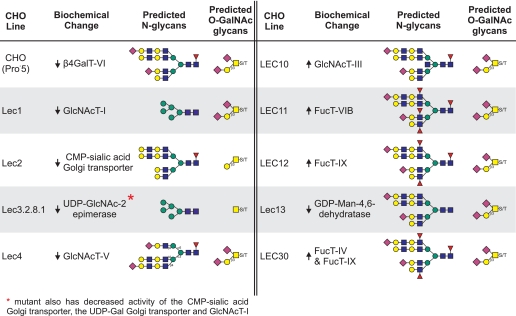
The development of sensitive methods of mass spectroscopy has allowed the glycan complement of tissues and cells to be examined in detail (5). Interpretation of masses obtained from MALDI-TOF/TOF spectra is assisted by knowledge of the glycosylation pathways involved and, in this paper, appreciation of the genetic and biochemical alterations expressed by a mutant phenotype (1). Here we present the N-glycan and O-GalNAc glycan glycomics profiles of CHO parent cells and of the glycosylation mutants Lec1, Lec2, Lec3.2.8.1, Lec4, LEC10, LEC11, LEC12, Lec13, and LEC30. The Lec8 cell line, which carries an inactive UDP-Gal transporter and is also in common use, was previously characterized by MALDI-MS (6). Fig. 1 summarizes the glycan structures predicted to be affected in each mutant, with the sites of glycosylation defects shown in terms of the sugar residue(s) added for gain-of-function mutants (+) or the sugar residues not transferred in the case of loss-of-function mutants (−). Table 1 summarizes the known biochemical basis of each glycosylation mutation.
FIGURE 1.
Altered N-glycans and O-GalNAc glycans in the CHO mutants analyzed here. A loss or reduction of a sugar residue at a particular position is indicated with a circled −, and the gain of a sugar residue is shown by a circled +. Symbolic nomenclature is presented as outlined by the Consortium for Functional Glycomics Nomenclature Committee. Full details are available on line.
TABLE 1.
Biochemical changes in the CHO glycosylation mutants in this study
EXPERIMENTAL PROCEDURES
CHO Cells and Culture Methods
The CHO cells compared by glycomics profiling were parental CHO (Pro−5) and glycosylation mutants selected from Pro−5 cells for survival to cytotoxic plant lectins (reviewed in Ref. 1). The Pro−5 line lacks transcripts of B4galt6 (7). The lectin-resistant clones used were as follows: Lec1.3C, Lec2.6A, Lec3.2.8.1.3B, Lec4.7B, LEC10.3C, LEC11.E7, LEC12.1B, Lec13.6A, and LEC30.H2. For simplicity, each clone is referred to by their Lec name in the text. CHO parent cells were grown in suspension or monolayer in α-minimal essential medium containing nucleotides and ribonucleosides (Invitrogen) and containing 10% fetal bovine serum (Gemini, West Sacramento, CA) at 37 °C in 5% CO2. Mutant cells were grown in suspension at 37 °C in the same medium with 10% fetal bovine serum. No clones had been growing more than 2 months in continuous culture when prepared for glycomic analyses.
Preparation of Cells for Glycomic Analyses
Cells growing in monolayer culture were grown to confluency. Medium was removed; 5 ml of phosphate-buffered saline containing 1 mm CaCl2, 1 mm MgCl2, and 1 mm MnCl2 (PBS) was added; and the cells were scraped into PBS, centrifuged, and washed three times with PBS. An aliquot of the third resuspension was counted to determine the total number of cells in the final pellet. The pellet was resuspended in 1 ml of PBS, transferred to a Microfuge tube, and pelleted at 800 × g. The supernatant was aspirated, and the cell pellet was stored at −80 °C and shipped on dry ice. Suspension cultures were grown to 8–10 × 105 cells/ml, washed with PBS three times, and processed as for monolayer cells.
Reduction and Carboxymethylation
Approximately 1.2 × 10⁸ cells from each CHO cell line (3 × 10⁸ in the case of the LEC12 mutant) were sonicated in extraction buffer (25 mm Tris, 150 mm NaCl, 5 mm EDTA and 1% CHAPS, pH 7.4) and then dialyzed against 4× 4.5 liters of 50 mm ammonium bicarbonate, pH 8.5, at 4 °C for 48 h as described previously (8). After dialysis, the sample was lyophilized and then reduced in 1 ml of 50 mm Tris-HCl buffer, pH 8.5, containing 2 mg/ml dithiothreitol. Reduction was performed under a nitrogen atmosphere at 37 °C for 1 h. Carboxymethylation was carried out by the addition of iodoacetic acid (5-fold molar excess over dithiothreitol), and the reaction was allowed to proceed under a nitrogen atmosphere at room temperature in the dark for 2 h. Carboxymethylation was terminated by dialysis against 4× 4.5 liters of 50 mm ammonium bicarbonate, pH 8.5, at 4 °C for 48 h. After dialysis, the sample was lyophilized.
Tryptic Digest
The reduced carboxymethylated proteins were digested with N-p-tosyl-l-phenylalanine chloromethyl ketone-pretreated bovine pancreas trypsin (EC 3.4.21.4; Sigma) for 16 h at 37 °C in 50 mm ammonium bicarbonate buffer, pH 8.4. The products were purified by C18 Sep-Pak® (Waters) as described previously (9).
Sep-Pak Separation of Released Glycans from Peptides
The reverse-phase C18 Sep-Pak® cartridge was primed sequentially with 5 ml of methanol, 5 ml of 5% acetic acid (v/v), and 5 ml of propan-1-ol before being re-equilibrated with 10 ml of 5% acetic acid (v/v). The sample was then dissolved in a minimum volume of 5% acetic acid (v/v) and loaded directly onto the Sep-Pak. Elution was achieved using 3 ml of 5% acetic acid (v/v), followed by 2 ml each of 20, 40, 60, and 100% propan-1-ol in 5% acetic acid (v/v). Each elution step was collected, reduced in volume on a SpeedVac, and lyophilized (9).
Peptide N-Glycosidase F Digestion of Glycopeptides
Peptide N-glycosidase F (EC 3.5.1.52; Roche Applied Science) digestion was carried out in 200 μl of ammonium bicarbonate (50 mm, pH 8.5) for 16 h at 37 °C using 3 units of enzyme. The reaction was terminated by lyophilization, and the released N-glycans were separated from peptides and O-glycopeptides by C18 Sep-Pak® (Waters) as described previously (9).
Sep-Pak Separation of Permethylated Glycans
The reverse-phase C18 Sep-Pak® cartridge was primed sequentially with 5 ml of methanol, 5 ml of water, and 5 ml of acetonitrile before being re-equilibrated with 10 ml of water. The lyophilized permethylated oligosaccharide sample was then dissolved in a minimum volume of methanol and loaded directly onto the Sep-Pak. Elution was achieved using 3 ml of water followed by 2 ml each of 15, 30, 50, 75, and 100% acetonitrile in water (v/v). Each elution step was collected, reduced in volume on a SpeedVac, and lyophilized (9).
Reductive Elimination
O-Glycans were released by reductive elimination in 400 μl of 0.1 m potassium borohydride solution (54 mg/ml of potassium hydroxide in water) at 45 °C for 16 h. The reaction was terminated by dropwise addition of glacial acetic acid, followed by Dowex 50W-X8 (H) 50–100 mesh (Sigma) chromatography and borate removal.
Endo-β-galactosidase Treatment
A portion of the underivatized N-glycan pool was dissolved in 100 μl of 50 mm ammonium acetate buffer, pH 5.8, and incubated at 37 °C with 50 milliunits of Escherichia freundii endo-β-galactosidase (EC 3.2.1.103). After 48 h, the sample was lyophilized and then permethylated before MALDI-TOF analysis.
Derivatization for MALDI-TOF and Tandem Mass Spectrometry Analysis
Permethylation was performed using the sodium hydroxide procedure, as described previously (9). 1 g of sodium hydroxide pellets were crushed in a glass mortar with 3 ml of distilled anhydrous DMSO. From the resulting slurry, 1 ml and 200 μl of methyl iodide were added to the lyophilized sample. The mixture was then shaken for 10 min before the reaction was quenched by dropwise addition of water. The permethylated sample was then extracted into 1 ml of chloroform and washed four times with 1 ml of water. The chloroform was then removed under a stream of nitrogen.
Partially methylated alditol acetates were prepared from permethylated samples for GC-MS linkage analysis as described previously (10). The permethylated glycans were hydrolyzed with 2 m trifluoroacetic acid for 2 h at 121 °C, reduced with 10 mg/ml sodium borodeuteride in 2 m aqueous ammonium hydroxide at room temperature for 2 h, and then acetylated with acetic anhydride at 100 °C for 1 h.
Mass Spectrometric Analysis
MALDI-TOF data were acquired on a Voyager-DE STR mass spectrometer (Applied Biosystems, Foster City, CA) in the reflectron mode with delayed extraction. Permethylated samples were dissolved in 10 μl of 80% (v/v) aqueous methanol, and 1 μl of dissolved sample was premixed with 1 μl of matrix (20 mg/ml 2,5-dihydroxybenzoic acid in 80% (v/v) aqueous methanol), spotted onto a target plate, and dried under vacuum.
Further MS/MS analyses of peaks observed in the MS spectra were carried out using a 4800 MALDI-TOF/TOF (Applied Biosystems) mass spectrometer. The potential difference between the source acceleration voltage and the collision cell was set to 1 kV, and argon was used as collision gas. The 4700 calibration standard kit, calmix (Applied Biosystems), was used as the external calibrant for the MS mode, and [Glu1] fibrinopeptide B human (Sigma) was used as an external calibrant for the MS/MS mode.
The exceptionally high mass signals were observed during additional MS experiments carried out on the 4800 MALDI-TOF/TOF. The MALDI was tuned to specifically allow the transmission of higher mass ions at the expense of those at lower mass by manipulation of the lens voltages within Source 1.
Gas Chromatography-MS Linkage Analysis
GC-MS linkage analysis of partially methylated alditol acetates was carried out using a PerkinElmer Life Sciences Clarus 500 instrument fitted with an RTX-5 fused silica capillary column (30 m × 0.32 mm internal diameter, Restek Corp.). The sample was dissolved in hexane and injected onto the column at 60 °C. The column was maintained at this temperature for 1 min and then heated to 300 °C at a rate of 8 °C/min.
Automated MS and MS/MS Analysis
Annotation of the MS and MS/MS data was achieved with assistance from the Cartoonist algorithm (11) and the GlycoWorkbench software suite (12).
RESULTS AND DISCUSSION
To prepare samples for mass spectrometry, washed cell pellets from wild type CHO cells grown in monolayer or suspension, as well as nine lectin-resistant mutants (Lec1, Lec2, Lec3.2.8.1, Lec4, LEC10, LEC11, LEC12, Lec13, and LEC30) grown in suspension, were sonicated, reduced and carboxymethylated, and digested with trypsin. Preparation of tryptic glycopeptides facilitates the release of N- and O-glycans by means of peptide N-glycosidase F digestion and reductive elimination, respectively. Permethylation of the purified glycan populations was employed to enhance the sensitivity of the mass spectrometric analysis and to direct the fragmentation within tandem MS analyses.
Matrix-assisted laser desorption ionization (MALDI)-MS was employed to produce an initial profile of singly charged, sodiated molecular ions ([M + Na]+), the results of which were used to select target ions for further analysis by tandem MS/MS techniques and supplementary experiments such as enzymatic digestion and linkage analysis. Although not fully quantitative, recent studies have succeeded in demonstrating that MALDI-MS analyses of permethylated glycans provides reliable relative quantitation information based on signal intensities, particularly when comparisons are made over a small mass range of single ion peaks in the same spectrum (13).
Molecular ions observed in the MS analysis were subjected to MS/MS analysis, affording sequence informative fragment ions, providing information concerning structural features such as antennal structures, branching patterns, and some linkage positions. Linkage analysis by GC-MS, in concert with the mass spectrometric profiling information, facilitates the assignment of primary structural aspects, such as glycosidic bond positions and monosaccharide constituents. Enzymatic digests utilizing endo-β-galactosidase were also employed to confirm the presence of poly-N-acetyllactosamine structures (Galβ1– 4GlcNAc)n (14).
The assignments of N-glycan spectra were carried out with the assistance of Cartoonist (11, 15), a bespoke algorithm designed to mimic the human approach to the analysis and assignment of N-glycan MALDI spectra. Cartoonist searches the raw MS data for peak envelopes and uses knowledge of the biosynthetic pathways to present the user with the most likely permethylated carbohydrate structures for each signal. MS/MS spectra were assigned with the support of the GlycoWorkbench suite (12) of software tools, designed to assist the experts during the annotation of glycan fragment spectra. The graphical interface of GlycoWorkbench provides an environment in which structure models can be rapidly assembled, automatically matched with MSn data, and compared to assess the best candidate.
Due to the finding that CHO cells make not only multiantennary structures but also highly extended LacNAc repeats, the annotations are simplified throughout by using biantennary structures with the extensions listed in parentheses. Unless specifically noted, such structures are present as a mixture of bi-, tri-, and tetra-antennary glycans with varying numbers of LacNAc extensions and terminal NeuAc, NeuGc, or Fuc. Based on GC-MS data, core Fuc and bisecting GlcNAc residues are annotated within the biantennary structure. When discussed in the text, the total number of LacNAc units added to the pentasaccharide chitobiose core is given.
Glycans of Wild Type CHO Cells Grown in Monolayer Versus Suspension Culture
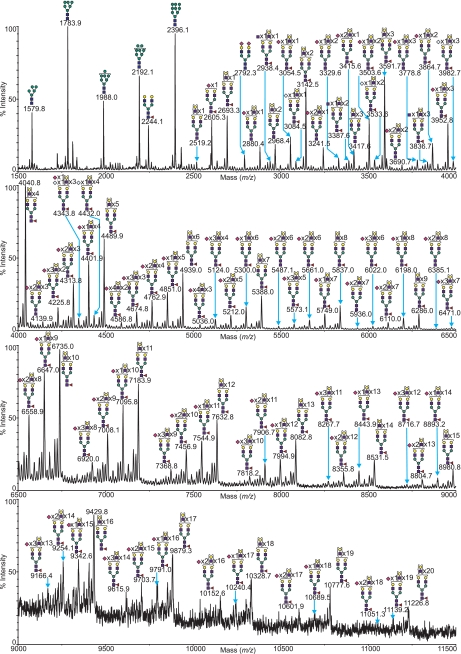
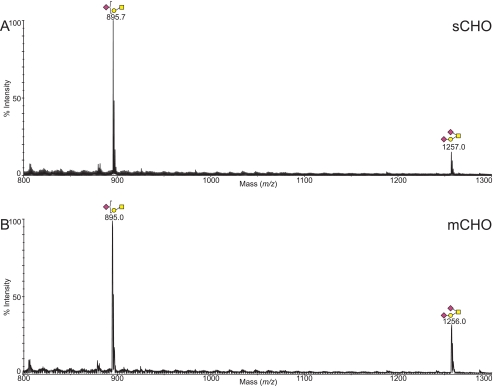
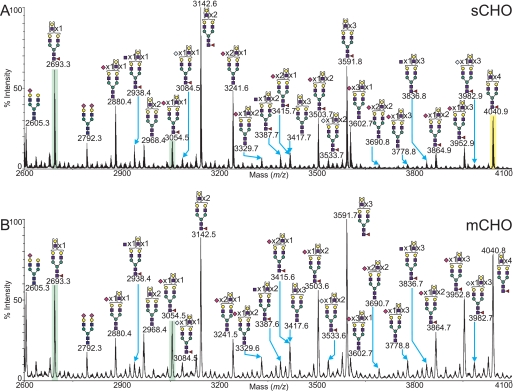
CHO cells grown in monolayer (mCHO) or in suspension (sCHO) were subjected to glycomic profiling by MALDI-MS analysis. A mass spectrum obtained from the peptide N-glycosidase F-released and -permethylated N-glycans from a typical monolayer preparation of cells is shown in Fig. 2, with the corresponding O-glycan spectrum in Fig. 3B. A selected mass range comparison of the mCHO sample with the sCHO sample is illustrated in Fig. 4. Complete compositional assignments can be found in supplemental Tables S1 and S2.
FIGURE 2.
MALDI-TOF MS profiles of the permethylated N-linked glycans derived from wild type CHO cells grown in monolayer. For complete annotation of the spectrum, see supplemental Table S1. Data were obtained from the 50% MeCN fraction, and all molecular ions are present in sodiated form ([M + Na]+).
FIGURE 3.
Comparison between the MALDI-TOF MS profiles of the permethylated O-glycans derived from wild type CHO cells grown in suspension (A) and wild type CHO cells grown in monolayer (B). Data were obtained from the 35% MeCN fraction, and all molecular ions are present in sodiated form ([M + Na]+).
FIGURE 4.
Comparison between the MALDI-TOF MS profiles of the permethylated N-glycans derived from wild type CHO cells grown in suspension (A) and wild type CHO cells grown in monolayer (B). Data were obtained from the 50% MeCN fraction and all molecular ions are present in sodiated form ([M + Na]+). The peaks at m/z 2623 and 3054 are highlighted in green to better aid meaningful comparison. The ion at m/z 4040.9 (highlighted yellow) corresponds to the exemplar MS/MS shown in Fig. 5.
The N-glycan spectra for mCHO and sCHO exhibited a similar range of structures. A full complement of high mannose N-glycans was observed (m/z 1579.8, 1783.9, 1988.2, 2192.1, and 2396.1), as well as a series of complex N-glycans comprising a mixture of bi-, tri-, and tetra-antennary structures, fucosylated on the core and bearing multiple LacNAc extensions, capped with sialic acid residues (n = 1–3). Very little evidence was observed for the presence of hybrid N-glycans in wild type CHO samples. Although some monosaccharide compositions could potentially be attributed to putative hybrid N-glycans, MS/MS analysis of these minor peaks yielded no definitive indication of hybrid structures, leading us to conclude that if they are present it is at very low abundance. Sialic acid was predominantly in the form of NeuAc, although NeuGc was present in a small proportion of sialylated N-glycans. This may be partly due to fetal bovine serum glycoprotein contamination (16), but it is known that CHO cells synthesize small amounts of CMP-NeuGc (17). It is advantageous that most CHO sialic acid is NeuAc because NeuGc is not desirable in recombinant therapeutic glycoproteins due to the high levels of circulating anti-NeuGc antibodies in human serum (18).
Indirect evidence for trace amounts of N-glycans with an unsubstituted GlcNAc was also obtained from both mCHO and sCHO spectra. Consistent with the presence of the bisecting GlcNAc in complex N-glycans, GC-MS linkage data showed very low relative abundance of 3,4,6-linked mannose (supplemental Table S3). This result was unexpected because no Mgat3 gene transcripts (19) or GlcNAcT-III activity (19–21) has been detected in wild type CHO cells. The GC-MS and MALDI-TOF data, however, suggest that the Mgat3 gene is not completely silent in the Pro−5 line of CHO cells. By contrast, there was no evidence of N-glycans with more than one fucose residue. This suggests that the Fut genes known to be encoded in the CHO genome and activated in the LEC11, LEC12, and LEC30 glycosylation mutants (1) are turned off in Pro−5 CHO cells. Although it is possible (although very unlikely, based upon exhaustive MS/MS experiments) that in some fucosylated N-glycans of CHO cells the single fucose is actually on an antenna instead of in the core, the abundance would have to be very low because CHO cells do not bind antibodies that recognize fucose in the oncofetal antigens Lex, sLex, or VIM-2 (4, 22).
Overall, the most abundant structures in both the mCHO and sCHO preparations were a series of core-fucosylated asialoglycans bearing between 2 and 26 LacNAc units (Fuc1Hex5–29HexNAc4–28). The main difference between the monolayer and a suspension of CHO preparations was a variation in the level of sialylation, with the sCHO preparation showing a slight decrease in relative abundance of sialylated N-glycans compared with the mCHO sample. Direct comparison of two related species in each spectrum, a putative tri-antennary, core-fucosylated N-glycan with a single NeuAc (m/z 3054.5) and an asialo form of otherwise identical composition (m/z 2693.3), yielded a ratio of ∼1:3 (sialylated:nonsialylated) in the sCHO sample versus 1:1.5 in the mCHO sample. These peaks are highlighted in green in Fig. 4.
The O-glycan spectra from wild type CHO show a simple set of core 1 structures, mono- or di-sialylated by NeuAc (Fig. 3), and the core 1 disaccharide (supplemental Table S2). As was the case for the N-glycans, both the mCHO and sCHO O-glycan spectra were very similar, although the cells grown in monolayer again have a slightly higher degree of relative sialylation.
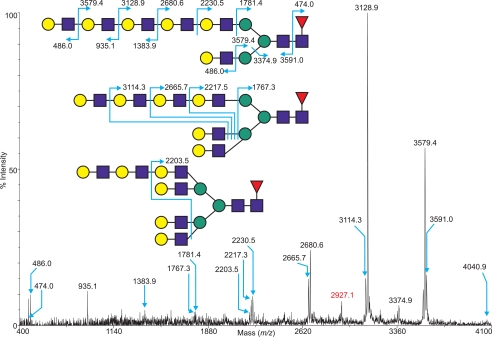
An important consideration in interpreting the MS spectra was the likelihood that N-glycans of the same m/z would include different isobaric structures. This was examined by multiple MS/MS fragmentation experiments of selected ions within the spectra of each CHO glycosylation mutant, and exemplar data are presented. Fig. 5 shows the species at m/z 4040.9 in the sCHO sample (Fig. 4A, FucHex9HexNAc8, highlighted in yellow) subjected to MS/MS analysis. The y ion at m/z 474.0 together with its complementary b ion at m/z 3591.0 confirm that the fucose is preferentially carried on the proximal GlcNAc residue of the N-glycan core, as opposed to being on either antenna. This was further supported by the presence of 4,6-linked GlcNAc within the GC-MS linkage analysis (see supplemental Table S3). The diagnostic b ions at m/z 935.1 and 1383.9 together with their corresponding y ions at m/z 3128.9 and 2680.6 are consistent with the glycosidic cleavage of LacNAc repeats. Additional y ion fragments (m/z 1781.4 and 2230.5) serve to further confirm the presence of long polyLacNAc extensions. These signals are also among the most prominent within the spectrum, suggesting that the most abundant isoform for the molecular ion at m/z 4040.9 is an extended bi-antennary N-glycan with five LacNAc units on one arm and one on the other. Overall, however, the mass at 4040.9 consists of a heterogeneous mixture of bi-, tri-, and tetra-antennary glycans with varying lengths of polyLacNAc extension, as indicated by the presence of signals consistent with multiple glycosidic cleavages that reveal the extent of the branching on the core. Peaks at m/z 1767.3, 2217.3, 2665.7, and 3114.3 establish that there are two branching points in the molecule (thus a tri-antennary N-glycan), whereas a minor signal at m/z 2203.5 ((OH)3Fuc1Hex5HexNAc4, three branching points), implies the presence of a small amount of tetra-antennary N-glycans.
FIGURE 5.
MALDI-TOF/TOF MS/MS spectrum of the permethylated N-glycan at m/z 4040. 9, derived from the N-glycan spectrum of wild type CHO cells grown in suspension (Fig. 4, highlighted in yellow). Assignments of the fragment ions generated and alternative antennal arrangements are shown. The ion highlighted in red represents the cleavage of multiple antennae in a fashion that does not facilitate clear annotation.
These interpretations were further confirmed by endo-β-galactosidase digestion of wild type CHO samples prior to permethylation. This enzyme acts to preferentially cleave the β1–4 linkage of unbranched, repeating polyLacNAc structures (GlcNAcβ1–3Galβ1–4)n (14). Endo-β-galactosidase treatment gave rise to signals at m/z 518, 722, and 1083 (data not shown), corresponding to the release of internal HexNAcHex from polyLacNAc repeats, nonreducing HexHexNAcHex from polyLacNAc antennae, and terminal NeuAcHexHexNAcHex. The presence of these abundant signals, along with the lack of any 3,6-linked galactose in linkage analysis data, confirms that polyLacNAc chains were linear, rather than branched. Additionally, information regarding the number of antennae that are extended by polyLacNAc chains can be inferred by using signals corresponding to the enzyme-trimmed core structures. For example, a signal at m/z 1836.0 corresponds to a core-fucosylated, bi-antennary N-glycan with both antennae trimmed by the action of endo-β-galactosidase. Similarly, a signal at m/z 2081.1 demonstrates that each arm of a tri-antennary structure can be extended, and m/z 2326.3 confirms that CHO cells can extend all four of their antennae with LacNAc repeats.
In summary, the Pro−5 strain of CHO cells synthesizes an unexpectedly broad range of complex N-glycans, oligomannose N-glycans, very few hybrid N-glycans, and a simple set of mucin O-glycans. Other less abundant O-glycans, including O-mannose or O-fucose glycans, were not detected as obvious peaks but could be detected by MS/MS analysis of species of the expected mass (data not shown). Trace amounts of NeuGc are present in CHO glycans, but the major sialic acid is NeuAc. Many N-glycans carry a core fucose, and none carry more than one fucose.
CHO Glycans Lacking a Single Sugar, Lec2 (Sialic Acid) and Lec13 (Fucose)
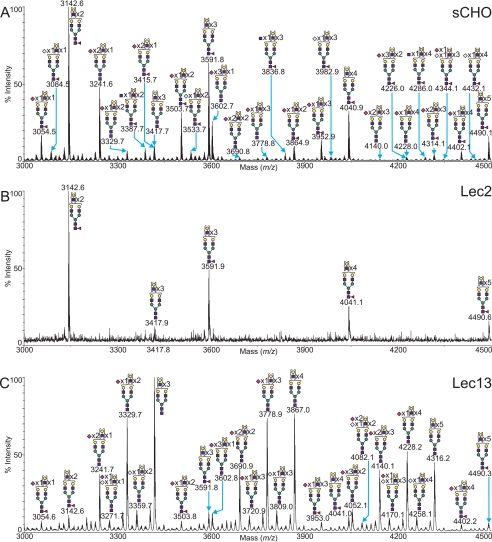
CHO cell mutants that belong to the Lec2 complementation group have a mutation in the Slc35a1 open reading frame and are unable to translocate CMP-sialic acid into the lumen of the Golgi apparatus, resulting in markedly reduced levels of sialylation of glycoproteins and gangliosides (23). A selected mass range comparison between a typical MALDI-TOF MS profile of the permethylated N-glycans from Lec2 CHO cells and those from wild type CHO cells grown in suspension is shown in Fig. 6. The N-glycans from Lec2 cells were consistent with the mutation, and no sialylated species were observed (supplemental Table S1). This is interesting because previous analyses have shown that glycoconjugates made by Lec2 cells have a small amount of sialic acid (24, 25). The most abundant glycans produced by the Lec2 CHO mutant were a series of asialo, core-fucosylated N-glycans, possessing between 2 and 7 LacNAc units (Fuc1Hex5–10HexNAc4–9). The O-glycan profile of the Lec2 CHO mutant (data not shown) was similarly affected by the alteration in sialylation of glycoconjugates. Only the unsubstituted core 1 structure was observed at m/z 534.0 (supplemental Table S2).
FIGURE 6.
Selected mass range comparison between the MALDI-TOF MS profiles of the permethylated N-glycans derived from wild type sCHO cells (A), Lec2 sCHO (B), and Lec13 sCHO (C). For complete annotation of the spectra, see supplemental Table S1. Data were obtained from the 50% MeCN fraction, and all molecular ions are present in sodiated form ([M + Na]+).
Lec13 mutant CHO cells exhibit reduced expression of the Gmd gene, resulting in a decrease in GDP-Man-4,6-dehydratase activity and concomitant decreases in levels of GDP-fucose and fucosylated glycans (26–28). Fig. 6 compares a selected mass range between the MALDI-TOF MS profiles of permethylated N-glycans derived from Lec13 mutant and wild type CHO cells grown in suspension. There is a dramatic decrease in the level of fucosylated N-glycans in Lec13, with an increase in the relative abundance of the related, nonfucosylated N-glycans. This is exemplified by comparison of the peaks at m/z 3417.8 (Hex8HexNAc7) and 3591.8 (Fuc1Hex8HexNAc7). The wild type sCHO sample shows an approximate fucosylated-to-nonfucosylated ratio of 5.3:1, whereas the Lec13 mutant exhibits the reverse with a fucosylated-to-nonfucosylated ratio of 0.125:1. Nevertheless, fucose was transferred to Lec13 N-glycans (Fig. 6 and supplemental Table S1), an observation further confirmed by GC-MS linkage analysis showing trace levels of terminal fucose and 4,6-linked GlcNAc (see supplemental Table S3). Consistent with this, Lec13 cells bound a small amount of the lectins Pisum sativum agglutinin and Aleuria aurantica lectin, even when grown in dialyzed serum (supplemental Fig. S1). However, Lec13 cells did not bind antibodies that recognize fucose on N-glycan antennae (supplemental Fig. S1). The transfer of a small amount of fucose by Lec13 cells could be due to a number of factors, including the Lec13 mutation being “leaky,” the presence of trace amounts of fucose from serum glycoproteins being utilized by a scavenger pathway (29), or the presence of a low frequency of revertants in the population (30). Other studies have reported small amounts of GDP-fucose in Lec13 cells (31). Evidence for trace levels of N-glycans with a bisecting GlcNAc was also obtained in the Lec13 MALDI-TOF profile, with GC-MS linkage data showing very low relative abundance of 3,4,6-linked mannose. The most abundant N-glycans produced by the Lec13 CHO mutant were a series of asialo, mono-, or di-sialylated core nonfucosylated glycans, possessing between 2 and 18 LacNAc units (NeuAc0–3Hex5–21HexNAc4–20).
The O-glycan profile of Lec13 (supplemental Table S2) was unaffected by the fucosylation defect, although it should be noted that O-fucose glycans synthesized by CHO cells (32) are affected5 but were of such low abundance as to only be observed by MS/MS analysis in spectra of wild type CHO cells (data not shown).
CHO N-Glycans with Altered Branching, Lec4 and LEC10
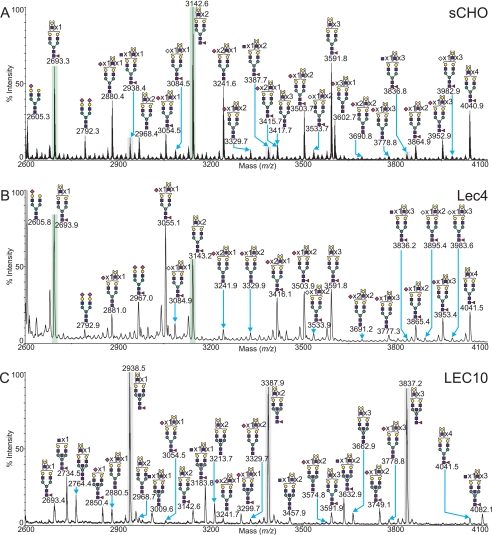
Lec4 CHO mutants result from mutation of the Mgat5 gene open reading frame leading to loss of the ability to make GlcNAcβ(1,6)Manα(1,6)-branched N-glycans catalyzed by GlcNAcT-V (2, 33). MALDI-TOF MS profiling of permethylated N-glycans released from Lec4 CHO glycoproteins produced an altered fingerprint when compared with the wild type (Fig. 7). The ratios of the abundance of N-glycans carrying multiple LacNAc units and thus probable multiantennary N-glycans were characteristically different, with a shift toward potential bi- and tri-antennary N-glycans rather than putative tetra-antennary N-glycans. A good example of this characteristic feature is the comparison between the relative abundances of a potential tri-antennary glycan (m/z 2693, Fuc1Hex6HexNAc5) and that of a related potential tetra-antennary structure (m/z 3143, Fuc1Hex7HexNAc6). These peaks are highlighted in green to aid comparison in Fig. 7. The ratio has shifted from 3:5 in the wild type in favor of the putative tetra-antennary N-glycan, to 3:1 in favor of the putative tri-antennary N-glycan in the Lec4 mutant. These data indicate that the Lec4 mutant has a reduced ability to create multiantennary structures, an observation further borne out by GC-MS linkage analysis (see supplemental Table S3), which showed that the cell line did not produce 2,6-linked mannose, consistent with the absence of GlcNAcT-V. For a summary of the N-glycans observed, see supplemental Table S1. It can be seen that despite the lack of a β1,6-branch, the mutant still produces large N-glycans bearing between 2 and 20 LacNAc units (Fuc1Hex5–23HexNAc4–22). This demonstrates that the polyLacNAc extensions occur on other antennae in the absence of the β1,6-GlcNAc branch. The O-glycan profile of the Lec4 CHO mutant (supplemental Table S2) is unaffected by the loss of GlcNAcT-V as expected, and it was identical to that observed in the wild type sCHO sample (Fig. 3A).
FIGURE 7.
Selected mass range comparison between the MALDI-TOF MS profiles of the permethylated N-linked glycans derived from CHO cells grown in suspension (A), the Lec4 mutant cell line (B), and the LEC10 mutant cell line (C). Peaks highlighted in gray or green are presented as such for comparative purposes (see text). For complete annotation of the spectra, see supplemental Table S1. Data were obtained from the 50% MeCN fraction and all molecular ions are present in sodiated form ([M + Na]+).
LEC10 CHO cell mutants have a gain-of-function mutation, resulting from the activation of the Mgat3 gene (19, 20) that encodes GlcNAcT-III, the glycosyltransferase responsible for the addition of the bisecting GlcNAc residue linked β1–4 to the core mannose residue of N-glycans. Fig. 7 shows a MALDI-TOF MS selected mass range comparison between permethylated N-glycans derived from LEC10 mutant cells and wild type sCHO. It is evident that the LEC10 mutant has a drastically altered N-glycan profile, with each major constituent corresponding to a putative bisected structure (the three most abundant peaks in the mass range have been highlighted in gray in Fig. 7, along with their sCHO counterparts, to aid comparison). These could of course reflect truncated antennae missing a Gal residue, but not only were such species not observed in wild type sCHO N-glycans, the abundance of 3,4,6-linked mannose within the LEC10 GC-MS linkage data when compared with the sCHO samples (see supplemental Table S3) verifies that LEC10 N-glycans are predominantly modified with a bisecting GlcNAc residue, consistent with the expression of GlcNAcT-III in LEC10. The LEC10 mutant produces core-fucosylated N-glycans with a large number of LacNAc units (2–15, Fuc1Hex7–18HexNAc7–18), although significantly less than in the wild type sCHO sample. This may suggest that the addition of the bisecting GlcNAc inhibits polyLacNAc extension or β1,6-branching as has been proposed (34). However, GC-MS analysis revealed a considerable proportion of 2,6-linked Man consistent with β1,6-branching (supplemental Table S3). In addition, glycoproteins from LEC10 CHO cells bind L-PHA much better than CHO cells.6 For a summary of the N-glycans observed in LEC10, see supplemental Table S1. The O-glycan profile of the LEC10 CHO mutant (supplemental Table S2) is unaffected by the genetic modification and was identical to that observed in the wild type sCHO sample (Fig. 3A).
CHO Mutants That Lack Complex and Hybrid N-Glycans, Lec1 and Lec3.2.8.1
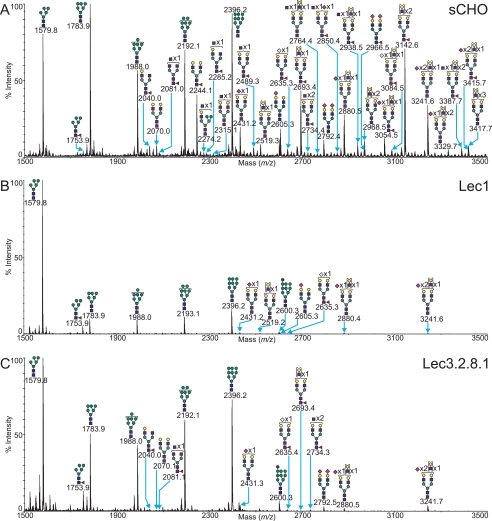
Lec1 mutants originate from an insertion or deletion within the Mgat1 gene open reading frame, resulting in a loss of GlcNAcT-I activity (17) and a mutant CHO cell incapable of synthesizing complex or hybrid N-glycans. A selected mass comparison between typical MALDI-TOF MS profiles of the permethylated N-glycans from Lec1 and wild type CHO cells grown in suspension is displayed in Fig. 8. The most prominent feature of the spectrum is the abundant Man5GlcNAc2 N-glycan at m/z 1579.9, which represents the accumulated substrate of GlcNAcT-1. In addition small amounts of Man5GlcNAc2Fuc1 were observed. By contrast, in wild type CHO cells Man8GlcNAc2 and Man9GlcNAc2 were the predominant high mannose N-glycans. Surprisingly, extremely small signals typical of complex N-glycans were observed. MS/MS analyses on these signals, together with GC-MS linkage data indicating trace levels of terminal galactose (see supplemental Table S3), confirmed a trace presence of N-glycans bearing limited LacNAc extensions with some sialylation. This is probably due to a very small degree of contamination of serum glycoproteins that carry complex N-glycans, because the Mgat1 mutation in the Lec1 mutant analyzed caused a loss of 203 C-terminal amino acids and generates an inactive enzyme (17). Alternatively, and although unlikely it cannot be ruled out, another glycosyltransferase may substitute for GlcNAcT-1 in its absence. For a summary of the N-glycans observed in Lec1, see supplemental Table S1. The O-glycan profile of the Lec1 CHO mutant (supplemental Table S2) is unaffected by the genetic modification and was identical to that observed in the wild type sCHO sample (Fig. 3A).
FIGURE 8.
Selected mass range comparison between the MALDI-TOF MS profiles of the permethylated N-linked glycans derived from wild type CHO cells grown in suspension (A), the Lec1 mutant cell line (B), and the Lec3. 2.8.1 mutant cell line (C). For complete annotation of the spectra, see supplemental Table S1. Data were obtained from the 50% MeCN fraction, and all molecular ions are present in sodiated form ([M + Na]+).
Lec3.2.8.1 is a CHO mutant carrying four glycosylation mutations corresponding to insertions/deletions in the Gne (Lec3), Slc35a1 (Lec2), Slc35a2 (Lec8), and Mgat1 (Lec1) open reading frames, respectively. This multiple glycosylation mutant gives rise to severely truncated N- and O-glycans (35, 36), and due to decreased activity of UDP-GlcNAc-2- epimerase, the CMP-sialic acid Golgi transporter, the UDP-Gal Golgi transporter, and GlcNAcT-I. MALDI-TOF MS profiles obtained from samples of this CHO mutant (Fig. 8C) are consistent with these mutations, with complex N-glycans being almost completely absent. However, as with the Lec1 mutant described above, small traces of signals consistent with the presence of complex N-glycans were observed. The Mgat1 mutation in this mutant removes 56 amino acids from the C terminus of GlcNAcT-1 (17). Therefore, Lec3.2.8.1 cells should have, if anything, more GlcNAcT-1 activity than the Lec1 mutant discussed above. The fact that the small traces of complex N-glycans are similar in Lec1 and Lec3.2.8.1 argues strongly that they arose from serum glycoprotein contamination. For a summary of the N-glycans observed, see supplemental Table S1.
The O-glycan profile of the Lec3.2.8.1 multiple glycosylation mutant CHO cells (supplemental Table S2) is bereft of signals, which is as predicted. The O-linked glycans should be truncated to a single GalNAc, which if unsubstituted proves difficult to detect using the methods utilized here. The absence of any larger O-glycans is a good indication that the mutations do indeed restrict the O-glycosylation to at most a single GalNAc. Therefore, recombinant glycoproteins made in Lec3.2.8.1 will have no complex or hybrid N-glycans and only O-GalNAc at O-glycan sites. The oligomannosyl N-glycans can be removed by endoglycosidase H thereby generating a glycoprotein with only GlcNAc at N-glycan sites and GalNAc at O-glycan sites. This has been used to advantage for the crystallization of highly glycosylated recombinant glycoproteins (37, 38).
CHO Cells with α-1,3-Fucose on Complex N-Glycans, LEC11, LEC12, and LEC30
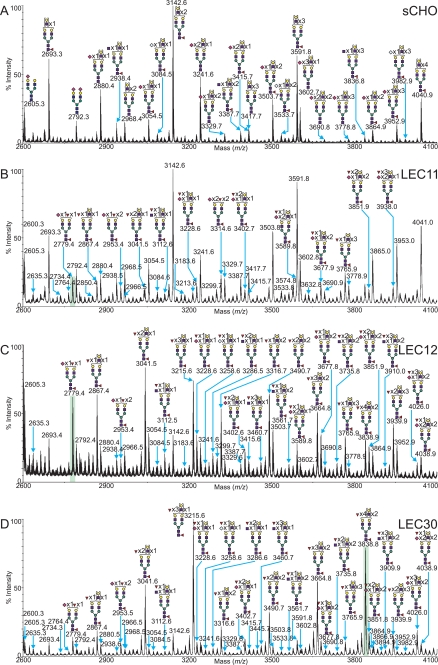
LEC11 gain-of-function CHO cell mutants express an α-1,3-fucosyltransferase (FucT-VIa or FucT-VIb) due to the activation of the Fut6 gene, thereby generating Lex, sLex, and VIM-2 antennal structures (4, 39). Comparison of the N-glycan profile exhibited by the LEC11 and wild type CHO cell lines (Fig. 9) demonstrates a substantial increase in fucosylation among the N-glycans of the gain-of-function mutant. The N-glycans observed in the sCHO sample carry no more than one fucose residue, which is preferentially added to the core rather than the antennae (Fig. 4 and Fig. 9A). By contrast, up to four fucose residues are present per N-glycan in the LEC11 complex N-glycan complement. GC-MS linkage analysis (see supplemental Table S3) also demonstrates an increase in both terminal fucose and 3,4-linked GlcNAc when compared with the sCHO wild type data, further corroborating the FucT gain-of-function. Overall, the most abundant complex structures in the N-glycan profile of the LEC11 cells were fucosylated, mono- or di-sialylated glycans, bearing between 2 and 16 LacNAc units (NeuAc0–2Fuc1–4Hex5–19HexNAc4–18). For a summary of the N-glycans observed, see supplemental Table S1. The O-glycan profile of the LEC11 CHO mutant (supplemental Table S2) was identical to that observed in the wild type sCHO sample (Fig. 3A).
FIGURE 9.
Selected mass range comparison between the MALDI-TOF MS profiles of the permethylated N-glycans derived from CHO cells grown in suspension (A), the LEC11 mutant cell line (B), the LEC12 mutant cell line (C), and the LEC30 mutant cell line (D). Only structures bearing multiple fucoses in the mutant samples are annotated with structures to simplify the presentation, although all other glycan peaks are labeled with their m/z values alone. For complete annotation of the spectra, see supplemental Table S1. Data were obtained from the 50% MeCN fraction, and all molecular ions are present in sodiated form ([M + Na]+).
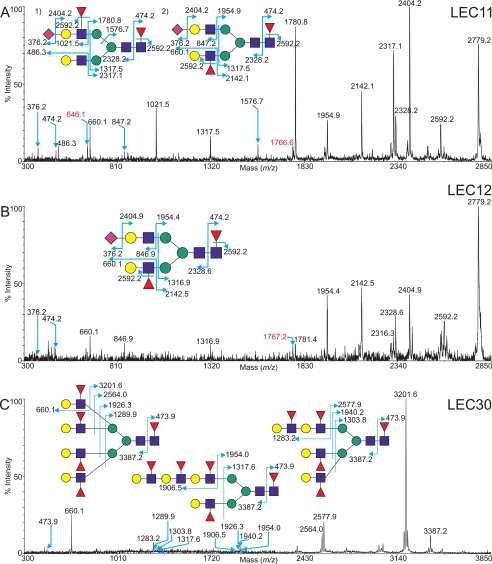
To define the position of the fucose in the N-linked profile of the LEC11 mutant cell line, MS/MS experiments were carried out. As exemplified in Fig. 10A (MS/MS profile of the molecular ion at m/z 2779.2, NeuAc1Fuc2Hex5HexNAc4), the diagnostic b ions at m/z 486.3, 660.1, 847.2, and 1021.5 together with the complementary y ions at m/z 2317.1, 2142.1, 1954.9, and 1780.8 implicate the presence of LacNAc, Lex, sialylated LacNAc, and sLex terminal structures, respectively. Careful analysis of the data provides evidence that the molecular ion at m/z 2779.2 consists of two main isomers, labeled 1) and 2) in Fig. 10A. The relative abundances of the most prevalent fragment ions (m/z 1780.8 and 1021.5, for example) suggests that isomer 1) in Fig. 10A is present in the greatest quantity. This structure is a core-fucosylated, bi-antennary N-glycan, with a simple LacNAc antenna on one arm and an sLex motif on the other. From these data, it is therefore possible to deduce that LEC11 mutants preferentially fucosylate in the context of sLex terminal epitopes once the core is fucosylated.
FIGURE 10.
Exemplar MALDI-tof/TOF data of fucosylated N-glycans. A, MS/MS spectra of the permethylated N-glycan at m/z 2779.2, derived from the N-linked spectrum of the LEC11 mutant cell line (Fig. 9B, highlighted), with the two main components of the peak indicated, a biantennary sialyl Lewisx containing structure 1) and a biantennary Lewisx glycan 2). B, MS/MS spectrum of the permethylated N-glycan at m/z 2779.2, derived from the N-linked spectrum of the LEC12 mutant cell line (Fig. 9C, highlighted). C, MS/MS spectrum of the permethylated N-glycan at m/z 3838.9, derived from the N-linked spectrum of the LEC30 mutant cell line (Fig. 9D, highlighted). Assignments of the fragment ions are shown. The ions highlighted in red represent the cleavage of multiple antennae in a fashion that does not facilitate clear annotation.
LEC12 CHO cells are gain-of-function mutants arising from the activation of the Fut9 gene, and they express FucT-IX activity (40). The LEC12 N-glycan profile (Fig. 9B) demonstrates both an increase in the relative abundance of fucosylation events, and an increase in the number of fucose residues attached to a single N-glycan, with up to seven such residues observed on a single structure. This is consistent with GC-MS linkage analysis (see supplemental Table S3), where the relative abundance of terminal fucose in the LEC12 sample is far greater than that of wild type sCHO cells. Evidence for trace levels of bisecting GlcNAc was also observed by GC-MS linkage analysis. Interestingly, sialylation was a relatively rare event, with only structures bearing a single NeuAc residue being observed. This is consistent with the addition of fucose precluding the addition of sialic acid and previous work showing that LEC12 cells express Lex and VIM-2 but not sLex epitopes (22). For a summary of the N-glycans observed in LEC12, see supplemental Table S1. The O-glycan profile of the LEC12 CHO mutant (supplemental Table S2) was identical to that observed in the wild type sCHO sample (Fig. 3A).
In similar fashion to the LEC11 analysis, MS/MS was once again employed to determine the location of the fucose residues in the LEC12 N-glycans. Fig. 10B shows the result of such an analysis upon the molecular ion at m/z 2779.2 (NeuAc1Fuc1Hex5HexNAc4). The data reveal a series of diagnostic b ions at m/z 660.1 and 846.9 and concomitant y ions at m/z 2142.5 and 1954.4. The presence of these signals, together with the absence of fragment ions at m/z 486 (Hex1HexNAc1) and 1021 (NeuAc1Fuc1Hex1HexNAc1), confirms the preference of LEC12 to fucosylate in the context of Lex structures rather than sLex once the core position is occupied, which is consistent with the specificity of FucT-IX (41). There is evidence for trace levels of sLex antennae, with very small y ion peaks observed at m/z 2316.3 and 1781.4, corresponding to the potential loss of an sLex antenna.
Activation of the Fut4 and Fut9 genes produces the gain-of-function mutant LEC30, which exhibits FucT-IV and FucT-IX α-1,3-fucosyltransferase activities (40). Fig. 9C displays a typical permethylated N-linked glycan mass spectrum derived from LEC30 cells, compared with the corresponding mass range from sCHO, LEC11, and LEC12 preparations. A significant increase in the level of fucosylation is evident, with single structures bearing up to 14 fucose residues in LEC30 N-glycans. Fucosylation of the polyLacNAc extensions was confirmed by GC-MS linkage analysis that demonstrated a significant increase in the levels of terminal fucose 3,4-linked GlcNAc when compared with the wild type (supplemental Table S3). This extremely high level of fucosylation sets the LEC30-fucosylated N-glycans apart from those in LEC11 or LEC12 cells and is presumably caused by the expression of both the Fut4 and Fut9 genes in LEC30 cells. Evidence for trace levels of bisecting GlcNAc was observed in the MALDI profile, with GC-MS linkage data showing very low relative abundance of 3,4,6-linked mannose. Overall, the LEC30 cells produced mono- or di-sialylated complex N-glycans, with between 2 and 13 LacNAc units bearing up to 14 fucose residues (NeuAc0–2Fuc1–14Hex5–16HexNAc4–15). For a summary of the LEC30 N-glycans observed, see supplemental Table S1. The O-glycan profile of the LEC30 CHO mutant (supplemental Table S2) was identical to that observed in the wild type sCHO sample (Fig. 3A).
An exemplar MS/MS analysis of a highly fucosylated N-glycan from LEC30 (m/z 3838.9, Fuc5Hex7HexNAc6) is shown in Fig. 10C. The fragment ions demonstrate that the glycan is present in multiple isoforms (bi-, tri-, and tetra-antennary), with fucose residues attached to every LacNAc unit giving terminal Lex and a high probability of extended VIM-2 epitopes. Clearly, LEC30 is the cell of choice for generating recombinant glycoproteins with a large proportion of nonsialylated, α1,3-fucosylated N-glycans.
Summary
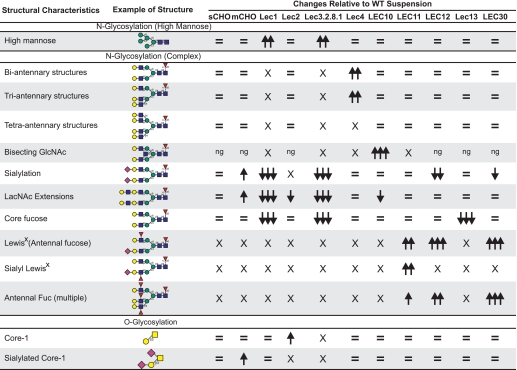
The general conclusions of these analyses are summarized in Table 2. All the data presented here have been deposited in the Core C data base of the Consortium for Functional Glycomics (42, 43) and are available on line. It is apparent that CHO cells can make very large N-glycans with up to 26 LacNAc units. As mass spectrometers increase in sensitivity, even larger masses may be detected. The number of LacNAc units was reduced in Lec2, and more markedly reduced in LEC12 and LEC30 N-glycans, suggesting that terminal addition of sialic acid facilitates polylactosamine extension on antennae that themselves do not receive sialic acid, although fucose on a LacNAc unit reduces polyLacNAc extension. It is of interest that N-glycans from most lines derived from Pro−5 CHO cells exhibited trace amounts of N-glycans with the bisecting GlcNAc as confirmed by GC-MS analysis. These did not appear to be due to contamination of serum glycoproteins because the contaminating N-glycans in Lec1 and Lec3.2.8.1 N-glycans did not contain the bisecting GlcNAc. Because reverse transcription-PCR did not detect Mgat3 transcripts in Pro−5 RNA and Pro−5 cells have no GlcNAcT-III activity (19), this reflects the superior sensitivity of mass spectrometry to detect very low levels of GlcNAcT-III activity.
TABLE 2.
Summary table of the structural changes observed in the analysis of CHO mutants
The structural alterations shown here are based upon MALDI-TOF/TOF MS and MS/MS data. X, not detected; Ng, negligible amounts; =, no significant changes; upward arrows indicate an increase; downward arrows indicate a decrease; the number of arrows is indicative of the magnitude of change with three arrows being the greatest (>75%) and one arrow being the smallest (<25%) percentage change from wild type CHO grown in suspension. Linkages are assigned according to known biosynthetic pathways.
Acknowledgment
Core C acknowledges the contributions of M-Scan Inc. (West Chester, PA).
This work was supported, in whole or in part, by National Institutes of Health Grant RO1-36434 from NCI (to P. S.). This work was also supported by Analytical Glycotechnology Core (Core C) of the Consortium for Functional Glycomics Grant GM 62116, Biotechnology and Biological Sciences Research Council Grants BBF0083091 and B19088, and the Wellcome Trust.

The on-line version of this article (available at http://www.jbc.org) contains supplemental “Materials,” Fig. S1, and Tables S1–S3.
R. S. Haltiwanger, personal communication.
R. Bhattacharrya and P. Stanley, unpublished observations.
- CHO
- Chinese hamster ovary
- GC-MS
- gas chromatography-mass spectrometry
- PBS
- phosphate-buffered saline
- CHAPS
- 3-[(3-cholamidopropyl)dimethylammonio]-1-propanesulfonic acid
- HexNAc
- N-acetylhexosamine
- LacNAc
- Galβ1–4GlcNAc
- Lex
- Lewisx
- MALDI
- matrix-assisted laser desorption ionization
- mCHO
- CHO cells grown in monolayer
- NeuGc
- N-glycolylneuraminic acid
- MS
- mass spectrometry
- MS/MS
- tandem mass spectrometry
- sCHO
- CHO cells grown in suspension
- sLex
- sialyl Lewisx
- TOF
- time of flight
- VIM-2
- Verona integron-encoded metallo-β-lactamase-2.
REFERENCES
- 1.Patnaik S. K., Stanley P. (2006) Methods Enzymol. 416, 159–182 [DOI] [PubMed] [Google Scholar]
- 2.Stanley P. (1984) Annu. Rev. Genet. 18, 525–552 [DOI] [PubMed] [Google Scholar]
- 3.Narasimhan S. (1982) J. Biol. Chem. 257, 10235–10242 [PubMed] [Google Scholar]
- 4.Howard D. R., Fukuda M., Fukuda M. N., Stanley P. (1987) J. Biol. Chem. 262, 16830–16837 [PubMed] [Google Scholar]
- 5.Babu P., North S. J., Jang-Lee J., Chalabi S., Mackerness K., Stowell S. R., Cummings R. D., Rankin S., Dell A., Haslam S. M. (2009) Glycoconj. J. 26, 975–986 [DOI] [PMC free article] [PubMed] [Google Scholar]
- 6.Kawar Z. S., Haslam S. M., Morris H. R., Dell A., Cummings R. D. (2005) J. Biol. Chem. 280, 12810–12819 [DOI] [PubMed] [Google Scholar]
- 7.Lee J., Park S. H., Sundaram S., Raju T. S., Shaper N. L., Stanley P. (2003) Biochemistry 42, 12349–12357 [DOI] [PubMed] [Google Scholar]
- 8.Sutton-Smith M., Dell A. (2006) in Cell Biology: A Laboratory Handbook (Celis J. E. ed) pp. 415–424, Academic Press, San Diego [Google Scholar]
- 9.Dell A., Reason A. J., Khoo K. H., Panico M., McDowell R. A., Morris H. R. (1994) Methods Enzymol. 230, 108–132 [DOI] [PubMed] [Google Scholar]
- 10.Albersheim P., Nevins D. J., English P. D., Karr A. (1967) Carbohydr. Res. 5, 340–345 [Google Scholar]
- 11.Goldberg D., Sutton-Smith M., Paulson J., Dell A. (2005) Proteomics 5, 865–875 [DOI] [PubMed] [Google Scholar]
- 12.Ceroni A., Maass K., Geyer H., Geyer R., Dell A., Haslam S. M. (2008) J. Proteome Res. 7, 1650–1659 [DOI] [PubMed] [Google Scholar]
- 13.Wada Y., Azadi P., Costello C. E., Dell A., Dwek R. A., Geyer H., Geyer R., Kakehi K., Karlsson N. G., Kato K., Kawasaki N., Khoo K. H., Kim S., Kondo A., Lattova E., Mechref Y., Miyoshi E., Nakamura K., Narimatsu H., Novotny M. V., Packer N. H., Perreault H., Peter-Katalinic J., Pohlentz G., Reinhold V. N., Rudd P. M., Suzuki A., Taniguchi N. (2007) Glycobiology 17, 411–422 [DOI] [PubMed] [Google Scholar]
- 14.Fukuda M. N., Matsumura G. (1976) J. Biol. Chem. 251, 6218–6225 [PubMed] [Google Scholar]
- 15.Goldberg D., Bern M., North S. J., Haslam S. M., Dell A. (2009) Bioinformatics 25, 365–371 [DOI] [PMC free article] [PubMed] [Google Scholar]
- 16.Bardor M., Nguyen D. H., Diaz S., Varki A. (2005) J. Biol. Chem. 280, 4228–4237 [DOI] [PubMed] [Google Scholar]
- 17.Chen W., Stanley P. (2003) Glycobiology 13, 43–50 [DOI] [PubMed] [Google Scholar]
- 18.Varki A. (2008) Trends Mol. Med. 14, 351–360 [DOI] [PMC free article] [PubMed] [Google Scholar]
- 19.Stanley P., Sundaram S., Tang J., Shi S. (2005) Glycobiology 15, 43–53 [DOI] [PubMed] [Google Scholar]
- 20.Campbell C., Stanley P. (1984) J. Biol. Chem. 259, 13370–13378 [PubMed] [Google Scholar]
- 21.Sallustio S., Stanley P. (1989) Somat. Cell Mol. Genet. 15, 387–400 [DOI] [PubMed] [Google Scholar]
- 22.Potvin B., Stanley P. (1991) Cell Regul. 2, 989–1000 [DOI] [PMC free article] [PubMed] [Google Scholar]
- 23.Eckhardt M., Gotza B., Gerardy-Schahn R. (1998) J. Biol. Chem. 273, 20189–20195 [DOI] [PubMed] [Google Scholar]
- 24.Stanley P., Sudo T., Carver J. P. (1980) J. Cell Biol. 85, 60–69 [DOI] [PMC free article] [PubMed] [Google Scholar]
- 25.Lim S. F., Lee M. M., Zhang P., Song Z. (2008) Glycobiology 18, 851–860 [DOI] [PMC free article] [PubMed] [Google Scholar]
- 26.Ohyama C., Smith P. L., Angata K., Fukuda M. N., Lowe J. B., Fukuda M. (1998) J. Biol. Chem. 273, 14582–14587 [DOI] [PubMed] [Google Scholar]
- 27.Sullivan F. X., Kumar R., Kriz R., Stahl M., Xu G. Y., Rouse J., Chang X. J., Boodhoo A., Potvin B., Cumming D. A. (1998) J. Biol. Chem. 273, 8193–8202 [DOI] [PubMed] [Google Scholar]
- 28.Ripka J., Adamany A., Stanley P. (1986) Arch. Biochem. Biophys. 249, 533–545 [DOI] [PubMed] [Google Scholar]
- 29.Becker D. J., Lowe J. B. (2003) Glycobiology 13, 41R–53R [DOI] [PubMed] [Google Scholar]
- 30.Chen W., Tang J., Stanley P. (2005) Glycobiology 15, 259–269 [DOI] [PubMed] [Google Scholar]
- 31.Kanda Y., Yamane-Ohnuki N., Sakai N., Yamano K., Nakano R., Inoue M., Misaka H., Iida S., Wakitani M., Konno Y., Yano K., Shitara K., Hosoi S., Satoh M. (2006) Biotechnol. Bioeng. 94, 680–688 [DOI] [PubMed] [Google Scholar]
- 32.Moloney D. J., Shair L. H., Lu F. M., Xia J., Locke R., Matta K. L., Haltiwanger R. S. (2000) J. Biol. Chem. 275, 9604–9611 [DOI] [PubMed] [Google Scholar]
- 33.Weinstein J., Sundaram S., Wang X., Delgado D., Basu R., Stanley P. (1996) J. Biol. Chem. 271, 27462–27469 [DOI] [PubMed] [Google Scholar]
- 34.Zhao Y., Sato Y., Isaji T., Fukuda T., Matsumoto A., Miyoshi E., Gu J., Taniguchi N. (2008) FEBS J. 275, 1939–1948 [DOI] [PubMed] [Google Scholar]
- 35.Hong Y., Stanley P. (2003) J. Biol. Chem. 278, 53045–53054 [DOI] [PubMed] [Google Scholar]
- 36.Stanley P. (1989) Mol. Cell. Biol. 9, 377–383 [DOI] [PMC free article] [PubMed] [Google Scholar]
- 37.Butters T. D., Sparks L. M., Harlos K., Ikemizu S., Stuart D. I., Jones E. Y., Davis S. J. (1999) Protein Sci. 8, 1696–1701 [DOI] [PMC free article] [PubMed] [Google Scholar]
- 38.Wang J. H., Smolyar A., Tan K., Liu J. H., Kim M., Sun Z. Y., Wagner G., Reinherz E. L. (1999) Cell 97, 791–803 [DOI] [PubMed] [Google Scholar]
- 39.Zhang A., Potvin B., Zaiman A., Chen W., Kumar R., Phillips L., Stanley P. (1999) J. Biol. Chem. 274, 10439–10450 [DOI] [PubMed] [Google Scholar]
- 40.Patnaik S. K., Zhang A., Shi S., Stanley P. (2000) Arch. Biochem. Biophys. 375, 322–332 [DOI] [PubMed] [Google Scholar]
- 41.Nishihara S., Iwasaki H., Kaneko M., Tawada A., Ito M., Narimatsu H. (1999) FEBS Lett. 462, 289–294 [DOI] [PubMed] [Google Scholar]
- 42.Raman R., Raguram S., Venkataraman G., Paulson J. C., Sasisekharan R. (2005) Nat. Methods 2, 817–824 [DOI] [PubMed] [Google Scholar]
- 43.Raman R., Venkataraman M., Ramakrishnan S., Lang W., Raguram S., Sasisekharan R. (2006) Glycobiology 16, 82R–90R [DOI] [PubMed] [Google Scholar]
- 44.Solter D., Knowles B. B. (1978) Proc. Natl. Acad. Sci. U.S.A. 75, 5565–5569 [DOI] [PMC free article] [PubMed] [Google Scholar]


