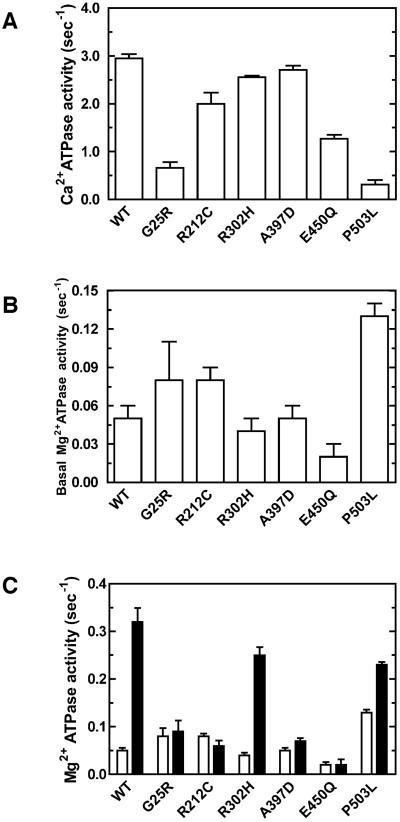
Figure 2. Ca2+ATPase and the actin-activated Mg2+ATPase activity of USH1B mutants.
A. Ca2+ATPase activity. Ca2+ATPase activity was measured in the buffer containing 600 mM KCl, 30 mM Tris-HCl (pH 8.5), 10 mM MgCl2, 2 mM phosphoenol pyruvate, 20 unit/ml pyruvate kinase, 0.2 mg/ml calmodulin, 20 nM HuM7AIQ2 and 2 mM ATP at 25 °C. B. Basal Ma2+-ATPase activity of USH1B mutants. The ATPase activity was measured in the buffer containing 50 mM KCl, 20 mM MOPS-KOH (pH 7.5), 2 mM MgCl2, 1 mM EGTA, 2 mM phosphoenol pyruvate, 20 unit/ml pyruvate kinase, 0.2 mg/ml calmodulin, 20 nM HuM7AIQ2 and 2 mM MgATP at 25 °C. C. The actin-activated Mg2+ATPase activity in the presence of 30 μM actin. Open bars, in the absence of actin; closed bars, in the presence of 30 μM actin. The error bars indicate S.D. for n=3 from three independent preparations.

