

Abstract
Head direction (HD) cells in the rat anterodorsal thalamic nucleus (ADN) fire relative to the animal's directional heading. Lesions of the entire vestibular labyrinth have been shown to severely alter VIIIth nerve input and disrupt these HD signals. To assess the specific contributions of the semicircular canals without altering tonic VIIIth nerve input, ADN cells were recorded from chinchillas after bilateral semicircular canal occlusion. Although ADN HD cells (and also hippocampal place cells and theta cells) were identified in intact chinchillas, no direction-specific activity was seen after canal occlusions. Instead, “bursty” cells were observed that exhibited burst-firing patterns similar to normal HD cells but with firing unrelated to the animal's actual head direction. Importantly, when pairs of bursty cells were recorded, the temporal order of their firing was dependent on the animal's turning direction, as is the case for pairs of normal HD cells. These results suggest that bursty cells are actually disrupted HD cells. The present findings further suggest that the HD cell network is still able to generate spiking activity after canal occlusions, but the semicircular canal input is critical for updating the network activity in register with changes in the animal's HD.
Introduction
Cells in the anterodorsal thalamic nucleus (ADN) of the rat exhibit firing activity related to the animal's directional heading independent of its ongoing behavior and spatial location (Taube, 1995, 2007). These cells are referred to as head direction (HD) cells, and their activity is thought to represent the animal's perceived orientation in an environment. Although HD cells rely strongly on input generated by allothetic (external) cues to maintain a stable preferred firing direction over time (Taube et al., 1990a), idiothetic (internal) cues have also been shown to affect HD cell stability (Knierim et al., 1995, 1998; Taube and Burton, 1995; Blair and Sharp, 1996). For example, HD cells maintain a stable firing direction over many minutes while the animal locomotes through a dark environment, devoid of external cues (Goodridge et al., 1998). This finding suggests that, when required, the animal is able to use some internal cue(s) to keep track of its location and orientation over time in a form of navigation known as “path integration ” (Gallistel, 1990).
One potential source of such internal information is the vestibular system. Multisynaptic connections from the vestibular nuclei → nucleus prepositus/supragenual nuclei → dorsal tegmental nucleus of Gudden (DTN) → lateral mammillary nuclei (LMN) → ADN may convey information regarding the animal's self-motion to the HD cell system (Sharp et al., 2001a; Reti et al., 2002; Brown et al., 2005; Taube, 2007). Consistent with this view, both DTN and LMN contain neurons that are modulated by the animal's angular head velocity (AHV) (Stackman and Taube, 1998; Bassett and Taube, 2001; Sharp et al., 2001b), and lesions of DTN or LMN both abolish HD cell activity in the ADN (Blair et al., 1999; Bassett et al., 2007) and impair navigational performance (Vann, 2005; Frohardt et al., 2006). Furthermore, permanent and temporary lesions of the entire vestibular labyrinth abolish direction-specific firing in rat ADN HD cells (Stackman and Taube, 1997; Stackman et al., 2002) and location-dependent firing in hippocampal place cells (Stackman et al., 2002; Russell et al., 2003a) and disrupt performance on navigation tasks (Ossenkopp and Hargreaves, 1993; Stackman and Herbert, 2002; Wallace et al., 2002; Russell et al., 2003b). Chemical labyrinthectomy methods (Stackman and Taube, 1997; Stackman et al., 2002) affect hair cells throughout the labyrinth and cause degeneration of the VIIIth nerve (Anniko and Wersäll, 1976; Chen et al., 1986), which likely affects the firing patterns of vestibular neurons. As a result, it is difficult to determine the precise origin of the disruption within the vestibular system. We recorded from ADN cells in freely moving chinchillas with bilateral occlusion (or “plugging”) of their semicircular canals to better assess the contributions of specific vestibular components to the HD signal without the side effects that accompany labyrinthectomies. Chinchillas were chosen because of their large, relatively accessible semicircular canals compared with rats, and plugging their semicircular canals has been shown to alter the gain and phase of the vestibulo-ocular reflex (VOR) and vestibular afferent activity in response to rotations (Gilchrist et al., 2000; Plotnik et al., 2002; Della Santina et al., 2005a). At the conclusion of neuronal recording, the VOR of canal-plugged animals was tested to verify canal occlusion.
Portions of these data have been published previously in abstract form at the Society for Neuroscience Annual Meetings (Muir and Taube, 2002; Muir et al., 2004; Brown et al., 2006).
Materials and Methods
Surgical and single-unit recording procedures
Fifteen male chinchillas (527–820 g) were anesthetized using isoflurane and a moveable microdrive containing a bundle of 10 25-μm Formvar-insulated nichrome wires threaded through a stainless steel cannula was implanted bilaterally (n = 6) or into the right ADN (n = 9). Because no chinchilla stereotaxic brain atlas is currently available, coordinates were determined using slides of 50 μm chinchilla brain slices containing stereotaxic reference points. As a consequence of this method, a range exists in the final coordinates used for the ADN implants (in mm relative to bregma with lambda and bregma in the same horizontal plane): anteroposterior, −1.60 to −1.70; mediolateral, 1.50 to 1.55; dorsoventral, 4.70 to 5.50. Of these 15 animals, four animals served as controls and did not undergo canal plugging, five animals received bilateral plugging of all semicircular canals (all canal plugged) either before (n = 1) or after (n = 4) microdrive implantation, and six animals received bilateral plugging of both horizontal canals only (horizontal canal plugged; n = 3) or all superior and posterior canals only (superior/posterior canal plugged; n = 3) after electrode implantation. The microdrive was constructed as in previous studies (Kubie, 1984) and could move the electrodes in the dorsoventral plane. Semicircular canals were plugged using a technique similar to that used previously in chinchilla (Plotnik et al., 2002) and monkey (Angelaki et al., 1996). Briefly, holes were drilled in the dorsal and mastoid parts of the bulla to expose the superior, and posterior and horizontal canals, respectively. The canals were then plugged by drilling a small hole in the bony labyrinth over the canal and inserting muscle fascia from around the scalp incision (supplemental Fig. 1, available at www.jneurosci.org as supplemental material). After canal plugging, the bulla were reconstructed using Grip Cement (Dentsply), and small plastic jars were cemented around the microdrive to prevent the fine dust used by chinchillas in their daily dust baths from clogging the microdrive assembly (chinchillas require frequent dust baths to enable them to maintain effective thermoregulation). All procedures were conducted under an institutionally approved animal care and use protocol.
After surgical recovery of 1–2 weeks, neural recordings were made in one of two physically identical recording rooms while animals foraged for randomly distributed food pellets in a gray cylindrical chamber (76 cm diameter; 71.2 cm height) that contained a prominent white cue card occupying ∼100° arc attached to the cylinder wall. The cylinder was surrounded by a floor-to-ceiling circular black curtain. An overhead video camera and automated tracking system (Ebtronics) tracked the animal's movement by monitoring the position of red and green light-emitting diodes (LEDs) attached over the animal's head at 60 Hz. The LEDs were 10 cm apart and aligned along the animal's longitudinal axis. Neural recordings were amplified (20,000×), filtered (300–10,000 Hz), and passed through a series of window discriminators, which detected the occurrence of a spike. Spikes were then either timestamped from the beginning of the session (in recording room 2) or were passed through a spike counter, which recorded the number of spikes that occurred during each video frame ( s) (in recording room 1).
When a cell of interest was identified, it was first recorded for 8 min in the cylinder (“standard 1”). Then the animal was removed from the cylinder and placed in an opaque box with a lid. The cue card was rotated either 90° clockwise (CW) or counterclockwise (CCW), and the animal was returned to the apparatus after undergoing a short disorientation period that involved slowly rotating and translating the box. Cells were recorded again for 8 min (“rotation session”). This session was followed by a second standard session (“standard 2”) in which the cue card was returned to its original position. Similar procedures were used between the rotation and standard 2 sessions in that the animal was removed from the apparatus and disoriented before being returned to it for the next session. The floor paper was changed between all sessions.
Data analyses
Before canal plugging, neurons that exhibited firing clearly related to the animal's head direction (HD cells), location (place cells), or to its movement velocity (theta cells) were initially selected for recording. These cells were subsequently characterized and their firing properties quantified using analyses specific to the cell type. In addition, several cells with no discernable behavioral correlate or spiking pattern were recorded for comparative purposes. For all analyses, means are reported along with SEM.
HD cells
Using the x,y coordinates of the LEDs, the animal's HD was sorted into 60 6° bins and then correlated with cell activity. Two types of plots were constructed: (1) firing rate versus HD and (2) number of spikes and HD versus time. For the latter plot, we determined the number of spikes and mean HD for every 10 consecutive samples (166.67 ms).
From the HD/# of spikes versus time plot, we computed the following parameters:
Maximum firing rate.
This is the maximum firing rate (spikes per second) of the cell, regardless of HD, based on the 166.67 ms sample with the highest firing rate in the session.
Mean firing rate.
Mean firing rate is the average firing rate of the cell over the entire recording session.
From the firing rate versus HD plot, we computed the following parameters:
Peak firing rate.
This includes the firing rate × HD bin with the highest firing rate.
Preferred firing direction.
A triangular function was used to approximate the HD at which the highest firing rate occurred to avoid deviations caused by small fluctuations in the raw firing rate × HD function (Taube et al., 1990b).
Directional firing range.
Directional firing range is defined as the width of the base of the best-fit triangular function for the firing rate × HD tuning curve.
Background firing rate.
This is the average firing rate of all bins that were >18° away from the directional firing range of the cell.
Information content.
Directional information content is a measure of how much HD information (in bits) is conveyed by a single spike and was calculated by the following formula: directional information content = Σpi (λi/λ) log2 (λi/λ), where pi is the probability that the head pointed in the ith directional bin, λi is the mean firing rate for bin i, and λ is the mean firing rate across all directional bins (Skaggs et al., 1993).
Mean vector length.
Mean vector length (Rayleigh's r) is a measure of the non-uniformity (or directionality) of the HD × firing rate function and can vary between 0 (a uniform distribution) and 1 (a non-uniform distribution) (Zar, 1999). Based on previous data (Yoder and Taube, 2009) and subjective assessment of the firing rate × HD plots, a criterion of r ≥ 0.40 was determined to represent a significantly directionally modulated cell. Mean vector length can also be used in the Rayleigh's test to determine the extent of uniformity in the distribution of firing rate bins. The angular deviation of the vector (s; the circular analog of linear SD) was also calculated, ranging from 0° (no dispersion of values) to ∼81° (maximally dispersed values).
Anticipatory time interval.
For anticipatory time interval (ATI), when firing rate versus HD tuning curves are constructed based on CW and CCW directions, the two curves are slightly offset from each other. This shift represents the fact that normal HD cells in the rat ADN are slightly anticipatory by ∼25 ms (Blair et al., 1997; Taube and Muller, 1998) and fire just before the animal's head reaches the preferred firing direction of the cell. This time shift was calculated using the ATI calculation method by Blair et al. (1997).
Preferred firing direction shift.
The shift in the preferred firing direction was measured (in degrees) between the following sessions: standard 1 to rotation, rotation to standard 2, and standard 1 to standard 2. During the rotation session after standard 1, the cue card was rotated 90° CCW or CW after the animal was removed from the cylinder. The animal was then returned to the cylinder after a 1 min period of slow spinning in a covered, opaque box. At the conclusion of the rotation session, the animal was placed back in the opaque box, the cue card was returned to its original location, and the animal was reintroduced to the cylinder for a third session (standard 2). The ATI and preferred firing direction shift analyses were based on the preferred firing direction of the cell and could therefore only be conducted on cells determined to be significantly directional (i.e., Rayleigh's r > 0.40).
Burst analyses were conducted using two methods because of the different spike acquisition systems used in the two recording rooms. For all recording sessions, the following analyses defined a “burst” as a minimum of three consecutive 166.67 ms samples containing firing. The first analysis was HD at peak of the burst (Rayleigh's r). The HD at the peak of each burst (i.e., the 166.67 ms sample with the highest firing rate in the burst) (Fig. 1A) in the session was plotted and the vector length calculated for the distribution. The second analysis was HD at first spike of burst (Rayleigh's r). The HD at the first spike of each burst (i.e., the sample containing the first spike of the burst) (Fig. 1B) in the session was plotted and the vector length calculated for the distribution.
Figure 1.

Schematic of several analyses conducted within and between cells for HD cells and bursty cells. Note the representation depicted is of two hypothetical HD cells. A, HD at the peak of the burst. For both of these cells, A is consistent, meaning that the cell is always at its peak firing rate whenever the animal's head is at a specific orientation (i.e., the preferred firing direction of the cell), shown here as a dotted line for Cell 1 and a dashed line for Cell 2. B, HD at the first spike of the burst is also very consistent for both cells as the directional range of the cells (typically ∼90°) is constant throughout the session. This HD at the first spike will differ slightly, however, depending on the direction that the animal is turning as it enters the directional firing range of the cell but will average to approximate the preferred firing direction of the cell over repeated episodes. C, Burst duration as a function of AHV. Cell 1 continues to fire for as long as the animal keeps its head oriented in the preferred firing direction of the cell. Therefore, if the animal is moving very slowly through the preferred firing direction of the cell, the burst duration will be long, whereas burst duration would be short for fast movements. This should result in a negative correlation between AHV and burst duration in normal HD cells. D, For simultaneously recorded cells, the difference in the peak times of bursts was examined with respect to AHV. E, Simultaneously recorded cells also were examined for a correlation between AHV and the difference between times for the first spike of the burst. For both D and E, a negative correlation is evident: the faster the AHV, the shorter the difference in peak times and first spike times between the two bursts. F, A directionality index was generated by examining the consistency with which the order of firing of the two cells was determined by the animal's direction of movement. For example, in the figure, a CCW turn consistently results in Cell 1 firing before Cell 2, and Cell 1 fires after Cell 2 during CW turns. The Directionality index could range from 1, in which all instances of paired bursts while the animal was moving continuously in one direction showed the same order of firing during the session, to 0.5, in which the firing order of the cells was unrelated to the direction of movement.
Burst index.
The burst index is the proportion of time during which a cell fired high-frequency bursts or was inactive, relative to the time during which action potentials occurred at a relatively constant rate (Yoder and Taube, 2009). The burst index was defined as follows:
 |
where FR represents the mean firing rate over the entire session, and binsTotal represents the total number of bins during the session. Burst index values can range between 0 and 1, with a value of 0 indicating a firing rate that remains near the mean rate for the entire session and a value of 1.0 indicating that the cell is bursty and either remains silent or fires near its maximal rate for the entire session.
Additional spike timing analyses were conducted only for timestamped unit data attributable to their superior temporal resolution. For these analyses, a burst episode was defined as (1) beginning when the interspike interval (ISI) for a pair of spikes was <200 ms and continuing until a pair of spikes with an ISI >200 ms was encountered and (2) containing a minimum of 10 spikes. From these burst episodes, we then determined the percentage of spikes in a session that occurred during bursts, the percentage of samples that contained bursts, and the mean number of bursts in a session. For burst episodes, we further compared the variability in the ISIs to the ISI variability of HD cells when the animal's head was pointing within ±6° of the preferred firing direction of the cell. Variability in the ISI was defined as the SD of the ISI divided by the mean ISI and is referred to as the coefficient of variation (σ).
We also determined the animal's AHV for each sample. For calculating AHV, HD values were used to construct an HD versus time function that was smoothed using the following function: n = (nt − 2 + nt − 1 + n + n t + 1 + n t + 2)/5. The first derivative (angular velocity) for each time sample was calculated by defining an episode of five time points centered on that sample and then determining the slope of the best-fit line through those five points. For each cell, firing rate was plotted as a function of AHV using 6°/s bin intervals. For each 6°/s AHV bin, we calculated values for mean velocity and mean firing rate (number of spikes divided by the number of time samples in each bin). We then plotted a firing rate by AHV scattergram for each recording session. From the AHV versus time plot for each cell, we also determined the correlations (Pearson's r) between burst duration and mean absolute AHV of the burst (Fig. 1C) and between mean firing rate per burst and mean absolute AHV of the burst using the burst criteria for timestamped data described above.
In addition, the animals' movement behavior was examined by calculating its total cumulative distance (centimeters) and average movement velocity (centimeters per second) over the session.
For simultaneously recorded cells, a number of additional analyses were performed to test whether pairs of cells showed a consistent relationship between firing times and the animal's movement velocity. First, we determined the time within the burst at which the maximal firing rate occurred (burst peak time) for those bursts in pairs in which the animal was turning continuously in one direction or was stationary during both cell bursts. Although these movement criteria excluded a number of bursts from these burst pair analyses (for example, the first burst in Fig. 4b would be excluded from analysis), it was considered necessary because of the complexity introduced if the animal changed direction during the burst pair period. From these burst peak times, two different measures were calculated because it was possible for them to be independent (especially under canal-plugged conditions). First, when a burst occurred in one cell that was followed by a burst in the second cell, we calculated the time difference between burst peak times across the two cells (mean peak difference) to determine whether the burst peak time difference was related to the movement velocity of the animal. Correlations were then conducted between the mean peak difference times and the mean absolute AHVs at the peak of the bursts (Fig. 1D). Second, the difference in time between the two closest video samples containing the first spike of a burst across cells was also calculated to determine whether it was correlated with the mean absolute AHV (Fig. 1E).
Figure 4.
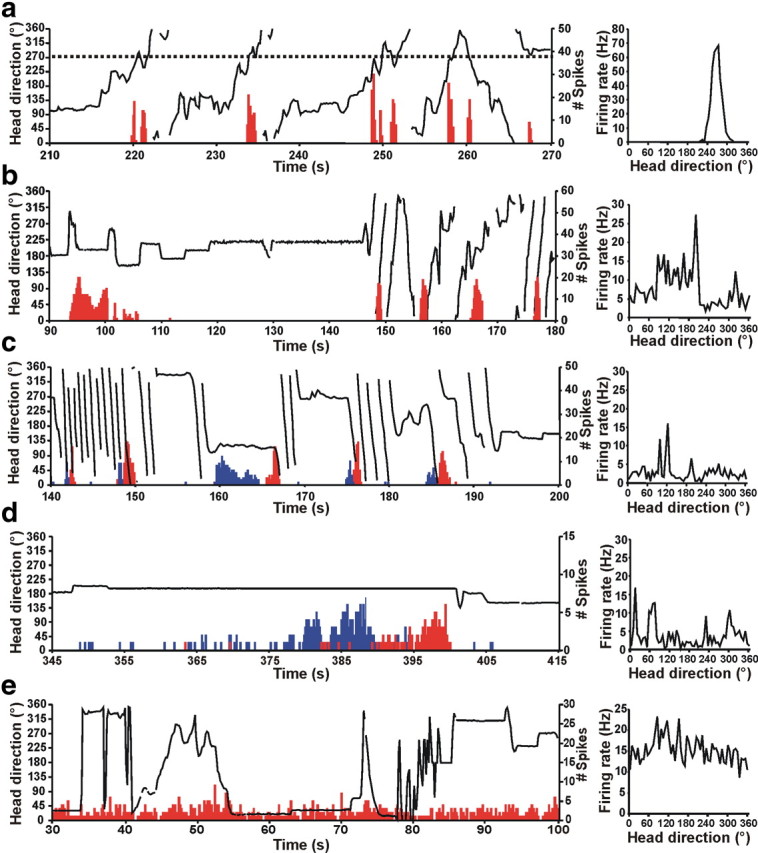
Left column, Firing of normal HD and bursty cells over time (red histogram) relative to the animal's HD (black line) for portions of the 8 min recording sessions. Right column, Corresponding firing rate versus HD functions for the cell shown at left based on the entire 8 min recording session. a, HD cell from a control chinchilla. Left, The dotted line represents the preferred firing direction of the cell at ∼270°, and this cell consistently fired at a high rate whenever the animal's head pointed at 270° (i.e., when the dotted line intersects the HD plot). Note that the shape of each burst is approximately Gaussian as the animal's head passes into, and then out of, the preferred firing direction of the cell. Right, The firing rate versus HD plot for the control chinchilla shows a clear, single-peaked function at ∼270° that matches the preferred firing direction in the plot at left. b–d, Bursty cells from canal-plugged chinchillas. b, Left, The bursty cell also fired in bursts similar to an HD cell in a control animal. However, there was no consistent relationship between the animal's HD and the occurrence of bursts. This absence of a relationship is evident in the irregular firing rate of the bursty cell versus HD function (right). Note also that the duration of each burst appears negatively correlated with the animal's movement velocity during the burst. c, Left, This plot shows two simultaneously recorded bursty cells (cell 1, red; cell 2, blue). As in b, the duration of the burst was related to the velocity of the animal's head movement for both cells shown. In addition, the order of firing for the two cells was dependent on the direction of movement (i.e., CW vs CCW; also see Fig. 3), in which the animal was making almost exclusively CW movements during the periods of rapid rotation shown. These periods of rapid rotation were a consequence of canal plugging. Right, Firing rate versus HD plot for cell 2 at left. d, Left, Two simultaneously recorded bursty cells (cell 1, red; cell 2, blue). During periods when the animal was stationary, a temporal sequence of firing could still be observed for the pair of cells, with both cells slowly increasing their firing rate as if the animal was slowly passing through the preferred firing directions of the cells. The unusually long burst durations are related to the animal's slow movement velocity. Right, Firing rate versus HD plot for cell 1 at left. e, Left, Firing of a representative cell with no discernable behavioral correlate. Note that the firing pattern differs significantly from that of HD cells (a) and bursty cells in canal-occluded animals (b–d). Right, Firing rate versus HD plot for the cell with a nondiscernible correlate at left.
Finally, for pairs of cells recorded simultaneously, we calculated a directionality index in which we determined the consistency in which one cell initiated a burst before the second cell for each turn direction (Fig. 1F). For this calculation, we first compared the order of cell firing as a function of turn direction (CW vs CCW) for all instances of burst pair firing in which the animal was turning continuously in one direction during both bursts. Second, using the most frequently occurring relationship (e.g., cell 1 fired before cell 2 for CW turns and cell 2 fired before cell 1 for CCW turns), we defined the directionality index as (NCW + NCCW)/T, where, in this example, NCW is the number of times that cell 1 fired before cell 2 for CW turns, NCCW is the number of times that cell 2 fired before cell 1 for CCW turns, and T is the total number of burst episodes. For example, if the two cells had four burst pairs in which cell 1 fired before cell 2 when the animal was turning CW, three burst pairs in which cell 2 fired before cell 1 when the animal turned CCW, two burst pairs in which cell 1 fired before cell 2 when the animal turned CCW, and one burst pair in which cell 2 fired before cell 1 when the animal turned CW, then NCW = 4 and NCCW = 3 (i.e., the numbers of burst pairs from the most frequently occurring burst pair relationship), T = 10, and the directionality index = 7/10 = 0.7. Thus, the directionality index could range from 0.5, in which the firing order of the cell pair was unrelated to turn direction, to 1.0, in which all burst pairs during the session fired in an order consistent with the animal's turn direction.
Place cells
Place cells were analyzed (as in the study by Calton et al., 2003) for place field size, mean overall firing rate, mean infield firing rate, maximum infield firing rate, mean background firing rate, spatial coherence, spatial information content, sparsity, and directional information content. The size of the place field was calculated as the percentage of the total cylinder area that was occupied by the place field. The mean overall firing rate was determined by dividing the number of spikes that occurred over the entire session by the duration of the session. Mean infield and outfield firing rates were defined as the mean firing rates for all pixels within (infield) and outside (outfield) the place field. The maximum infield firing rate was the maximum firing rate of all the pixels within the place field of the cell. Spatial coherence is a measure of the smoothness of firing rate contours. It was calculated using the method of Kubie et al. (1990), which correlates the firing rate of individual pixels with immediately neighboring pixels. Sparsity is a measure of how compact the firing field is, calculated according to the methods described by Jung et al. (1994). The more confined the firing field of the place cell, the lower the sparsity measure. Spatial information content and directional information content describe how much information is contained within each single spike discharge regarding the spatial position and HD of the animal, respectively. These two information content measures were calculated using the methods described by Skaggs et al. (1993). Cue-rotation sessions (see procedure above in HD cells section) were also conducted for a number of place cells.
Theta cells
Theta cells were subjectively classified as either phasic (phasic+, phasic, or phasic−) or tonic (Colom and Bland, 1987) according to the degree of theta frequency modulation exhibited in an autocorrelogram (high, medium, and low, respectively). Tonic theta cells showed a firing rate related to movement velocity, but the autocorrelogram showed no evidence of rhythmic firing. The mean firing rate, spatial coherence, spatial information content, and mean absolute linear head velocity × firing rate correlation (Pearson's r) were calculated for theta cells, similar to the procedures used for HD cells.
VOR testing
On completion of recording, canal-plugged animals were sent to Johns Hopkins University where the efficacy of canal plugging was assessed by recording VOR eye movements (using a scleral search coil technique or video-oculography) (Migliaccio et al., 2005) in response to sinusoidal whole-body rotations at frequencies between 1 and 5 Hz (±50 and 100°/s) in the horizontal canal plane for all animals. Additional VOR testing was also conducted in the plane of the posterior and superior canals in horizontal and superior/posterior canal-plugged animals. Some canal-plugged animals were further tested on transient head rotations (head impulse test) in the planes of all three sets of canals at 3000°/s2 for 50 ms to a 150°/s plateau, with a recording window from 10 to 30 ms. From this test, the ratio of eye acceleration to head acceleration during an analysis window from 10 to 30 ms after stimulus onset (Gainacc) and the ratio of eye velocity to head velocity during the velocity plateau (Gainvel) were obtained.
Histology
After VOR testing, animals were anesthetized, and small marker lesions were made by passing current (15 μA for 20 s) through a maximum of two electrode wires. Animals were subsequently perfused, and the brains were returned to Dartmouth College for sectioning (40 μm coronal slices), staining (thionin), and microscopic examination to verify the electrode location.
Results
Histology
Electrode tracks passing through the ADN were identified in 13 of the 15 chinchillas (Fig. 2). All cells from these animals, both before and after plugging included in the analyses described below, were determined to have been recorded from the ADN. Electrode tracks in the remaining two animals passed through the dorsal hippocampus, but did not enter the ADN.
Figure 2.
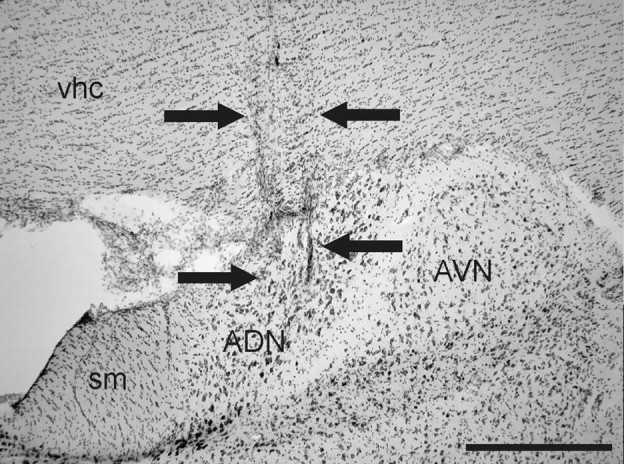
Photomicrograph depicting a representative electrode track (passing between the arrows) through the right ADN in a thionin-stained coronal section from a canal-plugged chinchilla. AVN, Anterior ventral thalamic nuclei; sm, stria medullaris; vhc, ventral hippocampal commissure. Scale bar, 500 μm.
HD cells recorded from chinchillas before plugging
Twenty-five ADN HD cells were recorded from 12 chinchillas: two control and 10 others that later underwent canal plugging. All recorded HD cells exhibited firing that was correlated with the animal's HD in the environment (Figs. 3, 4a, right) (supplemental Video 1, available at www.jneurosci.org as supplemental material) and that was consistent throughout the recording session (Fig. 4a, left). The firing properties of these cells are depicted in Table 1 and were generally similar to those of ADN HD cells recorded previously from rats (Taube, 1995; Taube and Muller, 1998) (supplemental Table 1, available at www.jneurosci.org as supplemental material). The firing rate × HD functions during the standard 1 session demonstrated clear directionality in all 25 HD cells (Rayleigh's r ≥ 0.40 for all HD cells) (supplemental Fig. 2, available at www.jneurosci.org as supplemental material). Plots of HD cell tuning curves based on CW versus CCW head turns revealed differences in the preferred firing directions that were strikingly larger than those reported for ADN HD cells in rats [∼25 ms (Blair et al., 1997; Taube and Muller, 1998] using the ATI calculation algorithms of Blair et al. (mean ± SEM, 106.70 ± 16.72 ms; t(56) = 6.09; p < 0.0001) (for a frequency distribution of all HD cell ATIs, supplemental Fig. 3, available at www.jneurosci.org as supplemental material). HD cells also showed a consistent relationship between the animal's HD at the peak of a burst (Rayleigh's r = 0.85 ± 0.02; p < 0.05 for 23 of 25 HD cells) and HD at the first spike of a burst (Rayleigh's r = 0.73 ± 0.03; p < 0.05 for 22 of 25 HD cells).
Figure 3.

Representative example of a chinchilla HD cell firing in the cylinder over three 8 min sessions that included a 90° CCW rotation of the cue card (rotation) conducted in between two baseline control sessions (standard 1 and standard 2, respectively). Rotation of the cue card by 90° resulted in a corresponding shift of the preferred firing direction of the HD cell. Note that the shape and range of the firing rate versus HD function is indistinguishable from that of HD cells recorded from the rat ADN.
Table 1.
Comparison of firing properties of HD and bursty cells in the chinchilla ADN (mean ± SEM)
| HD cells (n = 25) | Bursty cells (n = 47) | t test (two-tailed) | |
|---|---|---|---|
| Mean firing rate (spikes/s) | 4.20 ± 0.66 | 5.34 ± 0.57 | NS |
| Maximum firing rate (spikes/s) | 96.00 ± 9.34 | 82.21 ± 5.43 | NS |
| Peak firing rate in the HD versus firing rate function (spikes/s) | 37.88 ± 4.52 | 15.50 ± 1.46 | p < 0.001 |
| Mean vector length (r) | 0.841 ± 0.024 | 0.159 ± 0.014 | p < 0.001 |
| Information content (bits) | 1.822 ± 0.169 | 0.371 ± 0.037 | p < 0.001 |
| HD at burst peak (r) | 0.847 ± 0.025 | 0.193 ± 0.020 | p < 0.001 |
| HD at first spike of burst (r) | 0.727 ± 0.033 | 0.190 ± 0.017 | p < 0.001 |
| (n = 10a) | (n = 42a) | ||
|---|---|---|---|
| Mean absolute AHV/burst × firing rate (r) | 0.365 ± 0.107 | 0.384 ± 0.043 | NS |
| Mean absolute AHV/burst × burst duration (r) | −0.253 ± 0.074 | −0.159 ± 0.040 | NS |
| Mean burst duration (ms) | 1276.78 ± 128.46 | 1799.40 ± 147.13 | p < 0.05 |
| Coefficient of variation (σ) | 0.855 ± 0.046 | 0.798 ± 0.019 | NS |
| % of spikes occurring during bursts | 61.74 ± 5.87 | 72.38 ± 2.54 | NS |
| % of samples containing bursts | 9.90 ± 1.52 | 12.78 ± 1.66 | NS |
| Mean number of bursts in a session | 36.00 ± 3.46 | 33.36 ± 2.72 | NS |
a Bold indicates only timestamped unit data analyzed (see Materials and Methods). NS, Not significant (p > 0.05).
Cue rotation sessions conducted on 16 HD cells showed that the preferred firing direction of the cell shifted a similar amount as rotation of the cue card (Fig. 3). The mean shift of the preferred direction after the 90° card rotation was 94.8 ± 1.5° (standard 1 to cue rotation) and 90.8 ± 2.1° on return of the cue card to its original position (cue rotation to standard 2). The mean shift in the preferred direction between the two standard sessions across all cells was 6.36 ± 1.14° and is similar to the value observed in rats (4.71 ± 1.80°) (Taube, 1995).
VOR results after canal plugging and evidence of vestibular dysfunction
All canal-plugged animals tested for eye movements in response to sinusoidal horizontal, whole-body rotations had greatly attenuated VORs (e.g., mean ± SEM horizontal VOR gain from n = 4 chinchillas: 1 Hz at velocity 50°/s, 0.11 ± 0.03; 1 Hz at 100°/s, 0.08 ± 0.01; 5 Hz at 50°/s, 0.19 ± 0.03; 5 Hz at 100°/s, 0.18 ± 0.03) (Table 2) compared with normal chinchillas, in which gains are normally in the range of 0.4–0.6 at 2 and 5 Hz (Migliaccio et al., 2007). Also consistent with the altered dynamics of canal plugging (Lasker et al., 1999), VOR gains were significantly more attenuated at lower (1 Hz) than higher (5 Hz) frequencies across all velocities (t(32) = −2.41; p = 0.02). In addition, VOR phase was extensively disrupted (Table 2), and significant deficits were observed in VOR gain during transient head rotations (n = 3 chinchillas). For example, during horizontal rotations, mean Gainacc = 0.08 ± 0.06, where Gainacc is ∼1.00 in normal chinchillas (Della Santina et al., 2005b). However, the VOR gain in horizontal and superior/posterior canal-plugged animals that were tested for sinusoidal and transient rotations demonstrated significant hypofunction in all canals, including intact canals. Indeed, the VOR deficit for animals with all canals plugged was similar in magnitude compared with VOR data from the horizontal and superior/posterior canal-plugged animals (e.g., horizontal VOR gain during ≤1 Hz, 100°/s: all canals, 0.01 ± 0.003; horizontal only, 0.05 ± 0.01; superior/posterior canals, 0.19 ± 0.03). Thus, VOR deficits were not confined to the planes corresponding to the canals that were plugged, a result most likely attributable to collateral damage that occurred when one or both of the canals were plugged. Consequently, all post-canal-plugging results from animals whose canals were plugged were grouped together as “canal-plugged animals.” The effectiveness of our canal-plugging procedures was further demonstrated by VOR data obtained from five additional canal-plugged chinchillas, each of which showed significantly attenuated or negligible VOR gains. Because histology showed, however, that the electrodes had missed the ADN in these animals and that neither HD cells nor bursty cells were recorded from them, their data are not included here.
Table 2.
VOR gain data (mean ± SEM) from canal-plugged chinchillas
| Velocity (°/s) | Freq (Hz) |
|||
|---|---|---|---|---|
| 1 | 2 | 5 | ||
| Sinusoidal: horizontal (yaw) | 50 | 0.11 ± 0.03 | 0.23 ± 0.05 | 0.19 ± 0.03 |
| (n = 4)a | 100 | 0.08 ± 0.01 | 0.19 ± 0.03 | 0.18 ± 0.03 |
| Sinusoidal: LARP (left anterior/right posterior) | 50 | 0.10 ± 0.01 | 0.12 ± 0.01 | 0.09 ± 0.02 |
| (n = 2) | 100 | 0.15 ± 0.02 | 0.14 ± 0.01 | 0.20 ± 0.02 |
| Sinusoidal: RALP (right anterior/left posterior) | 50 | 0.21 ± 0.03 | 0.23 ± 0.03 | 0.25 ± 0.05 |
| (n = 2) | 100 | 0.26 ± 0.02 | 0.27 ± 0.03 | 0.24 ± 0.02 |
| Gainacc | Gainvel | ||
|---|---|---|---|
| Impulse test: 3K150b | Yaw | 0.08 ± 0.06 | −0.01 ± 0.14 |
| (n = 3) | LARP | 0.06 ± 0.04 | −0.05 ± 0.10 |
| RALP | 0.19 ± 0.10 | 0.06 ± 0.20 |
LARP, Left anterior/right posterior; RALP, right anterior/left posterior.
aVOR data were obtained from five additional canal-plugged chinchillas, each of which showed significantly attenuated or negligible VOR gains during horizontal, sinusoidal rotations in addition to exhibiting atypical behaviors indicative of vestibular dysfunction. Because histology showed, however, that the electrodes had missed the ADN in those animals and because neither HD cells nor bursty cells were recorded from any of them, their data are not included here.
b3K150, 3000°/s2 for 50 ms to a 150°/s plateau.
In addition, all of the canal-plugged animals demonstrated clear, persistent behavioral evidence of vestibular compromise. For example, during the recovery period immediately after canal plugging, animals were only able to roll from side to side. After 1 week, they were able to locomote independently but continued to exhibit an impaired righting reflex [i.e., while held by the tail the animal would attempt to curl upward rather than adopting a normal, abducted (splayed out) stance of the limbs] and some atypical movement behaviors (e.g., episodes of fast, tight circling) that are characteristic of bilateral vestibular dysfunction. These behaviors continued through the time of VOR testing, which typically occurred at least 3 months after canal plugging and usually 6–12 months after cell recording commenced (Gilchrist et al., 2000).
Bursty cells recorded from chinchillas after canal plugging
No HD cells were recorded in any animal after bilateral plugging of the semicircular canals. In contrast, 47 cells recorded in the ADN from seven of the nine chinchillas after plugging (three all canal plugged, three horizontal canal plugged, one superior/posterior canal plugged) exhibited burst firing patterns similar to that of a normal HD cell when the animal passes through the preferred firing direction of the cell: importantly, this activity was not related to the animal's HD. These cells were termed bursty cells (for numbers of HD cells and bursty cells recorded from each animal, see Table 3). Although bursty cells fired bursts in which the spikes were usually distributed in a Gaussian shape around one particular direction for each burst (much like spikes from a normal HD cell observed when the animal turns its head through the preferred firing direction of the cell), this firing direction did not remain constant throughout the session (Fig. 4b–d, left). This absence of consistent directionality in bursty cells resulted in irregular, randomly distributed discharge in the firing rate × HD functions (Fig. 4b–d, right) [mean vector length, Rayleigh's r = 0.16 ± 0.01; r < 0.40 for 46 of 47 bursty cells; angular deviation (s), 79.67 ± 0.81°; information content, 0.371 ± 0.037 bits] (Table 1). These functions stand in strong contrast to the narrow, single-peaked functions of HD cells (Figs. 3, 4a, right). Although one cell recorded from a canal-plugged chinchilla appeared to be weakly directional in the standard session (r = 0.512), the Rayleigh value of the cell was below the threshold to be considered directional (r ≥ 0.40) in a second standard session recorded from the same cell (r = 0.371). In addition, although the cell fired bursts like a normal HD cell throughout both sessions, the cell frequently failed to fire during rotations of the animal's head through the putative preferred firing direction of the cell. Examination of its firing pattern with respect to time was clearly similar to that of other bursty cells. The cell was therefore considered a bursty cell rather than an HD cell for all subsequent analyses. Importantly, no bursty cells were recorded in canal-plugged chinchillas in which histology demonstrated that the electrode track had missed the ADN, and no bursty cells were identified in control animals.
Table 3.
Number of HD cells and bursty cells recorded from the ADN of each animal in which HD cells or bursty cells were recorded
| Animal | Total # ADN cells | # HD cells | # bursty cells |
|---|---|---|---|
| Control | |||
| GMC1 | 11 | 8 | 0 |
| GMC8 | 7 | 3 | 0 |
| Pre-canal plugging | |||
| M30 | 2 | 2 | 0 |
| M31 | 1 | 1 | 0 |
| M33 | 4 | 3 | 0 |
| M34 | 1 | 1 | 0 |
| JB.c0.13 | 1 | 1 | 0 |
| JB.c0.16 | 1 | 1 | 0 |
| JB.c0.17 | 2 | 2 | 0 |
| JB.c0.19 | 1 | 1 | 0 |
| JB.c0.20 | 1 | 1 | 0 |
| JB.c0.21 | 1 | 1 | 0 |
| Post-canal plugging | |||
| M24a*‡ | 18 | 0 | 16 |
| M30a | 14 | 0 | 14 |
| M31a | 5 | 0 | 4 |
| M33a† | 0 | ||
| M34a | 5 | 0 | 0 |
| JB.c0.13h | 16 | 0 | 1 |
| JB.c0.16h* | 24 | 0 | 2 |
| JB.c0.17s/p† | 0 | ||
| JB.c0.19s/p | 10 | 0 | 5 |
| JB.c0.20s/p* | 10 | 0 | 0 |
| JB.c0.21h* | 10 | 0 | 5 |
Animals received bilateral plugging of the following: a, all semicircular canals; h, horizontal canals only; s/p, superior and posterior canals only.
*Animals in which VOR data were obtained.
†Animal died immediately after canal-plugging surgery.
‡Canals were plugged in animal M24 before electrode implantation so no pre-canal plugging data were obtained in that animal.
Bursty cells exhibited other firing properties similar to HD cells in control animals (Table 1), although they exhibited no stable preferred firing direction. For example, both firing rate and burst duration were equally modulated by angular head velocity in HD cells and bursty cells (Table 1). Consistent with a gain reduction in the vestibular velocity signal, the mean burst duration was significantly longer in bursty cells than HD cells (Table 1). Furthermore, when the ISIs were analyzed for burst episodes and compared with ISIs of HD cells from control animals when they were within ±6° of the preferred firing directions of the cells, the coefficient of variation was similar between the two groups (mean σ for HD cells, 0.855 ± 0.046; mean σ for bursty cells, 0.798 ± 0.019; t(50) = 1.29, NS), again suggesting that the two groups had similar firing patterns. In contrast to HD cells, however, analyses for bursty cells demonstrated that HD at the peak of a burst (Rayleigh's r = 0.193 ± 0.020; p > 0.05 for 45 of 47 bursty cells) and HD at the first spike of a burst (Rayleigh's r = 0.190 ± 0.017; p > 0.05 for 43 of 47 bursty cells) were randomly distributed around 360° during a session. Therefore, burst firing in bursty cells did not appear to be initiated, nor did it reach its peak firing rate, at a consistently stable HD during a session, as would be expected if bursty cells were not directionally modulated.
Bursty cells also fired bursts in markedly different patterns than bursts seen in 15 cells recorded before plugging that had no discernible behavioral correlates. Consistent with burst index values reported by Yoder and Taube (2009), all HD and bursty cells had burst index values >0.4 (Fig. 5, dashed line) and had distributions that overlapped considerably. Burst index values for cells with nondiscernible correlates (mean burst index, 0.404 ± 0.088) were significantly lower than for HD cells (mean burst index, 0.794 ± 0.028; t(17) = 4.34; p = 0.0004) and bursty cells (mean burst index, 0.764 ± 0.011; t(16) = 4.34; p = 0.001), whereas there was no difference in burst index scores between HD cells and bursty cells (t(70) = 1.10; NS). Furthermore, bursty cells showed significantly fewer bursts (t(15) = −4.23; p < 0.0007) and a significantly lower percentage of samples that contained bursts (t(15) = −2.43; p = 0.03) than cells with nondiscernible correlates. Although a small number of cells with nondiscernible correlates had high burst index values (Fig. 5), subjective examination of the firing rate × HD × time plots demonstrated that these cells appeared to fire in a burst mode that had more frequent, short-duration bursts than bursty cells, a firing pattern clearly dissimilar to what we observed in canal-occluded animals (for examples, see supplemental Fig. 4, available at www.jneurosci.org as supplemental material). In addition, cells with nondiscernible correlates showed a significantly weaker relationship between angular head velocity and burst duration (r = 0.05) than bursty cells (t(55) = 2.40; p = 0.008). These clear differences in firing properties suggest that bursty cells were not being inadvertently misclassified as cells with nondiscernible correlates.
Figure 5.

Distribution of burst index values for HD cells (gray bars), bursty cells (white bars), and cells with nondiscernible correlates (black bars). All HD and bursty cells had burst index values >0.4 (dashed line) and had distributions that overlapped considerably. In contrast, the majority of cells with nondiscernible correlates had very low burst index scores, and those that showed high values still exhibited qualitatively different firing patterns than HD or bursty cells (see Results) (supplemental Fig. 4, available at www.jneurosci.org as supplemental material).
There were 19 occasions in two chinchillas when pairs of bursty cells were recorded simultaneously. During these periods while the animal was turning in one direction, the temporal order in which the pair of cells fired bursts was strongly dependent on the direction of rotation (mean directionality index, 0.831 ± 0.059) (Fig. 6a) (supplemental Video 2, available at www.jneurosci.org as supplemental material). This rotation directionality was significantly greater than predicted by chance (i.e., 0.5; t(18) = 5.61; p < 0.0001). Results also demonstrated that the first spikes (Pearson's r = −0.562 ± 0.107; t(18) = −5.25; p < 0.001) and burst peak times (Pearson's r = −0.539 ± 0.108; t(18) = −4.99; p < 0.001) across the two bursty cells were directly proportional, with both measures occurring closer together in time with increasing AHV. It is noteworthy that these relationships were also significant for the 11 pairs of normal HD cells recorded from three animals (mean directionality index, 1.00 ± 0.00, t(10) = 549, p < 0.0001; AHV × first spikes, Pearson's r = −0.512 ± 0.096, t(10) = −5.54, p < 0.001; AHV × peak times, Pearson's r = −0.749 ± 0.047, t(10) = −15.95, p < 0.0001). The directionality index scores for pairs of bursty cells, however, was significantly less reliable than for pairs of HD cells (t(18) = 2.85; p = 0.01) (Fig. 6b), whereas no differences were present for AHV × first spike time (t(28) = 0.31; p = 0.76) and AHV × burst peak time (t(24) = −1.79; p = 0.09) across pairs of HD and bursty cells.
Figure 6.

The direction of the animal's movement strongly predicted the order of cell firing when pairs of HD or bursty cells were recorded simultaneously (HD, solid black line). a, Two different episodes are shown for the same pair of cells. During an episode when the animal made CCW turns (top), cell 1 (dark gray) fired a burst before cell 2 (light gray). In contrast, during an episode with CW head turns (bottom), cell 1 fired after cell 2. b, Frequency distribution of the directionality index score for each pair of HD cells (white bars) and bursty cells (gray bars) recorded. Although the majority of cell pairs had the maximum directionality index value for both HD and bursty cells (1.0), a wider range of values were present in bursty pairs, indicating less reliability in the relationship between the animal's turning direction and the order of cell firing in the pair.
VOR results and bursty cells
All animals tested for eye movements in response to horizontal, whole-body rotations after canal plugging showed greatly attenuated or no VOR. Because of technical problems, VOR data were obtained from only three chinchillas that displayed bursty cells. However, it would be reasonable to conclude that the canals were also effectively occluded in the remaining animals given (1) the reliable success of canal plugging in additional animals in which the VOR was tested but the electrodes had missed the ADN, and (2) the clear, persistent behavioral signs of vestibular compromise exhibited in the four other animals possessing bursty cells (e.g., periods of fast, sustained unidirectional rotation and failure to adopt a stance with outspread limbs when placed into the cylinder by the tail).
Place and theta cells before and after plugging
Although not the primary aim of the study, electrodes passed through the hippocampus in some control and canal-plugged animals in which we missed the targeted ADN. This occurrence provided an opportunity to record from both place and theta cells (O'Keefe and Dostrovsky, 1971; Ranck, 1973).
Eleven place cells were recorded from two chinchillas without canal plugging. All place cells were recorded from the dorsal hippocampus, although the exact location within the hippocampus could not be conclusively determined based on histology. As with HD cells, place cell firing properties were similar to those typically seen in the rat dorsal hippocampus [e.g., place field size (percentage of total visited area), 11.83 ± 1.5; spatial coherence, 0.621 ± 0.044; spatial information content, 1.949 ± 0.165 bits; sparsity, 0.161 ± 0.015] (for additional place cell properties and comparison with rat place cells, see supplemental Table 2, available at www.jneurosci.org as supplemental material). Additional data from four place cells showed that place fields consistently shifted in the direction of the cue card after a 90° CCW cue card rotation (Fig. 7), although the place fields tended to under-rotate slightly (mean place field shift, 81.0 ± 14.0°).
Figure 7.

Representative example of place cell firing from an intact chinchilla in the cylinder over three 8 min sessions that included a 90° CCW rotation of the cue card (rotation) conducted in between two baseline control sessions (standard 1 and standard 2, respectively). Place cells showed place field shifts in concert with rotation of the cue card (white arc) and demonstrated firing properties comparable with that seen in the rat hippocampus. White pixels indicate locations that the animal did not visit, yellow pixels represent locations visited but the cell did not fire, and other pixels are shown in color according to their firing rate (in ascending order: orange, lowest firing rate; red, green, blue, and black, highest firing rate). Each firing rate range/color assignment contained 0.8 times the total pixels of the lower firing rate range/color (Muller et al., 1987).
Thirty-three theta cells were recorded from six chinchillas that did not have their canals plugged at the time of recording. Theta cells also resembled those seen in the rat hippocampus with high mean firing rates (22.8 ± 2.5 spikes/s) that were modulated by linear head velocity (Pearson's r = 0.309 ± 0.034) and low spatial information (spatial information content, 0.229 ± 0.045; spatial coherence, 0.290 ± 0.036). Examination of the autocorrelograms for these cells identified the majority (23 of 33) as phasic (phasic+, 14; phasic, 5; phasic−, 4) (Fig. 8a) and the remainder (10 of 33) as tonic (Colom and Bland, 1987).
Figure 8.

Autocorrelograms from theta cells recorded in an intact and canal-plugged chinchilla. a, Phasic (phasic+) theta cell recorded from a control chinchilla. b, Phasic (phasic+) theta cell recorded from a canal-plugged chinchilla after plugging.
No activity resembling location-specific firing was observed in any animals after canal plugging. If place field locations were as unstable within a session as the preferred firing directions of bursty cells, such cells would have had no discernible behavioral correlate by direct observation and could therefore have been easily overlooked. Alternatively, because at least one HD cell was recorded before canal plugging in 10 of 11 canal-plugged animals, a minimum of one electrode in the bundle must have been situated in the ADN. Given that the electrode wires were straight cut to the same approximate length, it is therefore likely that most electrodes were already ventral to the hippocampus at the time of the canal-plugging surgery, and this could potentially account for the absence of place cell recordings after plugging.
In contrast, 22 theta cells were identified in three canal-plugged chinchillas. Compared with pre-plugged theta cells, post-plugged theta cells (excluding theta-off cells) showed significantly lower mean firing rates (15.18 ± 1.83; t(50) = 2.38; p = 0.02) and lower spatial coherence (0.163 ± 0.032; t(50) = 2.27; p = 0.03) but no difference in spatial information content (0.405 ± 0.142; t(50) = −1.49; p = 0.15) or modulation by linear head velocity (Pearson's r = 0.247 ± 0.039; t(50) = 1.39; p = 0.17). Of the 22 post-plugged theta cells, 13 of 22 were phasic (phasic+, 5; phasic, 3; phasic−, 5) (Fig. 8b) and 9 of 22 tonic (including the only two tonic theta-off cells recorded in any animals). It is noteworthy that no theta cells were recorded in electrode channels in which HD cells (before plugging) or bursty cells (after plugging) had been identified previously. This finding suggests that these theta cells were likely to have been recorded from the hippocampus (although some ADN cells do show tonic theta-related firing in the anesthetized rat) (Vertes et al., 2001). In summary, these results suggest that an intact vestibular system is not necessary for theta-related neuronal activity in the hippocampus.
Movement analyses
Analysis of the animals' movements showed no differences in total cumulative movement between sessions in which HD cells were recorded (mean cumulative movement, 3899.87 ± 445.93 cm) and sessions in which bursty cells were recorded (5038.10 ± 522.21 cm; t(70) = −1.44; p = 0.15). There was also no difference in the mean linear velocities during recording sessions of the two cell types (HD cells, 8.00 ± 4.77 cm/s; bursty cells, 10.53 ± 7.50 cm/s; t(70) = −1.53; p = 0.13), although there was more variation during recordings of bursty than HD cells (mean SD for movement velocity: HD cells, 10.27 ± 0.45 cm/s; bursty cells, 12.87 ± 0.85 cm/s; t(70) = −2.69; p = 0.01). Comparison of frequency histograms for AHV samples during sessions from control and canal-plugged animals show very similarly shaped distributions (Fig. 9). Because HD cells were only observed in control/pre-plugged animals and bursty cells were only seen in canal-plugged animals, the movement analysis data demonstrate that, although canal plugging could result in some alterations in movement behavior that would increase variability (e.g., occasional rapid, tight circling) (supplemental Video 2, available at www.jneurosci.org as supplemental material), overall movement behavior was comparable between the two groups.
Figure 9.

Mean frequency histograms of clockwise (negative) and counterclockwise (positive) AHVs from all recording sessions of HD cells (a) and bursty cells (b). Data from each session was normalized to the maximum AHV bin of the session, which was 0°/s in all sessions. Note the overall similarity in the shapes of the two distributions, although animals tended to spend a slightly greater proportion of time at faster AHVs (i.e., >300°/s) during recording of bursty cells than HD cells. Error bars are SEM.
Discussion
Single-unit recordings from intact, freely moving chinchillas identified HD cells in the ADN, and place cells and theta cells in the hippocampus with firing properties similar to those seen in the rat and other mammalian species (Taube, 2007). The common importance of accurate navigation for survival across these species may explain the conservation of these spatial signals.
Bursty cells are disrupted HD cells
HD cells were not observed in chinchillas after bilateral semicircular canal occlusion. A large number of cells, however, appeared to generate “bursty” activity: Gaussian burst firing patterns similar to those of a normal HD cell passing through its preferred firing direction. The critical difference was that these bursty cells showed no fixed preferred firing direction and instead fired bursts when the animal faced random directions throughout the recording session. Although bursty cell firing sounded similar to HD cells, the lack of correlation with the animal's head direction made it difficult to conclude that they were truly HD cells with disrupted firing properties. However, strong support for this view comes from four observations. First, in sessions in which two bursty cells were recorded simultaneously, the temporal order in which the two bursty cells fired was contingent on the animal's direction of rotation. Second, burst duration was dependent on the animal's movement velocity, with faster rotations resulting in shorter-duration bursts. It is notable that both of these properties are observed in normal HD cells as the animal passes through the preferred firing direction of the cell. Third, the percentage of spikes that occurred during bursts and the percentage of samples that contained bursts were similar between bursty cells and HD cells. Fourth, the ISI analyses indicated that the coefficient of variation for cell firing was very similar between HD cells and bursty cells.
Previous studies have shown that intact vestibular input is critical for the normal activity of HD cells in the ADN (Stackman and Taube, 1997) and postsubiculum (Stackman et al., 2002) of the rat. Although both studies reported the absence of normal HD cells, Stackman and Taube also reported the presence of novel bursty cells in the ADN after bilateral intratympanic injection of sodium arsanilate, which permanently destroys the hair cells throughout the labyrinth (Anniko and Wersäll, 1977). These bursty cells exhibited firing patterns similar to the bursty cells reported here, in which bursts of firing occurred at seemingly random directions and were not the result of a gradual drift in the preferred firing direction of the cell during a session. Therefore, it is reasonable to consider that bursty cells seen after labyrinthectomy in the rat and bursty cells seen in the chinchilla after semicircular canal occlusion are the same phenomenon. For example, examination of the firing rate × HD × time plot of a representative bursty cell from Stackman and Taube (Fig. 10a) shows striking similarities to the firing patterns displayed by bursty cells in the chinchilla (Fig. 10b).
Figure 10.

a, An example of a bursty cell from Stackman and Taube (1997). A number of cells with burst firing characteristics such as the cell shown were observed in rats after neurotoxic lesions of the vestibular labyrinth. Left, Despite several gaps in the HD plot attributable to non-detects of the LEDs during tracking, the burst firing of the cell was clearly unrelated to the animal's HD. b, An example of a bursty cell from a canal-plugged chinchilla. Left, Note the similarity in firing pattern to the bursty cell in a despite differences in movement behavior in the two animals. Of particular note, both cells show Gaussian-shaped burst firing that resembles that seen in intact animals as they pass completely through the preferred firing direction of an HD cell. Right, Corresponding firing rate versus HD functions for the cell shown at left based on the 8 min recording session. The plots show no consistent relationship between firing and HD for either cell.
One important difference exists, however, in the putative origin of bursty cells in these two reports. Stackman and Taube (1997) recorded from the same HD cells before lesioning and up to 96 h after lesioning and found that the HD cells before lesion never displayed any direction-specific firing after lesion and, importantly, never displayed a bursty firing pattern up to 96 h after lesion, although the mean firing rate never changed from before to after lesion. In contrast to our conclusions, however, this led Stackman and Taube to conclude that their bursty cells were not HD cells with altered firing properties attributable to the vestibular lesion. One possible explanation for this apparent difference is the amount of time that elapsed between the vestibular lesion and cell recording. In the chinchilla, single-unit recording did not begin until at least 1 week and, more commonly, at least 2 weeks, after canal plugging because of the major disruption in the animal's behavior. In the rat, however, single-unit recording began as early as 1 h after lesion, and any prelesion to postlesion changes in a cell were monitored out to only 96 h after lesion. Therefore, it is possible that the time course of vestibular compensatory mechanisms is responsible for the differences observed. After labyrinthectomy, tonic firing in secondary vestibular neurons returns to 50% of baseline after 24 h, and tonic activity returns to prelesion levels after 1 week (Ris and Godaux, 1998). In contrast, canal plugging does not abolish spontaneous afferent activity at any stage (Barmack, 1988). Thus, Stackman and Taube recorded their initial cells after lesion during a period of depressed tonic firing in neurons within the vestibular nuclei. It may, therefore, only be on the return of prelesion tonic vestibular firing that HD cells become bursty. This view is supported by the fact that 11 of the 27 bursty cells in the study by Stackman and Taube were recorded on a single electrode wire that had earlier recorded an HD cell and therefore must have been recorded later than 96 h after lesion, by which time some tonic vestibular firing may have recovered.
In additional support of this view, Yoder and Taube (2009) recently demonstrated the presence of bursty cells in the ADN of otoconia deficient tilted mice with similar properties to bursty cells in the present study, including unstable directional firing and the directional-dependent firing order of simultaneously recorded cell pairs. One critical difference, however, was that some normal HD cells were also observed in tilted mice (albeit at a lower proportion than in wild-type mice), whereas no HD cells were seen after semicircular canal occlusion in the present study. This finding demonstrates that, although both semicircular canal and otolith signals contribute significantly to normal HD cell function (and are perhaps integrated in the cerebellum) (Yakusheva et al., 2007), only an intact semicircular canal input may be necessary for maintenance of a stable HD cell signal.
Occluded semicircular canal dynamics and bursty cells
Canal plugging typically creates a frequency-selective deficit of semicircular canal function (Lasker et al., 1999). For example, although yaw rotations slower than 0.1 Hz (36°/s) generate no discernable horizontal VOR as long as 10 months after plugging the lateral canals in the monkey, after 5 months of recovery, an attenuated horizontal VOR (0.4–0.5 gain) persists for oscillations at 1.1 Hz (396°/s) (Angelaki et al., 1996). Single-unit recordings from vestibular afferents of canal-plugged animals show a similar high-pass characteristic, with little discernible response to slow, low-frequency head rotations, but responses approaching normal levels during faster, high-frequency head rotations (Rabbitt et al., 2001). This finding is consistent with the larger VOR gains we observed at higher frequencies. In the present study, canal-plugged animals would sometimes spin around in fast, tight rotations that would last several seconds, during which residual labyrinthine sensitivity to head movement might be expected to provide some residual input to bursty cells. Correspondingly, it appears some information concerning the animal's movement velocity is able to affect the HD cell system after canal plugging, given the relationship between burst duration and AHV, and the finding that the temporal order of firing in simultaneously recorded cells depended on the direction of the animal's movement. The remaining velocity sensitivity is likely attributed to proprioceptive and/or motor efference signals that remain available after the canal occlusions or, alternatively, from residual canal signals at higher frequencies. It is important to note, however, that prolonged instances of burst firing occasionally occurred while the animal was stationary for long periods (Fig. 4d). Thus, the source of sensory input that initiates burst activity did not rely on the animal's movement and was therefore unable to be solely the result of a residual semicircular canal signal. One possible explanation for these prolonged bursts while the animal was stationary is that they represent a slow drifting of the HD cell network because of an abnormally persistent or delayed input from a movement period that preceded the stationary episode. Finally, although canal plugging should not directly alter sensory input from otolith end organs encoding linear accelerations, all inner ear surgery carries a risk of otolith dysfunction (Tang et al., 2009). The demonstrated frequency-dependent deficit in VOR gain, however, argues against the complete ablation of labyrinth afferent activity.
Bursty cells and disorientation
Does this potentially unstable HD cell firing indicate that the canal plugged animal is disoriented? Previous data have shown that HD cells lose their direction-specific firing and become quiescent or fire tonically when the rat is blindfolded and rotated rapidly (∼240°/s) on a turntable for 2 min (Steven and Taube, 2002), a manipulation that would in theory disorient them. In no instances after the animal had experienced several revolutions, however, did HD cells exhibit burst firing as seen in canal-plugged chinchillas. This result implies that HD cells fire in a different manner when the animal is disoriented than when the semicircular canals are occluded. It is also noteworthy that, despite the ability of allothetic cues to control the firing of HD cells under normal conditions (Taube et al., 1990a), the presence of a stable cue card in the cylinder was insufficient to allow stable HD cell activity in canal-plugged animals. A possible explanation for this result is the reduced ability of allothetic cues to control HD cell firing after repeated periods of disorientation (Knierim et al., 1995). However, Stackman and Herbert (2002) showed that rats with vestibular labyrinthectomies can acquire a simple navigation task in fewer trials than controls if provided with a stable visual cue, suggesting that animals with vestibular lesions are not necessarily disoriented. Together, these results suggest that the burst firing seen in the canal-plugged chinchillas is not the result of disorientation experienced by the animal. Alternatively, the absence of cue control is consistent with the suggestion that the navigation system consisting of place and HD cells forms spatial representations based on intrinsic self-motion information, with subsequent experience-dependent integration of external cues (McNaughton et al., 1996). Unstable head direction cell activity caused by vestibular dysfunction might render the animal unable to form an initial, stable spatial representation based on idiothetic information and, therefore, a subsequent inability to integrate external cues.
Implications for attractor network models of HD cells
One prominent model currently used to represent the dynamics of the HD cell system is the attractor network (Redish et al., 1996; Skaggs et al., 1995; Zhang, 1996; Sharp et al., 2001a; van der Meer et al., 2007; Song and Wang, 2005). This model uses a ring of HD cells in which each HD cell has a different preferred firing direction, and excitatory and inhibitory connections to other HD cells with similar and different preferred firing directions, respectively. As a result of this architecture, a “hill” of excitation will form in the network that corresponds to the animal's current HD. Inputs from allothetic (external) and idiothetic (internal) cues then serve to move the hill around the ring in accordance with the movement of the animal. Consistent with this model, bursty cells could result from an activity hill moving around the ring at different rates depending on cues conveying, to some degree, the movement velocity of the animal. Because of the significantly attenuated semicircular canal input, however, movement of the activity hill is no longer in register with changes in the animal's HD. This occurrence may be a consequence of changes in semicircular canal afferent response gain and/or phase resulting from canal plugging (Lasker et al., 1999). In addition, the hill may also move around the ring even when the animal is stationary. This occurrence results in cell firing that looks like the animal is periodically passing through the preferred firing direction of the HD cell, but this activity bears no relation to the animal's actual HD. Furthermore, some aspects of the HD cell network appear preserved in the ADN after canal occlusion. For example, the temporal order of firing in simultaneously recorded cells depended on the direction of the animal's movement, just as an attractor network would predict. Importantly, these results imply that the semicircular canal input is not necessary for the generation of an activity hill in the ADN network but rather is critical for the accurate movement of the activity hill around the network in concert with changes in the animal's HD. This view is consistent with (1) the proposal that the HD signal generator may reside in the tegmento-mammillary circuitry (Blair et al., 1999) and receives modulatory idiothetic input from the vestibular system, and (2) findings that lesions of LMN or DTN abolished, or greatly reduced, HD-modulated activity in the ADN, respectively, but failed to produce bursty cells (Bassett et al., 2007).
Place and theta cells
Although it is difficult to conclude that we should have expected to record hippocampal neurons after plugging given that most of the electrodes were already ventral to the hippocampus for some animals at the time of plugging, the absence of place cells in canal-plugged animals is consistent with previous studies showing a loss of location-related firing in hippocampal complex spike cells after transient (Stackman et al., 2002) or permanent (Russell et al., 2003) peripheral vestibular lesions. Also, in accordance with previous studies that demonstrated preserved theta-modulated firing and firing rates positively correlated with linear velocity after labyrinthectomy (Russell et al., 2003, 2006), a proportion of theta cells from the canal-plugged chinchilla (57%) still showed phasic discharge, and theta cells overall were significantly modulated by linear head velocity, suggesting that an intact vestibular system is not necessary for theta-related neuronal activity to be present in the hippocampus. Together, these data are consistent with previous findings that electrical stimulation of the medial vestibular nucleus in the anesthetized rat consistently evoked firing rate increases in hippocampal complex spike cells (putative place cells), whereas a number of non-complex spike cells (putative theta cells) showed no change in responding (Horii et al., 2004). The lower firing rates in theta cells from canal-plugged chinchillas compared with controls, however, stands in contrast to Russell et al. (2006), who recorded significantly higher firing rates after labyrinthectomy.
Summary
The present study provides evidence that occlusion of the semicircular canals abolishes the directional firing of HD cells recorded from the ADN of the chinchilla. After canal occlusions, HD cells begin firing in a bursty manner that resembles an HD cell passing through its preferred firing direction but in which the preferred firing direction of the cell is constantly changing. These results demonstrate the necessity of an intact semicircular canal input for the maintenance of a stable HD signal.
Footnotes
This research was supported by NASA National Space Biomedical Research Institute Grant NCC 9-58 and National Institutes of Health Grants MH48924, NS053907, and DC009318. We thank Drs. Russell Frohardt, Joshua Bassett, Fay Guarraci, and Paul Roback for helpful discussions and Jennifer Rilling, Alycia Yarnall, and Ashley Harris for technical assistance. Special thanks to Dr. Bob Stackman for valuable discussions and for allowing the use of his data. Our thanks also to Dr. Anna Lysakowski (Department of Anatomy and Cell Biology, University of Illinois–Chicago, Chicago, IL) for providing the chinchilla brain slices used to determine the stereotaxic coordinates for surgeries.
References
- Angelaki DE, Hess BJ, Arai Y, Suzuki JI. Adaptation of primate vestibuloocular reflex to altered peripheral vestibular inputs. I. Frequency-specific recovery of horizontal VOR after inactivation of the lateral semicircular canals. J Neurophysiol. 1996;76:2941–2953. doi: 10.1152/jn.1996.76.5.2941. [DOI] [PubMed] [Google Scholar]
- Anniko M, Wersäll J. Afferent and efferent nerve terminal degeneration in the guinea-pig cochlea following atoxyl administration. Acta Otolaryngol. 1976;82:325–336. doi: 10.3109/00016487609120916. [DOI] [PubMed] [Google Scholar]
- Anniko M, Wersäll J. Experimentally (atoxyl) induced ampullar degeneration and damage to the maculae utriculi. Acta Otolaryngol. 1977;83:429–440. doi: 10.3109/00016487709128868. [DOI] [PubMed] [Google Scholar]
- Barmack NH. The influence of temporary blockage of semicircular canals on the loss and recovery of vestibuloocular reflexes. J Neurosci. 1988;8:2816–2826. doi: 10.1523/JNEUROSCI.08-08-02816.1988. [DOI] [PMC free article] [PubMed] [Google Scholar]
- Bassett JP, Taube JS. Neural correlates for angular head velocity in the rat dorsal tegmental nucleus. J Neurosci. 2001;21:5740–5751. doi: 10.1523/JNEUROSCI.21-15-05740.2001. [DOI] [PMC free article] [PubMed] [Google Scholar]
- Bassett JP, Tullman ML, Taube JS. Lesions of the tegmentomammillary circuit in the head direction system disrupt the head direction signal in the anterior thalamus. J Neurosci. 2007;27:7564–7577. doi: 10.1523/JNEUROSCI.0268-07.2007. [DOI] [PMC free article] [PubMed] [Google Scholar]
- Blair HT, Sharp PE. Visual and vestibular influences on head-direction cells in the anterior thalamus of the rat. Behav Neurosci. 1996;110:643–660. doi: 10.1037//0735-7044.110.4.643. [DOI] [PubMed] [Google Scholar]
- Blair HT, Lipscomb BW, Sharp PE. Anticipatory time intervals of head-direction cells in the anterior thalamus of the rat: implications for path integration in the head-direction circuit. J Neurophysiol. 1997;78:145–159. doi: 10.1152/jn.1997.78.1.145. [DOI] [PubMed] [Google Scholar]
- Blair HT, Cho J, Sharp PE. The anterior thalamic head-direction signal is abolished by bilateral but not unilateral lesions of the lateral mammillary nucleus. J Neurosci. 1999;19:6673–6683. doi: 10.1523/JNEUROSCI.19-15-06673.1999. [DOI] [PMC free article] [PubMed] [Google Scholar]
- Brown JE, Card JP, Yates BJ. Polysynaptic pathways from the vestibular nuclei to the lateral mammillary nucleus of the rat: substrates for vestibular input to head direction cells. Exp Brain Res. 2005;161:47–61. doi: 10.1007/s00221-004-2045-4. [DOI] [PubMed] [Google Scholar]
- Brown JE, Carey JP, Minor LB, Taube JS. Chinchilla horizontal semicircular canals are necessary but not sufficient for normal head-direction cell activity. Soc Neurosci Abstr. 2006;32 68.25. [Google Scholar]
- Calton JL, Stackman RW, Goodridge JP, Archey WB, Dudchenko PA, Taube JS. Hippocampal place cell instability after lesions of the head direction cell network. J Neurosci. 2003;23:9719–9731. doi: 10.1523/JNEUROSCI.23-30-09719.2003. [DOI] [PMC free article] [PubMed] [Google Scholar]
- Chen YC, Pellis SM, Sirkin DW, Potegal M, Teitelbaum P. Bandage backfall: labyrinthine and non-labyrinthine components. Physiol Behav. 1986;37:805–814. doi: 10.1016/0031-9384(86)90188-5. [DOI] [PubMed] [Google Scholar]
- Colom LV, Bland BH. State-dependent spike train dynamics of hippocampal formation neurons: evidence for theta-on and theta-off cells. Brain Res. 1987;422:277–286. doi: 10.1016/0006-8993(87)90934-6. [DOI] [PubMed] [Google Scholar]
- Della Santina C, Migliaccio A, Patel A. Electrical stimulation to restore vestibular function development of a 3-d vestibular prosthesis. Conf Proc IEEE Eng Med Biol Soc. 2005a;7:7380–7385. doi: 10.1109/IEMBS.2005.1616217. [DOI] [PMC free article] [PubMed] [Google Scholar]
- Della Santina CC, Migliaccio AA, Park HJ, Anderson IC, Jiradejvong P, Minor LB, Carey JP. 3D vestibuloocular reflex, afferent responses and crista histology in chinchillas after unilateral intratympanic gentamicin. Assoc Res Otolaryngology Abstr. 2005b:813. [Google Scholar]
- Frohardt RJ, Bassett JP, Taube JS. Path integration and lesions within the head direction cell circuit: comparison between the roles of the anterodorsal thalamus and dorsal tegmental nucleus. Behav Neurosci. 2006;120:135–149. doi: 10.1037/0735-7044.120.1.135. [DOI] [PubMed] [Google Scholar]
- Gallistel CR. Cambridge, MA: Massachusetts Institute of Technology; 1990. The organization of learning. [Google Scholar]
- Gilchrist DP, Curthoys IS, Burgess AM, Cartwright AD, Jinnouchi K, MacDougall HG, Halmagyi GM. Semicircular canal occlusion causes permanent VOR changes. Neuroreport. 2000;11:2527–2531. doi: 10.1097/00001756-200008030-00036. [DOI] [PubMed] [Google Scholar]
- Goodridge JP, Dudchenko PA, Worboys KA, Golob EJ, Taube JS. Cue control and head direction cells. Behav Neurosci. 1998;112:749–761. doi: 10.1037//0735-7044.112.4.749. [DOI] [PubMed] [Google Scholar]
- Horii A, Russell NA, Smith PF, Darlington CL, Bilkey DK. Vestibular influences on CA1 neurons in the rat hippocampus: an electrophysiological study in vivo. Exp Brain Res. 2004;155:245–250. doi: 10.1007/s00221-003-1725-9. [DOI] [PubMed] [Google Scholar]
- Jung MW, Wiener SI, McNaughton BL. Comparison of spatial firing characteristics of units in dorsal and ventral hippocampus of the rat. J Neurosci. 1994;14:7347–7356. doi: 10.1523/JNEUROSCI.14-12-07347.1994. [DOI] [PMC free article] [PubMed] [Google Scholar]
- Knierim JJ, Kudrimoti HS, McNaughton BL. Place cells, head direction cells, and the learning of landmark stability. J Neurosci. 1995;15:1648–1659. doi: 10.1523/JNEUROSCI.15-03-01648.1995. [DOI] [PMC free article] [PubMed] [Google Scholar]
- Knierim JJ, Kudrimoti HS, McNaughton BL. Interactions between idiothetic cues and external landmarks in the control of place cells and head direction cells. J Neurophysiol. 1998;80:425–446. doi: 10.1152/jn.1998.80.1.425. [DOI] [PubMed] [Google Scholar]
- Kubie JL. A driveable bundle of microwires for collecting single-unit data from freely-moving rats. Physiol Behav. 1984;32:115–118. doi: 10.1016/0031-9384(84)90080-5. [DOI] [PubMed] [Google Scholar]
- Kubie JL, Muller RU, Bostock E. Spatial firing properties of hippocampal theta cells. J Neurosci. 1990;10:1110–1123. doi: 10.1523/JNEUROSCI.10-04-01110.1990. [DOI] [PMC free article] [PubMed] [Google Scholar]
- Lasker DM, Backous DD, Lysakowski A, Davis GL, Minor LB. Horizontal vestibuloocular reflex evoked by high-acceleration rotations in the squirrel monkey. II. Responses after canal plugging. J Neurophysiol. 1999;82:1271–1285. doi: 10.1152/jn.1999.82.3.1271. [DOI] [PubMed] [Google Scholar]
- McNaughton BL, Barnes CA, Gerrard JL, Gothard K, Jung MW, Knierim JJ, Kudrimoti H, Qin Y, Skaggs WE, Suster M, Weaver KL. Deciphering the hippocampal polyglot: the hippocampus as a path integration system. J Exp Biol. 1996;199:173–185. doi: 10.1242/jeb.199.1.173. [DOI] [PubMed] [Google Scholar]
- Migliaccio AA, Macdougall HG, Minor LB, Della Santina CC. Inexpensive system for real-time 3-dimensional video-oculography using a fluorescent marker array. J Neurosci Methods. 2005;143:141–150. doi: 10.1016/j.jneumeth.2004.09.024. [DOI] [PMC free article] [PubMed] [Google Scholar]
- Migliaccio AA, Minor LB, Della Santina CC. The 3-dimensional angular vestibulo-ocular reflex evoked by high-acceleration rotations in normal chinchilla is conjugate, nonlinear and isotropic. Assoc Res Otolaryngology Abstr. 2007:324. [Google Scholar]
- Muir GM, Taube JS. Firing properties of head direction cells, place cells, and theta cells in the freely-moving chinchilla. Soc Neurosci Abstr. 2002;28 584.4. [Google Scholar]
- Muir GM, Carey JP, Hirvonen TP, Minor LB, Taube JS. Head direction cell activity is unstable following plugging of the semicircular canals in the freely-moving chinchilla. Soc Neurosci Abstr. 2004;30 doi: 10.1523/JNEUROSCI.3450-09.2009. 868.11. [DOI] [PMC free article] [PubMed] [Google Scholar]
- Muller RU, Kubie JL, Ranck JB., Jr Spatial firing patterns of hippocampal complex-spike cells in a fixed environment. J Neurosci. 1987;7:1935–1950. doi: 10.1523/JNEUROSCI.07-07-01935.1987. [DOI] [PMC free article] [PubMed] [Google Scholar]
- O'Keefe J, Dostrovsky J. The hippocampus as a spatial map. Preliminary evidence from unit activity in the freely-moving rat. Brain Res. 1971;34:171–175. doi: 10.1016/0006-8993(71)90358-1. [DOI] [PubMed] [Google Scholar]
- Ossenkopp KP, Hargreaves EL. Spatial learning in an enclosed eight-arm radial maze in rats with sodium arsanilate-induced labyrinthectomies. Behav Neural Biol. 1993;59:253–257. doi: 10.1016/0163-1047(93)91034-k. [DOI] [PubMed] [Google Scholar]
- Plotnik M, Marlinski V, Goldberg JM. Reflections of efferent activity in rotational responses of chinchilla vestibular afferents. J Neurophysiol. 2002;88:1234–1244. doi: 10.1152/jn.2002.88.3.1234. [DOI] [PubMed] [Google Scholar]
- Rabbitt RD, Boyle R, Highstein SM. Physiology of the semicircular canals after surgical plugging. Ann NY Acad Sci. 2001;942:274–286. doi: 10.1111/j.1749-6632.2001.tb03752.x. [DOI] [PubMed] [Google Scholar]
- Ranck JB., Jr Studies on single neurons in dorsal hippocampal formation and septum in unrestrained rats. I. Behavioral correlates and firing repertoires. Exp Neurol. 1973;41:461–531. doi: 10.1016/0014-4886(73)90290-2. [DOI] [PubMed] [Google Scholar]
- Redish AD, Elga AN, Touretzky DS. A coupled attractor model of the rodent head direction system. Netw Comput Neural Sys. 1996;7:671–685. [Google Scholar]
- Reti IM, Minor LB, Baraban JM. Prominent expression of Narp in central vestibular pathways: selective effect of labyrinth ablation. Eur J Neurosci. 2002;16:1949–1958. doi: 10.1046/j.1460-9568.2002.02284.x. [DOI] [PubMed] [Google Scholar]
- Ris L, Godaux E. Neuronal activity in the vestibular nuclei after contralateral or bilateral labyrinthectomy in the alert guinea pig. J Neurophysiol. 1998;80:2352–2367. doi: 10.1152/jn.1998.80.5.2352. [DOI] [PubMed] [Google Scholar]
- Russell NA, Horii A, Smith PF, Darlington CL, Bilkey DK. Long-term effects of permanent vestibular lesions on hippocampal spatial firing. J Neurosci. 2003a;23:6490–6498. doi: 10.1523/JNEUROSCI.23-16-06490.2003. [DOI] [PMC free article] [PubMed] [Google Scholar]
- Russell NA, Horii A, Smith PF, Darlington CL, Bilkey DK. Bilateral peripheral vestibular lesions produce long-term changes in spatial learning in the rat. J Vestib Res. 2003b;13:9–16. [PubMed] [Google Scholar]
- Russell NA, Horii A, Smith PF, Darlington CL, Bilkey DK. Lesions of the vestibular system disrupt hippocampal theta rhythm in the rat. J Neurophysiol. 2006;96:4–14. doi: 10.1152/jn.00953.2005. [DOI] [PubMed] [Google Scholar]
- Sharp PE, Blair HT, Cho J. The anatomical and computational basis of the head-direction cell signal. Trends Neurosci. 2001a;24:289–294. doi: 10.1016/s0166-2236(00)01797-5. [DOI] [PubMed] [Google Scholar]
- Sharp PE, Tinkelman A, Cho J. Angular velocity and head direction signals recorded from the dorsal tegmental nucleus of Gudden in the rat: implications for path integration in the head direction cell circuit. Behav Neurosci. 2001b;115:571–588. [PubMed] [Google Scholar]
- Skaggs WE, McNaughton BL, Gothard KM, Markus EJ. An information-theoretic approach to deciphering the hippocampal code. In: Hanson SJ, Cowan JD, Giles CL, editors. Advances in neural information processing systems. Vol 5. San Mateo, CA: Kaufmann; 1993. pp. 1030–1037. [Google Scholar]
- Skaggs WE, Knierim JJ, Kudrimoti HS, McNaughton BL. A model of the neural basis of the rat's sense of direction. In: Tesauro G, Touretzky DS, Leen TK, editors. Advances in neural information processing systems. Vol 7. Cambridge, MA: Massachusetts Institute of Technology; 1995. pp. 173–180. [PubMed] [Google Scholar]
- Song P, Wang XJ. Angular path integration by moving “hill of activity”: a spiking neuron model without recurrent excitation of the head-direction system. J Neurosci. 2005;25:1002–1014. doi: 10.1523/JNEUROSCI.4172-04.2005. [DOI] [PMC free article] [PubMed] [Google Scholar]
- Stackman RW, Herbert AM. Rats with lesions of the vestibular system require a visual landmark for spatial navigation. Behav Brain Res. 2002;128:27–40. doi: 10.1016/s0166-4328(01)00270-4. [DOI] [PubMed] [Google Scholar]
- Stackman RW, Taube JS. Firing properties of head direction cells in rat anterior thalamic neurons: dependence upon vestibular input. J Neurosci. 1997;17:4349–4358. doi: 10.1523/JNEUROSCI.17-11-04349.1997. [DOI] [PMC free article] [PubMed] [Google Scholar]
- Stackman RW, Taube JS. Firing properties of rat lateral mammillary single units: head direction, head pitch, and angular head velocity. J Neurosci. 1998;18:9020–9037. doi: 10.1523/JNEUROSCI.18-21-09020.1998. [DOI] [PMC free article] [PubMed] [Google Scholar]
- Stackman RW, Clark AS, Taube JS. Hippocampal spatial representations require vestibular input. Hippocampus. 2002;12:291–303. doi: 10.1002/hipo.1112. [DOI] [PMC free article] [PubMed] [Google Scholar]
- Steven MS, Taube JS. Head direction cell discharge during periods of disorientation. Soc Neurosci Abstr. 2002;28:584–3. [Google Scholar]
- Tang S, Melvin TA, Della Santina CC. Effects of semicircular canal electrode implantation on hearing in chinchillas. Acta Otolaryngol. 2009;129:481–486. doi: 10.1080/00016480802252243. [DOI] [PMC free article] [PubMed] [Google Scholar]
- Taube JS. Head direction cells recorded in the anterior thalamic nuclei of freely moving rats. J Neurosci. 1995;15:70–86. doi: 10.1523/JNEUROSCI.15-01-00070.1995. [DOI] [PMC free article] [PubMed] [Google Scholar]
- Taube JS. The head direction signal: origins and sensory-motor integration. Annu Rev Neurosci. 2007;30:181–207. doi: 10.1146/annurev.neuro.29.051605.112854. [DOI] [PubMed] [Google Scholar]
- Taube JS, Burton HL. Head direction cell activity monitored in a novel environment and during a cue conflict situation. J Neurophysiol. 1995;74:1953–1971. doi: 10.1152/jn.1995.74.5.1953. [DOI] [PubMed] [Google Scholar]
- Taube JS, Muller RU. Comparison of head direction cell activity in the postsubiculum and anterior thalamus of freely moving rats. Hippocampus. 1998;8:87–108. doi: 10.1002/(SICI)1098-1063(1998)8:2<87::AID-HIPO1>3.0.CO;2-4. [DOI] [PubMed] [Google Scholar]
- Taube JS, Muller RU, Ranck JB., Jr Head-direction cells recorded from the postsubiculum in freely moving rats. II. Effects of environmental manipulations. J Neurosci. 1990a;10:436–447. doi: 10.1523/JNEUROSCI.10-02-00436.1990. [DOI] [PMC free article] [PubMed] [Google Scholar]
- Taube JS, Muller RU, Ranck JB., Jr Head-direction cells recorded from the postsubiculum in freely moving rats. I. Description and quantitative analysis. J Neurosci. 1990b;10:420–435. doi: 10.1523/JNEUROSCI.10-02-00420.1990. [DOI] [PMC free article] [PubMed] [Google Scholar]
- van der Meer MA, Knierim JJ, Yoganarasimha D, Wood ER, van Rossum MC. Anticipation in the rodent head direction system can be explained by an interaction of head movements and vestibular firing properties. J Neurophysiol. 2007;98:1883–1897. doi: 10.1152/jn.00233.2007. [DOI] [PubMed] [Google Scholar]
- Vann SD. Transient spatial deficit associated with bilateral lesions of the lateral mammillary nuclei. Eur J Neurosci. 2005;21:820–824. doi: 10.1111/j.1460-9568.2005.03896.x. [DOI] [PubMed] [Google Scholar]
- Vertes RP, Albo Z, Viana Di Prisco G. Theta-rhythmically firing neurons in the anterior thalamus: implications for mnemonic functions of Papez's circuit. Neuroscience. 2001;104:619–625. doi: 10.1016/s0306-4522(01)00131-2. [DOI] [PubMed] [Google Scholar]
- Wallace DG, Hines DJ, Pellis SM, Whishaw IQ. Vestibular information is required for dead reckoning in the rat. J Neurosci. 2002;22:10009–10017. doi: 10.1523/JNEUROSCI.22-22-10009.2002. [DOI] [PMC free article] [PubMed] [Google Scholar]
- Yakusheva TA, Shaikh AG, Green AM, Blazquez PM, Dickman JD, Angelaki DE. Purkinje cells in posterior cerebellar vermis encode motion in an inertial reference frame. Neuron. 2007;54:973–985. doi: 10.1016/j.neuron.2007.06.003. [DOI] [PubMed] [Google Scholar]
- Yoder RM, Taube JS. Head direction cell activity in mice: robust directional signal depends on intact otolith organs. J Neurosci. 2009;29:1061–1076. doi: 10.1523/JNEUROSCI.1679-08.2009. [DOI] [PMC free article] [PubMed] [Google Scholar]
- Zar JH. Ed 4. Upper Saddle River, NJ: Prentice Hall; 1999. Biostatistical analysis. [Google Scholar]
- Zhang K. Representation of spatial orientation by the intrinsic dynamics of the head-direction cell ensemble: a theory. J Neurosci. 1996;16:2112–2126. doi: 10.1523/JNEUROSCI.16-06-02112.1996. [DOI] [PMC free article] [PubMed] [Google Scholar]