

Abstract
These experiments were undertaken to assess the importance of cytoplasmic (c) sorbitol oxidation versus mitochondrial (m) pyruvate oxidation in mediating neural and vascular dysfunction attributable to hyperglycemia in diabetic rats. Increased oxidation of sorbitol is coupled to enzymatic reduction of free oxidized NAD+c to reduced NADHc, manifested by an increased ratio of NADH to NAD+c. Likewise, increased oxidation of pyruvate is coupled to reduction of NAD+m to NADHm, which increases the NADH/NAD+m ratio. Specific inhibitors of sorbitol production or sorbitol oxidation normalized: increased diabetic nerve NADH/NAD+c, impaired nerve-conduction velocity, and vascular dysfunction in sciatic nerve, retina, and aorta; however, they had little or no impact on increased NADH/NAD+m. These observations provide, for the first time, strong in vivo evidence for the primacy of sorbitol oxidation versus. pyruvate oxidation in mediating the metabolic imbalances, impaired nerve conduction, and vascular dysfunction evoked by diabetes. These findings are consistent with (a) the fact that oxidation of sorbitol produces “prooxidant” NADHc uncoupled from subsequent production of “antioxidant” pyruvate required for reoxidation of NADHc to NAD+c by lactate dehydrogenase, and (b) the hypothesis that neural and vascular dysfunction in early diabetes are caused primarily by increased NADHc, which fuels superoxide production by NADH-driven oxidases. Antioxid. Redox Signal. 12, 39–51.
Introduction
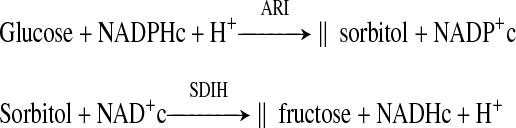
Increasing evidence supports the importance of superoxide (O2−) and related reactive oxygen species (ROS) in mediating diabetic complications attributed to hyperglycemia (4, 5, 8, 20, 29, 52); however, the primary source(s) of electrons that fuel superoxide production is controversial. Two distinctly different hypotheses have been proposed: (a) increased oxidation of pyruvate (produced by increased glycolysis) in mitochondria coupled to reduction of free NAD+m to NADHm, which promotes superoxide production by the mitochondrial electron transport chain (5, 29); and (b) increased oxidation of sorbitol (produced by increased flux of glucose via the sorbitol pathway, which does not produce pyruvate) by sorbitol dehydrogenase (SDH) to fructose coupled to reduction of cytosolic NAD+c to NADHc (equimolar to fructose) that drives superoxide production primarily by NADH-driven oxidases (20, 30, 55):
 |
The first hypothesis suggests that pyruvate supplementation might mimic or exacerbate metabolic imbalances and vascular and neural dysfunction evoked by hyperglycemia. However, pyruvate supplementation (a) normalizes/attenuates vascular dysfunction and metabolic imbalances evoked by hyperglycemia in several different paradigms of diabetes (16, 24, 44, 48, 50, 57), and (b) attenuates cataract formation in diabetic rats (58).
The second hypothesis suggests that sorbitol supplementation (at normal glucose levels) might cause oxidative stress and associated metabolic imbalances and vascular dysfunction comparable to hyperglycemia/diabetes. This prediction has been confirmed in many investigations in tissues and cells exposed to elevated sorbitol levels in vivo and in vitro [9, 12, 26, 30 (pages 9–10 in Online Appendix Section (OAS)-IV-A see Supplemental Appendix at www.liebertonline.com/ars), 46, 47, 49, 53}. These effects of sorbitol also are prevented or substantially attenuated by coadministration of pyruvate, SOD (superoxide dismutase), and/or by inhibitors of SDH (SDI), or both (12, 26, 46, 47, 53). These effects of pyruvate and sorbitol are consistent with a potentially important role for sorbitol oxidation in mediating oxidative stress and vascular and neural dysfunction evoked by diabetes.
Observations that SDI and SOD prevent sorbitol-induced vascular dysfunction and superoxide production are consistent with numerous observations in animal models of diabetes that inhibition of sorbitol production by aldose reductase (AR) inhibitors (ARI) also prevent/attenuate vascular and neural dysfunction, oxidative–nitrosative stress, and the predicted increases in free NADH/NAD+c (6, 10, 20, 30–37, 39, 48, 50, 55, and OAS I-D, I-E).
To the extent that metabolic imbalances and vascular and neural changes in early diabetes are largely sequelae of increased sorbitol oxidation rather than oxidation of NADPHc to NADP+c by AR, they should be prevented by ARI or SDI:
 |
However, Cameron et al. (6) reported that ARI-WAY-121,509, but not SDI-WAY-135,706, reversed impaired nerve conduction and sciatic nerve blood flow, and Obrosova et al. (34, 36) reported that SDI-157 failed to attenuate increases in retinal and sciatic nerve NADH/NAD+c or NADH/NAD+m in diabetic rats.
The current studies were therefore undertaken to clarify and further to investigate the (a) contributions of increases in NADH/NAD+c versus. NADH/NAD+m in mediating neural and vascular dysfunction evoked by diabetes, and (b) efficacy of SDI versus. ARI in preventing and reversing sorbitol pathway–linked increases in NADH/NAD+c and associated neural and vascular dysfunction.
Materials and Methods
Animal protocols
Male Sprague–Dawley rats were purchased from Sasco (O'Fallon, MO) and cared for in accordance with guidelines of the University Committee for the Humane Care of Laboratory Animals. Rats were housed one per cage and had free access to standard rat chow (Ralston Purina, Richmond, IN) and tap water. Diabetes was induced after an overnight fast by injection of 50 mg/kg body weight (bwt) of streptozotocin (Zanosar obtained from Upjohn) in citrate saline buffer, pH 4.5. Rats were anesthetized with ketamine (Vetalar, 35 mg/kg bwt), and streptozotocin was injected in a surgically exposed femoral vein. Nonfasting blood samples were obtained 3–4 days later from a tail vein for measurement of plasma glucose levels with the hexokinase method, as in previous experiments (39). Rats with plasma glucose levels of 16.7 mM (300 mg/dl) or more were considered to be diabetic and were distributed to groups of untreated, and ARI- and SDI-treated diabetics balanced to achieve mean ± SD values of glucose levels that did not differ (p > 0.05) among the groups. SDI and ARI treatments were then initiated. Plasma glucose levels and HbA1c levels were assessed again after 2 and 4 weeks of treatment in all studies, and then at 4-week intervals, depending on the duration of diabetes, and again at the termination of each study. Plasma glucose levels shown in the Results sections and in tables are expressed as mean ± SD of glucose levels measured at intervals of 2–4 weeks and at the termination of the study.
Because neural and vascular dysfunction varies with duration and severity of diabetes, prevention studies were first performed in rats with diabetes of 5 and 18 weeks duration. Subsequently, the efficacy of SDI and ARI in reversing neural changes was assessed after 2 and 4 weeks of treatment initiated after 6 weeks of untreated diabetes. Because our observation in this study (Reversal Study 1) that MNCV deficits were normalized by the SDI were discordant with the failure of an SDI to reverse MNCV deficits evoked by diabetes in the report by Cameron et al. (6), this experiment was repeated (Reversal Study 2) to validate the reproducibility of this observation and, in addition, to assess the relation of normalization of MNCV deficits to changes in neural blood flow and vascular leakage and changes in sorbitol, fructose, and myoinositol levels that were not assessed in Reversal Study 1.
SDI (CP-166,572 (i.e., SDI-158) (13) and two structurally distinct ARIs, zopolrestat (28) and sorbinil (38), were synthesized at Pfizer Global Research and Development, Groton, CT. SDI was added to drinking water to provide a dose of 200 mg/kg bwt/day; zopolrestat was added to chow to provide 50 mg/kg bwt/day in the 5-week study and 100 mg/kg bwt/day in both reversal studies; sorbinil was added to chow to provide 50 mg/kg bwt/day in the 18-week study. Two structurally different ARIs were used to minimize the possibility that efficacy was an off-target effect. Dosages were based on dose–response effects of the SDI and ARIs (33). Body weights were monitored weekly, and consumption of drinking water and chow was checked every 2–3 days; quantities of inhibitors were adjusted to provide the appropriate dosage.
Motor-nerve conduction
Motor-nerve conduction velocity (MNCV) was measured in rats anesthetized with intramuscular injections of ketamine (100 mg/kg body wt). Core body temperature was maintained at 37 ± 5°C with the use of heating pads and lamps controlled by a rectal temperature probe. Nerves were stimulated with a Grass stimulator (model SDP; Quincy, MA) by generating a rectangular pulse 0.2 ms in duration at a voltage sufficient to give a maximal response. The compound muscle action potential was amplified and recorded on a digital-storage oscilloscope 1425 (Gould, Oxnard, CA).
MNCV in the distal tibial branch of the sciatic nerve was quantified by insertion of stimulating electrodes through the skin at the popliteal fossa and the ankle to stimulate the nerve and insertion of a concentric bipolar recording electrode into the plantar muscle. MNCV was calculated by dividing the distance between the two stimulating electrodes by the latency difference in the onset of the electromyographic (EMG) potentials in the recording electrodes evoked by the two stimulating electrodes. MNCV in the distal peroneal branch of the sciatic nerve was quantified by inserting stimulating electrodes at the sciatic notch and at the popliteal fossa to stimulate the nerve and by insertion of the concentric bipolar recoding electrode into the anterior tibial muscle. MNCV was calculated as described for the tibial nerve. MNCVs are reported in meters per second (m/s).
Blood flow and vascular permeability measurements
One week after the last assessment of MNCV, sciatic nerve and retinal blood flows and vascular albumin permeation (VAP) were assessed, as previously described (39, 40), and reported as microliters per gram (μl/g) wet wt/min and μg plasma/g wet wt/min, respectively. Rats were anesthetized with thiobutabarbital (Inactin), rather than ketamine, because it has a longer duration of action needed for preparation and assessment of blood flow and VAP. Blood flow was assessed by injection of 11.3 μm 46Sc-labeled microspheres. VAP was quantified by the injection of [125I]-bovine serum albumin followed by [131I]-albumin. Mean arterial blood pressure (MABP) was monitored by inserting a polyethylene cannula filled with heparinized saline (connected to a pressure transducer) into the right subclavian artery (10).
Metabolite measurements
One week after the final assessment of MNCV, rats were again anesthetized with thiobutabarbital, and the portion of sciatic nerve between the sciatic notch and the popliteal fossa was rapidly removed, plunged into liquid nitrogen, and kept at −80°C before measurement of metabolites. Nerve polyols, lactate and pyruvate levels, plasma glucose levels, and HbA1c were quantified as described previously (30, 39, 45, 50). Plasma β-hydroxybutyrate was determined with the standard fluorescence enzymatic method in PCA-deproteinized samples (3). Plasma NEFA levels were assessed by using the WAKO NEFA-C test kit (Wako Chemicals, Richmond, WA).
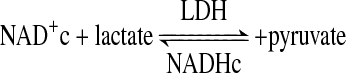
The ratio of sciatic nerve molar concentrations of free cytosolic NADHc and free NAD+c was estimated by the redox metabolite indicator method (54). This method is based on the near-equilibrium between the NAD+/NADHc ratio and the ratio of the molar concentrations of lactate and pyruvate established by lactate dehydrogenase (LDH), as depicted in Eqs. 1 and 2. The value of the unitless equilibrium constant KLDH is 1.111 × 10⁻⁴ (at pH 7.0) (54):
 |
(Eq. 1) |
 |
(Eq. 2) |
Sciatic nerve molar ratios of free NADPH/NADP+c and mitochondrial NADH/NAD+m were assessed based on the near-equilibria established between (a) NADPH/NADP+c and malate/pyruvate ratios by the malic enzyme (19), and (b) NADH/NAD+m and β-hydroxybutyrate/acetoacetate ratios by β-hydroxybutyrate-DH (54).
Statistical analysis
All results are reported as mean ± SD. Multiple analysis of variance was performed on Blom-transformed data with the SAS general linear models procedure; overall differences among experimental groups for each parameter were first assessed by the Van der Waerden test, and individual pair-wise group comparisons were evaluated with least-square means, as previously described (45).
Results
5 weeks of diabetes
Diabetes increased sciatic nerve endoneurial blood flow by 57%, VAP, 83%, and NADH/NAD+c, ∼80% (Table 1). Retinal blood flow and VAP were increased 14% and 83%, respectively, and aortic VAP was increased 90% (from 98 ± 16 μg plasma/g wet wt/min in controls to 191 ± 52; p < 0.001). SDI and ARI prevented all of these changes.
Table 1.
5 Weeks of Diabetes: Effects of the SDI and the ARI (Zopolrestat) on Blood Flow and Vascular Albumin Permeation in Sciatic Nerve Endoneurium and Retina and on Sciatic Nerve NADH/NAD+c, Sorbitol, Fructose, and Myoinositol Levels
| |
Sciatic nerve |
Retina |
||||||
|---|---|---|---|---|---|---|---|---|
| Blood flow | VAP | NADH/ NAD+c | Sorbitol | Fructose | Myoinositol | Blood flow | VAP | |
| Control | 65 ± 16 | 76 ± 13 | 1.1 ± 0.4 | 159 ± 55 | 814 ± 197 | 4,148 ± 1692 | 374 ± 15 | 75 ± 12 |
| +SDI | 64 ± 17 | 75 ± 13 | – | 2,050 ± 697* | 524 ± 201* | 4,351 ± 1290 | 360 ± 20 | 71 ± 8 |
| +ARI | 68 ± 30 | 76 ± 18 | – | 24 ± 11* | 179 ± 60* | 4,283 ± 938 | 376 ± 16 | 74 ± 19 |
| Diabetic | 102 ± 17* | 139 ± 16* | 1.9 ± 0.4† | 1,863 ± 623* | 5,815 ± 1,711* | 2,875 ± 737§ | 426 ± 21* | 137 ± 16* |
| +SDI | 67 ± 26ll | 89 ± 25ll | 1.3 ± 0.4# | 9,975 ± 4397*ll | 1,001 ± 519ll | 2,844 ± 793§ | 380 ± 45ll | 85 ± 24ll |
| +ARI | 75 ± 24# | 94 ± 3ll | 1.2 ± 0.4# | 170 ± 85ll | 1,217 ± 253†ll | 3,521 ± 1,229 | 382 ± 33ll | 91 ± 38ll |
BF, blood flow; VAP, vascular albumin permeation. Data are expressed as mean ± SD for 10–12 animals. Blood flow is expressed as μl/g wet wt/min; vascular albumin permeation is expressed as μg plasma/g wet wt/min; sorbitol, fructose, and myoinositol levels are expressed as nmol/g wet wt; see Research Design and Methods for calculation of free NADH/NAD+c × 10−3.
Different from Controls: *p ≤ 0.001, †p ≤ 0.005, §p < 0.04.
Different from Diabetics: llp ≤ 0.001, #p ≤ 0.01.
Diabetes increased sciatic nerve sorbitol and fructose levels by 12-fold and sevenfold, respectively, but decreased myoinositol levels 30%. The SDI increased sorbitol levels another 5.4-fold, whereas the ARI normalized them; nevertheless, both inhibitors decreased fructose levels ∼80%.
Nerve sorbitol levels in SDI-treated controls equaled those in untreated diabetic subjects, whereas in ARI-treated controls, sorbitol levels were decreased to 22% of controls; fructose levels in SDI- and ARI-treated controls were significantly decreased versus controls; blood flow, VAP, and myoinositol levels in SDI- and ARI-treated controls did not differ from controls.
Plasma glucose levels in untreated diabetic rats were 25.7 ± 2.7 mM vs. 6.2 ± 0.7 in controls (p < 0.001); glucose levels in SDI- and ARI-treated diabetics were 26.0 ± 4.0 and 27.0 ± 3.6 mM, respectively, and p < 0.001 vs. controls for both groups. HbA1c levels were 11.1 ± 2.0% in untreated diabetics vs. 3.7 ± 1.3% in controls (p < 0.001); HbA1c levels in SDI- and ARI-treated diabetics were 10.6 ± 1.4% and 10.8 ± 1.1%, respectively; p < 0.001 vs. controls. Plasma glucose and HbA1c levels in SDI- and ARI-treated diabetics did not differ (p > 0.05) from those in untreated diabetics.
Mean arterial blood pressure (MABP) was 128 ± 9 mm Hg in diabetics vs. 144 ± 14 in controls (p < 0.01). Initial body weights were 240 ± 12 g in diabetics vs. 259 ± 17 in controls (p < 0.02). Body weights increased 9.0 ± 14% in diabetics vs. 33 ± 11% in controls (p < 0.001). MABP and body weights in SDI- and ARI-treated diabetics did not differ from those in untreated diabetics (p > 0.05).
18 weeks of diabetes
Diabetes decreased MNCV 11.5% in the distal tibial nerve (Fig. 1) and 10.4% in the peroneal nerve (from 65.3 ± 4.2 m/s to 58.5 ± 5.1; p < 0.01). Both inhibitors prevented these MNCV deficits. Diabetes increased sciatic nerve NADH/NAD+c and NADH/NAD+m by 80% and 60%, respectively (Fig. 1); both inhibitors prevented the increase in NADH/NAD+c, but not the increase in NADH/NAD+m.
FIG. 1.

Eighteen weeks of diabetes. Effects of SDI (200 mg/kg bwt/day) and ARI (sorbinil, 50 mg/kg bwt/day) on distal tibial MNCV and on sciatic nerve NADH/NAD+c and NADH/NAD+m in rats with diabetes of 18 weeks' duration. Mean ± SD: n = Nine to 12 rats for all parameters. Different from controls: *p < 0.001, †p = 0.005, ‡p < 0.02. Different from diabetics: §p < 0.02, lIp = 0.05.
Diabetes also increased sciatic nerve NADPH/NADP+c ratios ∼80%, which also were normalized by the SDI (Table 2). The ARI partially attenuated the increase in NADPH/NADP+c (which did not differ significantly from controls or diabetics) but did not affect malate/pyruvate ratios.
Table 2.
18 Weeks of Diabetes: Effects of Diabetes, SDI, and the ARI-sorbinil on Sciatic Nerve NADPH/NADP+, Sorbitol, Fructose, and Myoinositol Levels in the Same Animals in Which NADH/NAD+c and NADH/NAD+m are Shown in Fig. 1
| |
Sciatic nerve |
|
|
|
|
|||
|---|---|---|---|---|---|---|---|---|
| NADPH/NADP+ | Sorbitol (nmol/g) | Fructose (nmol/g) | Myoinositol (nmol/g) | PG (mM) | HbA1c (%) | BWI (g) | BWC (%) | |
| Control | 72 ± 37 | 216 ± 73 | 1,198 ± 301 | 3,078 ± 615 | 6.9 ± 0.5 | 4.5 ± 0.2 | 218 ± 8 | +132 ± 14 |
| Diabetic | 128 ± 58‡ | 2,901 ± 649† | 6,885 ± 1,791* | 1,941 ± 246* | 39.7 ± 3.6* | 14.7 ± 0.6* | 219 ± 4 | +64 ± 11* |
| +SDI | 81 ± 35○ | 11,241 ± 3,630*§ | 1,514 ± 755§ | 1,793 ± 287* | 35.6 ± 1.3* | 13.9 ± 0.6* | 221 ± 6 | +56 ± 14* |
| +ARI | 102 ± 58 | 43 ± 20*§# | 899 ± 170‡§¶ | 2,846 ± 673lI# | 36.1 ± 4.4* | 13.8 ± 1.2* | 224 ± 8 | +54 ± 18* |
Final plasma levels of glucose (PG), HbA1c, initial body weights (BWI), and body-weight change (BWC).
Data are expressed as mean ± SD for seven to 11 animals.
Different from Controls: *p ≤ 0.001, †p < 0.003, ‡p < 0.01.
Different from Diabetics: §p < 0.0001, lIp ≤ 0.015, ○p = 0.037.
Different from SDI-treated diabetics: #p = 0.0001, ¶p < 0.003.
Plasma glucose levels in diabetic rats were increased ∼sixfold (39.7 ± 3.6 mM vs. 6.9 ± 0.5 in controls; p ≤ 0.001); HbA1c levels were increased by ∼3.3-fold (14.7 ± 0.6% vs. 4.5 ± 0.2% in controls; p ≤ 0.001). Plasma glucose and HbA1c levels in ARI- and SDI-treated diabetic rats did not differ from those in untreated diabetics (Table 2).
Nerve sorbitol and fructose levels were increased by diabetes by 13.4- and 5.7-fold, respectively (Table 2). The SDI increased sorbitol levels another 3.9-fold and normalized fructose levels. The ARI reduced sorbitol and fructose levels to levels lower than those in controls (p < 0.01). Myoinositol levels were decreased ∼37% by diabetes and were normalized by the ARI but unaffected by the SDI (p < 0.0001 vs. SDI-treated diabetics).
Plasma levels of NEFA were 69 ± 17 μEq/dl in diabetics versus 42 ± 8 in controls (p < 0.004); plasma β-HBA levels were 102 ± 51 μM in diabetics vs. 27 ± 3 in controls (p < 0.001). Neither the SDI nor the ARI significantly attenuated NEFA or β-HBA levels in diabetics. Initial body weights were similar in controls and diabetics; however, diabetics gained significantly less weight than did controls (p < 0.05).
Reversal of MNCV deficits and NADH/NAD+c by SDI and ARI
Reversal Study 1
After 6 weeks of untreated diabetes, the MNCV was decreased ∼13–14% in all three groups of diabetic rats (Fig. 2, left panel). After 8 weeks of untreated diabetes, MNCV was decreased 17% (Fig. 2, middle panel). SDI and ARI administered during the last 2 weeks attenuated (but did not normalize) MNCV deficits to 11% and 4.6%, respectively. After 10 weeks of untreated diabetes, MNCV was decreased 14% and was statistically normalized by SDI and by ARI administered during the last 4 weeks (Fig. 2, right panel).
FIG. 2.

Reversal Study 1. Time course of reversal of impaired distal tibial MNCV by treatment with an SDI (200 mg/kg bwt/day) vs. an ARI (zopolrestat, 100 mg/kg bwt/day) initiated after 6 weeks of untreated diabetes. Mean ± SD; n = 9–10 rats for all parameters. Different from controls: *p < 0.001, †p < 0.05. Different from diabetics: ‡p < 0.001, §p < 0.04. Different from diabetics + SDI: lIp = 0.013.
Diabetes increased sciatic nerve NADH/NAD+c and NADH/NAD+m about twofold (Table 3). The ARI normalized the NADH/NAD+c, but not the NADH/NAD+m. The SDI failed to normalize NADH/NAD+c or NADH/NAD+m. (Failure of the SDI to normalize NADH/NAD+c is consistent with the substantially larger variance in NADH/NAD+c than in diabetics and ARI-treated diabetics and the unfavorable pharmacokinetics of SDI, as discussed earlier (31, 33, 45).
Table 3.
Reversal Study 1
| NADH/NAD+c | NADH/NAD+m | PG | HbA1c | NEFA | β-HBA | BWI | BWC | |
|---|---|---|---|---|---|---|---|---|
| Controls | 1.4 ± 0.5 | 32 ± 14 | 8.0 ± 1.8 | 3.7 ± 0.4 | 40 ± 12 | 27 ± 6 | 382 ± 7 | +48 ± 8 |
| Diabetics | 2.9 ± 0.9† | 64 ± 19† | 35.1 ± 4.7* | 14.1 ± 1.0* | 73 ± 24‡ | 107 ± 99* | 380 ± 8 | − 17 ± 14* |
| +SDI | 2.5 ± 1.4§ | 49 ± 30 | 36.6 ± 9.4* | 13.5 ± 0.9* | 65 ± 26lI | 130 ± 103* | 397 ± 18 | +0.9 ± 0.9* |
| +ARI | 1.8 ± 0.7# | 48 ± 18lI | 33.4 ± 11.9* | 13.0 ± 0.9* | 75 ± 31‡ | 99 ± 57* | 377 ± 12 | +3.8 ± 10* |
Sciatic nerve NADH/NAD+c and NADH/NAD+m, HbA1c, and plasma glucose (PG), nonesterified fatty acids (NEFA), and β-hydroxybutyrate (β-HBA) levels, initial body weights (BWIs) and body-weight change (BWC) for rats in which MNCV data are depicted in Fig. 2.
Data are expressed as mean ± SD for seven to 10 animals. NADH/NAD+c and NADH/NAD+m are calculated as described in the Research Design and Methods section and expressed as NADH/NAD+c × 10−3 and NADH/NAD+m × 10−3; plasma glucose levels are expressed as mM; HbA1c, as a percentage of total Hb; NEFA, as μEq/dl; β-HBA as (μM); BWI in grams; and BWC as a percentage change from BWI.
Different from Controls: *p ≤ 0.001, †p < 0.002, ‡p < 0.01, §p < 0.02, lIp < 0.04.
Different from Diabetics: #p = 0.013.
Diabetes increased plasma glucose levels ∼4.4-fold (35.1 ± 4.7 mM vs. 8.0 ± 1.8, p ≤ 0.001) and increased HbA1c levels 3.8-fold (14.1 ± 1.0% vs. 3.7 ± 0.4%; p ≤ 0.001). Plasma glucose levels and HbA1c levels in diabetic rats treated with SDI and ARI did not differ from those in untreated diabetics (Table 3).
Diabetes increased NEFA and β-HBA levels by about two- and fourfold; p ≤ 0.001). All three groups of diabetics failed to gain weight in contrast to controls. These parameters were unaffected by the SDI or ARI.
Reversal Study 2
After 6 weeks of untreated diabetes, MNCV deficits ranged from 9.3 and 14.3% before administration of SDI and ARI (Table 4). After 8 weeks of untreated diabetes, the MNCV deficit was 10.7% and was not attenuated by SDI or ARI treatment during the last 2 weeks. After 10 weeks of untreated diabetes, the MNCV deficit was 10.4% and was normalized by SDI and by ARI administered during the last 4 weeks. Four weeks of ARI treatment also normalized the associated 19% reduction in nerve blood flow; however, blood flow in SDI-treated diabetics was not significantly different from that in controls or untreated diabetics. Neither inhibitor attenuated the associated 2.5-fold increase in VAP. MABP was 132 ± 18 mm Hg in diabetics versus 148 ± 5 mm Hg in controls (p < 0.01) and was unaffected by the SDI or ARI.
Table 4.
Reversal Study 2: Time Course of Reversal of Distal Tibial MNCV Deficits after 2 and 4 Weeks of Treatment with the SDI or the ARI (Zopolrestat) Initiated after 6 Weeks of Untreated Diabetes (No Rx)
| |
MNCV |
|
|
|
|
|
||
|---|---|---|---|---|---|---|---|---|
| 6 wk (No Rx) | 8 wk (2 wk Rx) | 10 wk (4 wk Rx) | BF | VAP | Sorbitol | Fructose | Myoinositol | |
| Control | 58.0 ± 5.7 | 59.9 ± 4.5 | 58.9 ± 3.3 | 72 ± 10 | 76 ± 12 | 238 ± 43 | 1,000 ± 177 | 5,953 ± 2,125 |
| Diabetic | 49.7 ± 2.4* | 53.5 ± 4.1‡ | 52.8 ± 3.2* | 58 ± 12‡ | 190 ± 36* | 2,811 ± 692* | 7,229 ± 884* | 2,573 ± 425* |
| +SDI | 52.6 ± 3.7‡ | 52.8 ± 3.9* | 57.6 ± 1.5lI | 62 ± 12# | 213 ± 48* | 14,442 ± 2,290*§ | 1,163 ± 435§¶ | 2,292 ± 535*♦ |
| +ARI | 51.8 ± 5.0† | 55.0 ± 4.1‡ | 57.4 ± 3.3lI | 78 ± 15lI | 178 ± 41* | 85 ± 16*§ | 758 ± 148‡§ | 4,284 ± 1,379lI |
Also shown are sciatic nerve endoneurial blood flow (BF) and VAP (μg plasma/g/min) and sciatic nerve sorbitol, fructose, and myoinositol levels after 4 weeks of treatment. Data are expressed as mean ± SD for nine to 10 animals.
Different from Controls: *p ≤ 0.001, †p ≤ 0.005, †p ≤ 0.034.
Different from Diabetics: §p ≤ 0.001, lIp ≤ 0.01.
Different from ARI-Rx Diabetics: ♦p < 0.001, #p < 0.01, ¶p < 0.02.
Diabetes increased sciatic nerve sorbitol and fructose levels by 12-fold and sevenfold, respectively (Table 4). The SDI increased sorbitol levels an additional fivefold (61× controls) while normalizing fructose levels. The ARI decreased sorbitol and fructose levels to 36 and 76%, respectively, of controls; and fructose levels were 35% lower than those in SDI diabetics (p < 0.02). Myoinositol levels were decreased 57% by diabetes and were unaffected by the SDI; however, the ARI normalized myoinositol levels, which were 1.7-fold higher than those in untreated diabetics (p < 0.01) and ∼1.9-fold higher than those in SDI diabetics (p < 0.001).
Diabetes increased plasma glucose levels 4.5-fold (36.2 mM ±3.8 vs. 8.0 ± 1.0 in controls; p ≤ 0.001); plasma glucose levels in SDI- and ARI-treated diabetics were 34.4 ± 3.5 and 35.0 ± 3.7 mM, respectively (p ≤ 0.001 vs. controls) and did not differ from those in untreated diabetics (p > 0.05).
Diabetes also increased HbA1c levels by 3.9-fold (14.0 ± 1.4% vs. 3.6 ± 0.2% in controls; p ≤ 0.001); HbA1c levels in SDI- and ARI-treated diabetics were 13.4 ± 1.6% and 13.4 ± 1.1%, respectively (p ≤ 0.001 vs. controls) and did not differ from those in untreated diabetics (p > 0.05).
Diabetes tended to increase NEFA (58 ± 21 μEq/dl vs. 42 ± 14 μEq/dl in controls); however, the difference was not significant (p > 0.05). NEFA levels in SDI- and ARI-treated diabetics were slightly higher than those in untreated diabetics (71 ± 39 and 77 ± 26 μEq/dl, respectively; p < 0.01 vs. controls for both groups) but did not differ from those in untreated diabetics (p > 0.05). Diabetes increased β-HBA levels by ∼5.4-fold to 113 ± 84 μM vs. 21 ± 4 in controls (p < 0.001); β-HBA levels in SDI- and ARI-treated diabetics were 71 ± 39 and 77 ± 26, respectively (p ≤ 0.01 vs. controls and p > 0.05 vs. untreated diabetics). Initial body weights were 417 ± 11 g in controls and diabetics; final body weights increased 35 ± 7% in controls vs. a weight loss of −9 ± 9% in untreated diabetics (p < 0.001). Weight losses in SDI- and ARI-treated diabetics were −6 ± 4% and −6 ± 10%, respectively (p > 0.05 vs. untreated diabetics).
Effects of diabetes, SDI, and ARI on sciatic nerve: (a) malate levels and malate/pyruvate ratios and (b) lactate/pyruvate ratios manifested by changes in lactate and/or pyruvate levels Table 5
Table 5.
Effects of Diabetes, SDI, and ARI on Sciatic Nerve: Lactate and Pyruvate Levels, and Lactate/Pyruvate (L/P) Ratios in Rats with Diabetes of 5-, 10- (Reversal Study 1), and 18-Weeks Duration, and Malate and Malate/Pyruvate (M/P) Ratios in Rats with Diabetes of 18-Weeks Duration
| |
5 wk |
10 wk |
18 wk |
|||||
|---|---|---|---|---|---|---|---|---|
| Lactate | Pyruvate | Lactate | Pyruvate | Lactate | Pyruvate | Malate | M/P | |
| Controls | 3.52 + 1.19 | 0.32 + 0.08 | 2.03 ± 0.68 | 0.16 ± 0.04 | 4.90 ± 1.78 | 0.23 + 0.07 | 0.50 ± 0.07 | 2.41 ± 1.25 |
| L/P | 11.56 ± 4.32 | 12.70 ± 4.39 | 23.41 ± 7.13 | |||||
| Diabetics | 6.36 ± 2.37† | 0.36 ± 0.13 | 3.13 ± 0.89† | 0.13 ± 0.041 | 4.93 ± 1.39 | 0.13 + 0.05§ | 0.49 ± 0.11 | 4.32 ± 1.97* |
| L/P | 18.17 ± 4.41* | 26.13 ± 8.16* | 46.03 ± 17.87* | |||||
| D+SDI | 5.88 ± 2.93§ | 0.48 ± 0.20§2 | 2.76 ± 0.88§ | 0.15 ± 0.06 | 5.01 ± 1.50 | 0.23 ± 009b | 0.56 ± 0.08 | 2.71 ± 1.17b |
| L/P | 12.43 ± 319b | 22.77 ± 12.94§ | 27.21 ± 11.48b | |||||
| D+ARI | 5.28 ± 2.06a | 0.46 ± 0.16§2 | 3.87 ± l.57§ | 0.20 ± 0.05a3 | 3.95 ± 0.96 | 0.16 ± 0.06c | 0.49 ± 0.12 | 3.44 ± 1.94 |
| L/P | 11.61 ± 3.24a | 16.13 ± 655b | 27.70 ± 8.69a | |||||
Data are expressed as mean ± SD for lactate and pyruvate levels and mean L/P ratios for animals in each group. Numbers of animals for each duration of diabetes are shown in corresponding Tables 1 and 2 and Fig. 1.
Lactate, pyruvate, and malate levels are expressed as nmol/μg DNA.
Different from Controls: *p < 0.001, †p ≤ 0.005, §p < 0.03, 1p = 0.05-0.1.
Different from Diabetics: ap < 0.004, bp < 0.01, cp < 0.05, 2p = 0.05–0.1.
Different from Diabetics + SDI: 3p = 0.02.
Effects of untreated diabetes
Lactate/pyruvate ratios were increased by 1.5- to twofold in all three studies and were attributable largely to increased lactate levels, except in the 18-week study in which lactate levels were identical to controls, whereas pyruvate levels were decreased 43% (Table 5). In the 10-week study, the increased lactate/pyruvate ratio also was contributed to by a 19% decrease in pyruvate levels that approached statistical significance (p = 0.05–0.1). Malate levels did not differ from controls, whereas malate/pyruvate ratios were increased ∼80% (p < 0.001 vs. controls).
Effects of SDI treatment
The SDI normalized lactate/pyruvate ratios in the 5- and 18-week studies, but not in the 10-week reversal study. In the 5-week study, 87% normalization of lactate/pyruvate ratios was due largely to increased (33%) pyruvate levels, together with decreased (8%) lactate levels. In the 18-week study, 83% normalization was due entirely to increased pyruvate levels (77%). Malate levels did not differ from those in controls or diabetics, whereas malate/pyruvate ratios were normalized.
Effects of ARI treatment
The ARI normalized lactate/pyruvate ratios in all three studies. In the 5-week study, normalization was manifested by the combination of a marginally significant increase in pyruvate levels (28%; p = 0.05–0.01) and a 17% (p = 0.26) reduction in mean lactate levels. In the 10-week study, normalization was due to significantly increased pyruvate levels. In the 18-week study, normalization was due to significantly increased pyruvate levels and a statistically insignificant reduction in lactate levels. Malate levels and malate/pyruvate ratios were not significantly different from those in the other groups.
Discussion
The observations in these experiments support two fundamental conclusions and concepts: (a) increased sorbitol oxidation plays a critical role in mediating diabetes-induced early neural and vascular dysfunction that precede pathologic structural changes, and (b) neural and vascular dysfunction evoked by sorbitol oxidation are primarily sequelae of increased cytoplasmic NADH/NAD+c rather than elevated mitochondrial NADH/NAD+m. Notably, these are the first studies in which neural or vascular dysfunction or both, NADH/NAD+c or NADH/NAD+m or both have been assessed in the same animal. Previous investigators have assessed neural and vascular dysfunction but not NADH/NAD+c or NADH/NAD+m (6), or NADH/NAD+c and NADH/NAD+m, but not neural or vascular dysfunction (34).
The first conclusion is supported by the comparable efficacy of SDI and ARI in preventing and reversing MNCV deficits (Figs. 1 and 2, Table 4) and in preventing vascular dysfunction in sciatic nerve, retina, and aorta in rats with diabetes of 5 weeks' duration (Table 1).
In two independent studies, the SDI and the ARI reversed MNCV deficits (Fig. 2, Table 4) after 4 (but not 2) weeks of treatment, after 6 weeks of untreated diabetes. We confirm the previous observation of Cameron et al. (6) that SDI treatment for 2 weeks failed to reverse preexisting MNCV deficits. We observed in addition, however, that SDI treatment for 4 weeks was as efficacious as ARI in reversing MNCV deficits (Fig. 2). The biochemical explanation for clear SDI efficacy after 4 (but not after 2) weeks of treatment is unclear and will require future studies. The same SDI (albeit named differently) was used by Cameron et al. and by us. [Chemical structures of ARI and SDI used by Cameron et al. (6), Obrosova et al. (34), and by us are shown in OAS V.]
Failure of the ARI zopolrestat to reverse MNCV deficits after 2 weeks of treatment in our studies is likely attributable to its lower in vivo potency versus the ARI WAY-121,509 used by Cameron et al. Consistent with this notion, sciatic nerve fructose levels in WAY-121,509–treated diabetics were markedly reduced to only 16% of fructose levels in nondiabetic controls; in contrast, fructose levels in zopolrestat-treated diabetics were 76% of fructose levels in nondiabetic controls. The suggestion by Cameron et al. (6) that MNCV deficits in untreated diabetics are attributable to decreased blood flow (i.e., ischemia), even in diabetes of short duration (6, 7), is discordant with the current observations and with the findings of Chang et al. (10), Ido et al. (21), and others addressed in OAS II-A.
Treatment of diabetic rats with SDI-157 (also named S-0773) in an earlier study by Obrosova et al (34) failed to prevent increases in neural NADH/NAD+c. That finding differs from observations in the current experiments in which treatment with CP-166,572 (also named SDI-158) normalized sciatic nerve NADH/NAD+c (Fig. 1, Table 1) and was as efficacious as ARI in preventing MNCV deficits in all three experiments in which MNCV was assessed (Figs. 1 and 2; Table 4). (Chemical structures of SDIs shown in OAS V.)
SDI-157 is a prodrug that is activated in vivo in the liver to the active chemical species SDI-158 (13). SDI-157 was administered at a dose of 100 mg/kg bwt/day, whereas the SDI-158 (CP-166,572) was administered at a twofold higher dose of 200 mg/kg bwt/day. Because the half-life of SDI-157 and SDI-158 in serum and nerve of rats is very short (31-page 359), i.e., < 30 min, the duration of its pharmacologic effect is expected to be highly sensitive to the plasma level achieved. Moreover, the efficacy of SDI also is likely to be sensitive to variability in tissue drug levels because SDH blockade markedly elevates nerve levels of sorbitol substrate for SDH (e.g., about four- to fivefold vs. untreated diabetics (Tables 1,2, and 4); as SDH blockade wanes, rates of sorbitol oxidation can exceed rates in untreated diabetics (45).
The 44% higher coefficient of variation of NADH/NAD+c ratios in SDI-treated diabetics versus ARI-treated diabetics (Table 3) suggests that inhibitory levels of the short-half-life SDI were not maintained in some of the animals in this group, despite the high dose of SDI administered (200 mg/kg bwt/day) and the water-dosing paradigm. This probability is consistent with evidence that a very high degree of SDH inhibition (i.e., >91% normalization of nerve fructose levels) must be achieved to demonstrate SDI efficacy, as demonstrated for ARI (6). Thus, we hypothesize that the failure of SDI to normalize neural NADH/NAD+c in the earlier experiment (34) may be explained by the combined effects of (a) the 50% lower dose administered of the prodrug SDI-157 versus the active drug SDI-158 in the present experiments, (b) the rapid build-up of sorbitol substrate for SDH caused by the SDI, and (c) the very short half-life of the active SDI.
Therefore, the suggestion that hypoxia-like metabolic changes [i.e., increases in NADH/NAD+c, in tissues of diabetic rats (55)] are sequelae of increased AR activity, independent of increased sorbitol oxidation (36) remains discordant with the present observations, as well as with previous findings demonstrating that exposure of normoxic normoglycemic cells and tissues to elevated sorbitol levels in vivo and in vitro evokes metabolic imbalances or vascular dysfunction or both, like those evoked by hyperglycemia (9, 12, 26, pages 9–10 in OAS IV-A of 30, 46, 47, 49, 53).
Likewise, the suggestion (4) that the increase in free NADH/NAD+c evoked by diabetes is attributable to a marked decrease in total NAD+t because of its consumption by poly(ADP-ribose) polymerase (PARP) is inconsistent with (a) increased levels of total NADHt with no change in NADt (NADHt plus NAD+t) (14) and increased levels of NADHt and NAD+t (18) in retinas of diabetic rats, (b) the insignificant decrease in free NAD+c associated with a twofold increase in NADH/NAD+c discussed later, (c) the demonstration that hyperglycemia increases free NADH/NAD+c = lactate/pyruvate × KLDH ratios in human erythrocytes (48) that lack nuclei and mitochondria, and (d) observations of other investigators addressed in OAS II-E. Interestingly, recent observations suggest that activated PARP may further contribute to oxidative–nitrosative stress (OAS II-E, 9).
The second conclusion (see earlier; i.e., the primacy of increased NADH/NAD+c vs. increased NADH/NAD+m in mediating diabetes-induced neural and vascular dysfunction) is supported by observations that (a) SDH and AR are known to be primarily cytoplasmic enzymes (31), and (b) inhibition of either enzyme normalized/attenuated increased sciatic nerve free NADH/NAD+c (Fig. 1; Table 1), impaired MNCV (Figs. 1 and 2; Table 4), and vascular dysfunction (Table 1), while having little or no impact on associated increases in free NADH/NAD+m (Fig. 1; Table 3). Whatever putative mitochondrial changes may have contributed to neural and vascular changes, independent of the increase in NADH/NAD+m, the observations that ARI and SDI prevented vascular and neural dysfunction indicates that those putative changes also were prevented. The most likely explanation for the increases in NADH/NAD+m in these experiments is increased oxidation of fatty acids and/or ketones that were significantly increased in Reversal Study 1 (Table 3) and in the 18-week study (see Results) and were not attenuated by ARI or SDI.
Limitations of the current studies are that they do not directly address (a) potentially important increased superoxide production caused by hypoxic/ischemic vascular disease in chronic diabetes (OAS I-C2) or (b) mitochondrial superoxide production. The effects of the two types of inhibitors of cytoplasmic enzymes (AR and SDH) in the present studies do not exclude potentially important downstream enzymatic reactions/sequelae in the same or other cellular compartments. A positive control to normalize NADH/NAD+m, but not NADH/NAD+c, would be of interest for future studies. The possible relationship between increased mitochondrial leakage, i.e., opening of MPTPs (1) and changes in NADH/NAD+m] also need further study. Because the effects of diabetes on NADH/NAD+c and NADH/NAD+m are complex and their roles in initiating complications of diabetes remain controversial (4–8, 10, 11, 21, 29, 34, 36, 56), they are discussed critically in more detail in the current OAS II and in the OAS in (30) for interested readers. Notably, observations and speculations thought to be inconsistent with the importance of sorbitol oxidation do not withstand scrutiny.
An additional limitation of the current studies is the question of the absolute specificity of the inhibitors used. Off-target effects are always possible for low-molecular-weight inhibitors. This is the reason that two structurally distinct inhibitors of AR were used (i.e., sorbinil and zopolrestat). That similar results were obtained with either ARI attests to the salutary effects being a result of inhibition of the intended target, AR. The result is further supported and refined by using the SDI, an inhibitor in the second step of the pathway. However, only one structural class of SDIs is active in vivo, the one used. SDI normalized impaired nerve conduction in diabetic rats, but paradoxically evoked ultrastructural changes in autonomic nerves (iliac mesenteric nerves) and in prevertebral sympathetic superior mesenteric ganglia in the same animals (OAS V-A in ref.30). The functional significance and mechanism of those ultrastructural changes remains unclear.
The fundamental issue raised by the current observations is the basic mechanism by which NADHc generated by oxidation of sorbitol causes (a) metabolic imbalances and associated neural and vascular dysfunction observed in early diabetes, and (b) late complications of diabetes that are now generally agreed to be linked to excess production of ROS (4, 5, 20, 29, 53). Equations 1 and 2 (see Methods) are the keys to understanding this mechanism and the pathophysiologic importance of sorbitol oxidation in generating relatively small molar increases in free NADHc, uncoupled from subsequent downstream production of equimolar pyruvate.
As shown in Eq. 2, free NADH/NAD+c = (lactate/pyruvate) × KLDH (KLDH = 1.11 × 10⁻⁴ at pH = 7.0; i.e., ∼1/10,000). Molar lactate/pyruvate ratios in a wide spectrum of normal cells and tissues range from ∼10/1 to 20/1 [e.g., liver (54) and nerve (Table 5)]. Therefore, based on Eq. 2, a lactate/pyruvate ratio of 10:1 corresponds to a free NADH/NAD+c ratio of ∼10/10,000 or ∼1/1000 or ∼0.001 (i.e., ∼1 mole of NADHc per 1,000 moles of NAD+c). In light of this large difference in concentrations of NADHc and NAD+c, molar changes in NADHc have a far greater impact on NADH/NAD+c and lactate/pyruvate ratios than do equimolar changes in pyruvate, lactate, or NAD+c, in decreasing order of impact. For example, accumulation of just 1 additional mole of NADHc per 1,000 moles of NAD+c will increase NADHc levels by about twofold (from 1 to 2 moles of NADHc per 1,000 moles of NAD+c). This will be manifested by a corresponding approximately twofold increase in NADH/NAD+c, from ∼0.001 to ∼0.002, and in lactate/pyruvate ratios from ∼10 to ∼20, as observed (a) in the current studies in the 5-week experiment (Tables 1 and 5), the 10-week Reversal Study 1 (Tables 3 and 5), and the 18-week experiment (Fig. 1; Table 5); (b) in previous reports in retina, sciatic nerve, and liver of diabetic animals (17, 34–37, 41, 54), and (c) normal rat retinas and sciatic nerve endoneuria incubated in 30 versus 5 mM glucose that are prevented by ARI (30, and current OAS IV).
If the 1 additional mole of NADHc per 1,000 moles of NAD+c were generated by reduction of 1 mole of NAD+c to NADHc via oxidation of sorbitol, then SDI or ARI should prevent the increase in NADH/NAD+c, as observed in these experiments (Fig.1; Table 1, and by the ARI in Table 3). In contrast, if the increases in NADH/NAD+c were due to increased NADHc formation independent of sorbitol oxidation (e.g., by hypoxia), ARI and SDI would not be expected to affect it. This prediction has been tested by Nyengaard et al. (30) on the additive effects of hyperglycemia and hypoxia on free NADH/NAD+c (manifested by increases in lactate/pyruvate ratios) in incubated normal rat retinas and sciatic nerve endoneuria (OAS IV). Hyperglycemia and hypoxia additively increased lactate/pyruvate ratios, triose phosphates, and G3P; the increases evoked by hyperglycemia were prevented by ARI, which did not affect the associated increases evoked by hypoxia.
The evidence that accumulation of just 1 mole of free NADHc per 1,000 moles of free NAD+c doubles the concentration of free neural NADHc and is associated with increased neural blood flow suggests that (a) the level of free NADHc is an exquisitely sensitive sensor of blood flow need due to “hyperglycemic pseudohypoxia” (55), as well as true hypoxia, manifested by increases in NADH/NAD+c; and (b) increased levels of NADHc fuel signaling pathways that augment blood flow, (e.g., Table 1) (22, 23, 27, 51). This interpretation is consistent with observations (46) that exposure of granulation tissue to elevated levels of sorbitol (at normal glucose levels) or hyperglycemia increased blood flow and VAP (identical to those in nerve and retina in Table 1) that were prevented by SDI, SOD, or VEGF antibodies.
The near-equilibrium between free NADH/NAD+c and lactate/pyruvate ratios maintained by LDH also plays a pivotal role in modulating energy metabolism, blood flow, and superoxide production in a spectrum of physiologic and pathologic conditions, including hypoxia and increased physiologic work in humans and animals addressed in OAS I-C. Thus, infusion of lactate (which produces “prooxidant” NADHc when oxidized by LDH) (a) increases blood flow in sciatic nerve, retina, and other tissues in normal rats that are prevented by co-infusion of “antioxidant” pyruvate (23); and (b) augments the already increased blood flows evoked by increased physiologic work in normal humans and animals that also are prevented by co-infusion of pyruvate (22, 23, 27, 51, and OAS 1-C).
Observations in the 18-week study that diabetes increased sciatic nerve NADPH/NADP+c (Table 2) and NADH/NAD+c by ∼1.8-fold (Fig. 1), both of which were prevented by the SDI, are consistent with corresponding observations in an earlier report that were prevented by an ARI (35). Although the explanation for the increase in NADPH/NADP+c is not entirely clear, evidence that increased levels of NADHc generated by oxidation of sorbitol fuel superoxide production (46) and diacylglycerol synthesis (57) suggests that increased levels of NADHc might also fuel reduction of oxidized NADP+c to NADPHc via the pyruvate/malate cycle (42), discussed in OAS I-B. This possibility is consistent with evidence that 40% of the NADPH + H+ used for fatty acid synthesis from glucose is provided by the pyruvate/malate cycle. These observations suggest that increased NADHc generated by oxidation of sorbitol may augment superoxide production by three mechanisms: (a) as substrate for NADH-driven oxidases, (b) as substrate for the pyruvate/malate cycle to increase NADPHc as fuel for NADPH-driven oxidases, and (c) by fueling DAG synthesis, which activates the PKC that activates some isoforms of NADPH oxidase (Fig. 3). The third mechanism is supported by observations (57) that exposure of skin-chamber granulation tissue vessels to elevated glucose levels in nondiabetic rats (circumventing other metabolic and hormonal imbalances associated with the diabetic milieu) increased DAG levels and VAP, both of which were prevented by addition of pyruvate (which compensates for the uncoupling of pyruvate production when NADHc is produced by sorbitol oxidation rather than by glycolysis).
FIG. 3.

NADHc generated by sorbitol oxidation is reoxidized to NAD+c largely by enzymes that promote the development of diabetic complications. (A) Under steady-state normoglycemic conditions, glucose is metabolized via glycolysis to synthesize ATP [in the cytoplasm via substrate phosphorylation (SP) and in mitochondria via oxidative phosphorylation (OP)] only after electrons and protons are transferred from GA3P to oxidized NAD+c (by GA3P-DH), reducing it to NADHc followed by downstream formation of pyruvate equimolar to NADHc. Electrons and protons carried by NADHc can be transferred into mitochondria via the malate-aspartate (Mal-Asp) and glycerol phosphate (G3P) electron shuttles (❸); pyruvate can be transferred into mitochondria via a mitochondrial pyruvate carrier. All cells generate NADHc and pyruvate via glycolysis faster than they are used for ATP synthesis in mitochondria. Excess NADHc is reoxidized to NAD+c largely by lactate dehydrogenase (LDH), coupled to reduction of excess pyruvate to lactate (❶) that diffuses out of the cell (e.g., for retina: 30, 50; for nerve: OAS IV). Much smaller amounts of glucose are metabolized by the sorbitol pathway through which sorbitol dehydrogenase (SDH) catalyzes oxidation of sorbitol to fructose coupled to reduction of equimolar NAD+c to NADHc. However, SDH does not generate pyruvate required for reoxidation of NADHc to NAD+c by LDH. This NADHc is reoxidized to NAD+c largely via alternative pathways (❷): (1) NADH-driven oxidases that generate basal levels of superoxide (O2−) and (2) glycerol 3-phosphate-DH (G3P-DHc), which fuels synthesis of basal levels of diacylglycerol (DAG) and protein kinase C (PKC) activity. Both of these mechanisms of reoxidation of NADHc to NAD+c maintain normal steady-state ratios of NADH/NAD+c = (lactate/pyruvate) × KLDH (Eq. 2 in Methods). (B) Hyperglycemia augments glucose metabolism via glycolysis and via the sorbitol pathway. In normal rat retina and sciatic nerve endoneuria incubated in 30 vs. 5 mM glucose, glycolysis was increased ∼1.5 fold [manifested by increased lactate production] (30, 50, current OAS-IV). Oxidation of sorbitol in the same endoneuria (manifested by production of fructose equimolar to NADHc) was increased ∼11-fold. Because oxidation of sorbitol does not form pyruvate, NADHc levels increase by 1.5- to twofold (manifested by increased ratios of NADH/NAD+c in Fig. 1, Tables 1 and 3; refs.17, 34–37, 41), and much more NADHc is reoxidized to NAD+c via alternative pathways (❷) (i.e., by NADHc-driven oxidases that increase superoxide production and by G3P-DHc, which increases synthesis of diacylglycerol (DAG), activation of protein kinase C (PKC), and activation of NADPH-driven oxidases to augment superoxide production further. The 1.5- to twofold increases in NADHc also may contribute to product inhibition of GA3P-DH, which increases levels of GA3P and DHAP (i.e., triose phosphates-TP (30, 48, 50, OAS IV) that are in equilibrium. Nonenzymatic degradation of TP (primarily DHAP) forms methylglyoxal (MG), a potent nonenzymatic glycation agent. (For interpretation of the references to color in this figure legend, the reader is referred to the web version of this article at www.liebertonline.com/ars).
Taken together, observations in these experiments support an important role for increased “prooxidant” NADHc generated by sorbitol oxidation in fueling superoxide production, metabolic imbalances, and neural and vascular dysfunction evoked by hyperglycemia. Uncoupling of prooxidant NADHc formed by sorbitol oxidation from equimolar formation of “antioxidant” pyruvate constrains reoxidation of NADHc to NAD+c by LDH coupled to the reduction of pyruvate to lactate that diffuses out of cells (Fig. 3). Thus, NADHc levels increase (∼1.5- to twofold) until their mass-action effect drives reoxidation of NADHc to NAD+c by (a) NADH-driven oxidases that produce superoxide, and (b) G3P-DHc that promotes de novo synthesis of DAG and activation of PKC (Fig. 3) that activates some isoforms of NADPH-driven oxidases.
Observations that ARI and SDI increased sciatic nerve pyruvate levels that were statistically significant or approached significance in five of six interventions (Table 5) were associated with (a) normalization of MNCV deficits, and (b) normalization/attenuation of associated increases in NADH/NAD+c and vascular dysfunction that are consistent with well-known antioxidant effects of pyruvate (OAS I). Pyruvate (a) stoichiometrically degrades H2O2 coupled to its own nonenzymatic oxidative decarboxylation, and (b) prevents superoxide production by NADH-driven oxidases by driving reoxidation of “prooxidant” NADHc to NAD+c by LDH, coupled to reduction of “antioxidant” pyruvate to lactate that diffuses out of cells (Fig. 3).
We suggest that the second mechanism may be especially important, because it also will attenuate product inhibition of GA3P-DH (by increased levels of NADHc) and associated metabolic imbalances (i.e., increased triose phosphate levels that (a) fuel synthesis of DAG that activates PKC that activates some isoforms of NADPH-driven oxidases, etc. (30-OAS III p. 7, 57, and current OAS I); and (b) undergo concentration-dependent degradation to methylglyoxal, a toxic and potent glycating agent (Fig. 3). GA3P-DH activity also can be inhibited by oxidative damage caused by superoxide; the present observations support the importance of increased sorbitol oxidation as the primary source of superoxide rather than increased mitochondrial oxidation of pyruvate (4, 5, 29).
Although we conclude that our current observations (together with evidence published by other investigators) are consistent with a key role for increased sorbitol oxidation in mediating diabetic complications, it is important that we also identify credible alternative interpretations of observations and caveats to various speculations in the literature. For interested readers, these are discussed in detail in OAS II.
Therapeutic implications of these experiments include the need to minimize metabolism of glucose via the sorbitol pathway by (a) maintaining glucose levels as close to normal as feasible, and (b) developing more-potent ARIs to prevent sorbitol oxidation and associated production of superoxide and metabolic imbalances that mediate complications of diabetes (31, 32). Recent observations in animal models of diabetes suggest that the disappointing efficacy of ARIs in normalizing neural and vascular dysfunction in past clinical trials may be largely attributable to inadequate inhibition of the sorbitol pathway (31, 32). Pyruvate supplementation in some form also merits further exploration in view of its extraordinary antioxidant effects in animal models of diabetes and hypoxic injury (OAS I-C).
Conclusions
Observations in these experiments support the importance of increased “prooxidant” NADHc generated by sorbitol oxidation in fueling superoxide production and associated metabolic imbalances, impaired nerve conduction, and vascular dysfunction evoked by hyperglycemia. Uncoupling of “prooxidant” NADHc formed by sorbitol oxidation from equimolar formation of “antioxidant” pyruvate constrains reoxidation of NADHc to NAD+c by LDH, which is coupled to the reduction of pyruvate to lactate that diffuses out of cells (Fig. 3). Increasing NADHc levels drive reoxidation of NADHc to NAD+c by (a) NADH-driven oxidases that produce superoxide, and (b) G3P-DHc, which promotes synthesis of DAG, activation of PKC, and activation of NADPH-driven oxidases that further augment superoxide production (Fig. 3).
Attenuation of diabetes-induced vascular and neural dysfunction by ARI, SDI, and pyruvate supplementation is explained by (a) prevention of sorbitol formation by ARI, (b) inhibition of sorbitol oxidation by SDI, and (c) reoxidation of excess NADHc to NAD+c coupled to reduction of pyruvate to lactate by LDH rather than NADH- and NADPH-driven oxidases and G3P-DHc.
Supplementary Material
Abbreviations Used
- AR
aldose reductase
- ARI
aldose reductase inhibitor
- BREC
bovine retinal endothelial cell
- DAG
diacylglycerol
- DHAP
dihydroxyacetone phosphate (a triose phosphate-TP
- GA3P
glyceraldehyde 3-phosphate (another triose phosphate-TP)
- GA3P-DH
GA3P-dehydrogenase
- G3P
glycerol 3-phosphate
- G3P-DHc
glycerol 3-phoshate-dehydrogenase (cytosolic)
- G3P-DHm
glycerol 3-phoshate-dehydrogenase (mitochondrial)
- GSH
reduced glutathione
- GSSG
oxidized glutathione
- H2O2
hydrogen peroxide
- HUVEC
human umbilical cord endothelial cell
- LDH
lactate dehydrogenase
- L/P
lactate/pyruvate ratio
- MABP
mean arterial blood pressure
- MDA
malondialdehyde
- MG
methylglyoxal
- MNCV
motor nerve conduction velocity
- MPTP
mitochondrial permeability transition pore
- NEFA
nonesterified fatty acid
- NOS
nitric oxide synthase
- O2•−
superoxide
- OAS
Online Appendix Section
- OP
oxidative phosphorylation
- PARP
poly(ADP-ribose) polymerase
- PKC
protein kinase C
- ROS
reactive oxygen species
- SDH
sorbitol dehydrogenase
- SDI
sorbitol dehydrogenase inhibitor
- SIRT1
silent information regulator 2 homolog 1 (an NAD-dependent deacetylase)
- SOD
superoxide dismutase
- SP
substrate phosphorylation
- TCA
tricarboxylic acid cycle (Krebs cycle, citric acid cycle)
- TP
triose phosphate
- VEGF
vascular endothelial growth factor
Footnotes
This research was performed in the Department of Pathology, Washington University School of Medicine, St. Louis, MO.
Acknowledgments
These studies were supported by NIH grants HL-39934 and EY-06600, Fonden til Laegevidenskabens Fremme (Copenhagen), the Lundbeck Foundation (Copenhagen), and the Kilo Research Foundation (St. Louis, MO). We thank Professor Clay Semenkovich for his careful reading of an earlier draft of this manuscript and for his suggestions and comments for revisions. We thank Eva Ostrow, Judi Burgan, Sam Smith, Joyce Marvel, and Nemani Rateri (in the Department of Pathology) and David A. Beebe (Pfizer Global Research and Development) for their excellent technical assistance.
Author Disclosure Statement
No competing financial interests exist. At the time the work in this manuscript was performed, BLM and PJO were employees of Pfizer Inc., Pfizer Global Research and Development, Groton, CT.
References
- 1.Ananthakrishnan R. Kaneko M. Hwang YC. Quadri N. Gomez T. Li Q. Caspersen C. Ramasamy R. Aldose reductase mediates myocardial ischemia-reperfusion injury in part by opening mitochondrial permeability transition pore. Am J Physiol Heart Circ Physiol. 2009;296:H333–H341. doi: 10.1152/ajpheart.01012.2008. [DOI] [PMC free article] [PubMed] [Google Scholar]
- 2.Bassenge E. Sommer O. Schwemmer M. Bunger R. Antioxidant pyruvate inhibits cardiac formation of reactive oxygen species through changes in redox state. Am J Physiol Heart Circ Physiol. 2000;279:H2431–H2438. doi: 10.1152/ajpheart.2000.279.5.H2431. [DOI] [PubMed] [Google Scholar]
- 3.Bergmeyer H. Methods of enzymatic analysis. New York: Academic Press; 1974. pp. 1836–1839. [Google Scholar]
- 4.Brownlee M. Biochemistry and molecular cell biology of diabetic complications. Nature. 2001;414:813–820. doi: 10.1038/414813a. [DOI] [PubMed] [Google Scholar]
- 5.Brownlee M. The pathobiology of diabetic complications: a unifying mechanism. Diabetes. 2005;54:1615–1625. doi: 10.2337/diabetes.54.6.1615. [DOI] [PubMed] [Google Scholar]
- 6.Cameron NE. Cotter MA. Basso M. Hohman TC. Comparison of the effects of inhibitors of aldose reductase and sorbitol dehydrogenase on neurovascular function, nerve conduction and tissue polyol pathway metabolites in streptozotocin-diabetic rats. Diabetologia. 1997;40:271–281. doi: 10.1007/s001250050674. [DOI] [PubMed] [Google Scholar]
- 7.Cameron NE. Cotter MA. Low PA. Nerve blood flow in early experimental diabetes in rats: relation to conduction deficits. Am J Physiol. 1991;261:E1–E8. doi: 10.1152/ajpendo.1991.261.1.E1. [DOI] [PubMed] [Google Scholar]
- 8.Ceriello A. Motz E. Is oxidative stress the pathogenic mechanism underlying insulin resistance, diabetes, and cardiovascular disease? The common soil hypothesis revisited. Arterioscler Thromb Vasc Biol. 2004;24:816–823. doi: 10.1161/01.ATV.0000122852.22604.78. [DOI] [PubMed] [Google Scholar]
- 9.Chang K. Allison W. Harlow J. Willamson JR. Aminoguanidine prevents glucose- and sorbitol-induced vascular dysfunction in skin chamber granulation tissue. Diabetes. 1991;40(suppl 1):210A. [Google Scholar]
- 10.Chang K. Ido Y. LeJeune W. Williamson JR. Tilton RG. Increased sciatic nerve blood flow in diabetic rats: assessment by “molecular” vs. particulate microspheres. Am J Physiol. 1997;273:E164–E173. doi: 10.1152/ajpendo.1997.273.1.E164. [DOI] [PubMed] [Google Scholar]
- 11.Diederen RM. Starnes CA. Berkowitz BA. Winkler BS. Reexamining the hyperglycemic pseudohypoxia hypothesis of diabetic oculopathy. Invest Ophthalmol Vis Sci. 2006;47:2726–2731. doi: 10.1167/iovs.06-0076. [DOI] [PMC free article] [PubMed] [Google Scholar]
- 12.Frangos M. Smith S. Stantiago J. Kilo C. Sorbitol-induced imbalances in glycolysis in human erythrocytes are reduced by pyruvate. Diabetes. 1990;39(suppl 1):S270A. [Google Scholar]
- 13.Geisen K. Utz R. Grotsch H. Lang HJ. Nimmesgern H. Sorbitol-accumulating pyrimidine derivatives. Arzneimittelforschung. 1994;44:1032–1043. [PubMed] [Google Scholar]
- 14.Graymore CN. Brown H. The effects of sodium salicylate on the metabolism of the retina. Exp Eye Res. 1965;4:364–369. doi: 10.1016/s0014-4835(65)80053-7. [DOI] [PubMed] [Google Scholar]
- 15.Halestrap AP. Clarke SJ. Khaliulin I. The role of mitochondria in protection of the heart by preconditioning. Biochim Biophys Acta. 2007;1767:1007–1031. doi: 10.1016/j.bbabio.2007.05.008. [DOI] [PMC free article] [PubMed] [Google Scholar]
- 16.Hasan KS. Santiago JV. Willamson JR. Acute hyperglycemia-induced increases in regional blood flow are prevented by pyruvate and by tolrestat. Diabetes. 1993;42(suppl 1):189A. [Google Scholar]
- 17.Heath H. Kang SS. Philippou D. Glucose, glucose-6-phosphate, lactate and pyruvate content of the retina, blood and liver of streptozotocin-diabetic rats fed sucrose, or starch-rich diets. Diabetologia. 1975;11:57–62. doi: 10.1007/BF00422819. [DOI] [PubMed] [Google Scholar]
- 18.Heath H. Rutter AC. Beck TC. Reduced and oxidized pyridine nucleotides in the retinae from alloxan-diabetic rats. Vision Res. 1962;2:333–342. [Google Scholar]
- 19.Hedeskov CJ. Capito K. Thams P. Cytosolic ratios of free [NADPH]/[NADP+] and [NADH]/[NAD+] in mouse pancreatic islets, and nutrient-induced insulin secretion. Biochem J. 1987;241:161–167. doi: 10.1042/bj2410161. [DOI] [PMC free article] [PubMed] [Google Scholar]
- 20.Ido Y. Pyridine nucleotide redox abnormalities in diabetes. Antioxid Redox Signal. 2007;9:931–942. doi: 10.1089/ars.2007.1630. [DOI] [PubMed] [Google Scholar]
- 21.Ido Y. Chang K. LeJeune W. Tilton RG. Monafo WW. Williamson JR. Diabetes impairs sciatic nerve hyperemia induced by surgical trauma: implications for diabetic neuropathy. Am J Physiol. 1997;273:E174–E184. doi: 10.1152/ajpendo.1997.273.1.E174. [DOI] [PubMed] [Google Scholar]
- 22.Ido Y. Chang K. Williamson JR. NADH augments blood flow in physiologically activated retina and visual cortex. Proc Natl Acad Sci U S A. 2004;101:653–658. doi: 10.1073/pnas.0307458100. [DOI] [PMC free article] [PubMed] [Google Scholar]
- 23.Ido Y. Chang K. Woolsey TA. Williamson JR. NADH: sensor of blood flow need in brain, muscle, and other tissues. FASEB J. 2001;15:1419–1421. doi: 10.1096/fj.00-0652fje. [DOI] [PubMed] [Google Scholar]
- 24.Kashiwagi A. Nishio Y. Asahina T. Ikebuchi M. Harada N. Tanaka Y. Takahara N. Taki H. Obata T. Hidaka H. Saeki Y. Kikkawa R. Pyruvate improves deleterious effects of high glucose on activation of pentose phosphate pathway and glutathione redox cycle in endothelial cells. Diabetes. 1997;46:2088–2095. doi: 10.2337/diab.46.12.2088. [DOI] [PubMed] [Google Scholar]
- 25.Kerr PM. Suleiman MS. Halestrap AP. Reversal of permeability transition during recovery of hearts from ischemia and its enhancement by pyruvate. Am J Physiol. 1999;276:H496–H502. doi: 10.1152/ajpheart.1999.276.2.H496. [DOI] [PubMed] [Google Scholar]
- 26.Leto G. Pricci F. Amadio L. Iacobini C. Cordone S. Diaz-Horta O. Romeo G. Barsotti P. Rotella CM. di Mario U. Pugliese G. Increased retinal endothelial cell monolayer permeability induced by the diabetic milieu: role of advanced non-enzymatic glycation and polyol pathway activation. Diabetes Metab Res Rev. 2001;17:448–458. doi: 10.1002/dmrr.227. [DOI] [PubMed] [Google Scholar]
- 27.Mintun MA. Vlassenko AG. Rundle MM. Raichle ME. Increased lactate/pyruvate ratio augments blood flow in physiologically activated human brain. Proc Natl Acad Sci U S A. 2004;101:659–664. doi: 10.1073/pnas.0307457100. [DOI] [PMC free article] [PubMed] [Google Scholar]
- 28.Mylari BL. Larson ER. Beyer TA. Zembrowski WJ. Aldinger CE. Dee MF. Siegel TW. Singleton DH. Novel, potent aldose reductase inhibitors: 3,4-dihydro-4-oxo-3-[[5-(trifluoromethyl)-2-benzothiazolyl] methyl]-1-phthalazineacetic acid (zopolrestat) and congeners. J Med Chem. 1991;34:108–122. doi: 10.1021/jm00105a018. [DOI] [PubMed] [Google Scholar]
- 29.Nishikawa T. Edelstein D. Du XL. Yamagishi S. Matsumura T. Kaneda Y. Yorek MA. Beebe D. Oates PJ. Hammes HP. Giardino I. Brownlee M. Normalizing mitochondrial superoxide production blocks three pathways of hyperglycaemic damage. Nature. 2000;404:787–790. doi: 10.1038/35008121. [DOI] [PubMed] [Google Scholar]
- 30.Nyengaard JR. Ido Y. Kilo C. Williamson JR. Interactions between hyperglycemia and hypoxia: implications for diabetic retinopathy. Diabetes. 2004;53:2931–2938. doi: 10.2337/diabetes.53.11.2931. [DOI] [PubMed] [Google Scholar]
- 31.Oates PJ. Polyol pathway and diabetic peripheral neuropathy. Int Rev Neurobiol. 2002;50:325–392. doi: 10.1016/s0074-7742(02)50082-9. [DOI] [PubMed] [Google Scholar]
- 32.Oates PJ. Aldose reductase, still a compelling target for diabetic neuropathy. Curr Drug Targets. 2008;9:14–36. doi: 10.2174/138945008783431781. [DOI] [PubMed] [Google Scholar]
- 33.Oates PJ. Schelhorn T. Miller M. Hammerlund E. Ellery C. Beebe D. Hakkinen J. Polyol pathway inhibitors dose-dependently preserve nerve function in diabetic rats. Diabetologia. 1998;41:A271. [Google Scholar]
- 34.Obrosova IG. Fathallah L. Lang HJ. Greene DA. Evaluation of a sorbitol dehydrogenase inhibitor on diabetic peripheral nerve metabolism: a prevention study. Diabetologia. 1999;42:1187–1194. doi: 10.1007/s001250051290. [DOI] [PubMed] [Google Scholar]
- 35.Obrosova IG. Marvel J. Faller AM. Willamson JR. Reductive stress is a very early metabolic imbalance in sciatic nerve in diabetic and galactose-fed rats. Diabetes. 1995;38(suppl 1):A8. [Google Scholar]
- 36.Obrosova IG. Stevens MJ. Lang HJ. Diabetes-induced changes in retinal NAD-redox status: pharmacological modulation and implications for pathogenesis of diabetic retinopathy. Pharmacology. 2001;62:172–180. doi: 10.1159/000056091. [DOI] [PubMed] [Google Scholar]
- 37.Obrosova IG. Van Huysen C. Fathallah L. Cao XC. Greene DA. Stevens MJ. An aldose reductase inhibitor reverses early diabetes-induced changes in peripheral nerve function, metabolism, and antioxidative defense. FASEB J. 2002;16:123–125. doi: 10.1096/fj.01-0603fje. [DOI] [PubMed] [Google Scholar]
- 38.Peterson MJ. Sarges R. Aldinger CE. MacDonald DP. CP-45,634: a novel aldose reductase inhibitor that inhibits polyol pathway activity in diabetic and galactosemic rats. Metabolism. 1979;28:456–461. doi: 10.1016/0026-0495(79)90056-8. [DOI] [PubMed] [Google Scholar]
- 39.Pugliese G. Tilton RG. Speedy A. Chang K. Province MA. Kilo C. Williamson JR. Vascular filtration function in galactose-fed versus diabetic rats: the role of polyol pathway activity. Metabolism. 1990;39:690–697. doi: 10.1016/0026-0495(90)90102-i. [DOI] [PubMed] [Google Scholar]
- 40.Pugliese G. Tilton RG. Speedy A. Santarelli E. Eades DM. Province MA. Kilo C. Sherman WR. Williamson JR. Modulation of hemodynamic and vascular filtration changes in diabetic rats by dietary myo-inositol. Diabetes. 1990;39:312–322. doi: 10.2337/diab.39.3.312. [DOI] [PubMed] [Google Scholar]
- 41.Salceda R. Vilchis C. Coffe V. Hernandez-Munoz R. Changes in the redox state in the retina and brain during the onset of diabetes in rats. Neurochem Res. 1998;23:893–897. doi: 10.1023/a:1022467230259. [DOI] [PubMed] [Google Scholar]
- 42.Salway JG. Metabolism at a glance. Cambridge, MA: Blackwell Science; 1994. pp. 34–35. [Google Scholar]
- 43.Scholz TD. Laughlin MR. Balaban RS. Kupriyanov VV. Heineman FW. Effect of substrate on mitochondrial NADH, cytosolic redox state, and phosphorylated compounds in isolated hearts. Am J Physiol. 1995;268:H82–H91. doi: 10.1152/ajpheart.1995.268.1.H82. [DOI] [PubMed] [Google Scholar]
- 44.Tilton RG. Baier LD. Harlow JE. Smith SR. Ostrow E. Williamson JR. Diabetes-induced glomerular dysfunction: links to a more reduced cytosolic ratio of NADH/NAD+ Kidney Int. 1992;41:778–788. doi: 10.1038/ki.1992.121. [DOI] [PubMed] [Google Scholar]
- 45.Tilton RG. Chang K. Nyengaard JR. Van den Enden M. Ido Y. Williamson JR. Inhibition of sorbitol dehydrogenase: effects on vascular and neural dysfunction in streptozocin-induced diabetic rats. Diabetes. 1995;44:234–242. doi: 10.2337/diab.44.2.234. [DOI] [PubMed] [Google Scholar]
- 46.Tilton RG. Kawamura T. Chang KC. Ido Y. Bjercke RJ. Stephan CC. Brock TA. Williamson JR. Vascular dysfunction induced by elevated glucose levels in rats is mediated by vascular endothelial growth factor. J Clin Invest. 1997;99:2192–2202. doi: 10.1172/JCI119392. [DOI] [PMC free article] [PubMed] [Google Scholar]
- 47.Toth E. Racz A. Toth J. Kaminski PM. Wolin MS. Bagi Z. Koller A. Contribution of polyol pathway to arteriolar dysfunction in hyperglycemia: role of oxidative stress, reduced NO, and enhanced PGH(2)/TXA(2) mediation. Am J Physiol Heart Circ Physiol. 2007;293:H3096–H3104. doi: 10.1152/ajpheart.01335.2006. [DOI] [PubMed] [Google Scholar]
- 48.Travis SF. Morrison AD. Clements RS., Jr Winegrad AI. Oski FA. Metabolic alterations in the human erythrocyte produced by increases in glucose concentration: the role of the polyol pathway. J Clin Invest. 1971;50:2104–2112. doi: 10.1172/JCI106704. [DOI] [PMC free article] [PubMed] [Google Scholar]
- 49.Turner JL. Bierman EL. Effects of glucose and sorbitol on proliferation of cultured human skin fibroblasts and arterial smooth-muscle cells. Diabetes. 1978;27:583–588. doi: 10.2337/diab.27.5.583. [DOI] [PubMed] [Google Scholar]
- 50.Van den Enden MK. Nyengaard JR. Ostrow E. Burgan JH. Williamson JR. Elevated glucose levels increase retinal glycolysis and sorbitol pathway metabolism: implications for diabetic retinopathy. Invest Ophthalmol Vis Sci. 1995;36:1675–1685. [PubMed] [Google Scholar]
- 51.Vlassenko AG. Rundle MM. Raichle ME. Mintun MA. Regulation of blood flow in activated human brain by cytosolic NADH/NAD+ ratio. Proc Natl Acad Sci U S A. 2006;103:1964–1969. doi: 10.1073/pnas.0510632103. [DOI] [PMC free article] [PubMed] [Google Scholar]
- 52.Whiteside CI. Cellular mechanisms and treatment of diabetes vascular complications converge on reactive oxygen species. Curr Hypertens Rep. 2005;7:148–154. doi: 10.1007/s11906-005-0090-4. [DOI] [PubMed] [Google Scholar]
- 53.Willamson JR.Chang K.Ostrow E.Allison W.Harlow J.Kilo C.Sorbitol-induced increases in vascular albumin clearance (VAC) are prevented by pyruvate but not myo-inositol Diabetes 38suppl 294A.1989. 2642864 [Google Scholar]
- 54.Williamson DH. Lund P. Krebs HA. The redox state of free nicotinamide-adenine dinucleotide in the cytoplasm and mitochondria of rat liver. Biochem J. 1967;103:514–527. doi: 10.1042/bj1030514. [DOI] [PMC free article] [PubMed] [Google Scholar]
- 55.Williamson JR. Chang K. Frangos M. Hasan KS. Ido Y. Kawamura T. Nyengaard JR. van den Enden M. Kilo C. Tilton RG. Hyperglycemic pseudohypoxia and diabetic complications. Diabetes. 1993;42:801–813. doi: 10.2337/diab.42.6.801. [DOI] [PubMed] [Google Scholar]
- 56.Winkler BS. Arnold MJ. Brassell MA. Sliter DR. Glucose dependence of glycolysis, hexose monophosphate shunt activity, energy status, and the polyol pathway in retinas isolated from normal (nondiabetic) rats. Invest Ophthalmol Vis Sci. 1997;38:62–71. [PubMed] [Google Scholar]
- 57.Wolf BA. Williamson JR. Easom RA. Chang K. Sherman WR. Turk J. Diacylglycerol accumulation and microvascular abnormalities induced by elevated glucose levels. J Clin Invest. 1991;87:31–38. doi: 10.1172/JCI114988. [DOI] [PMC free article] [PubMed] [Google Scholar]
- 58.Zhao W. Devamanoharan PS. Henein M. Ali AH. Varma SD. Diabetes-induced biochemical changes in rat lens: attenuation of cataractogenesis by pyruvate. Diabetes Obes Metab. 2000;2:165–174. doi: 10.1046/j.1463-1326.2000.00079.x. [DOI] [PubMed] [Google Scholar]
Associated Data
This section collects any data citations, data availability statements, or supplementary materials included in this article.