

Abstract
Purification and in vitro protein-folding schemes were developed to produce monodisperse samples of the mature wild-type HIV-2 protease (PR2), enabling a comprehensive set of biochemical and biophysical studies to assess the dissociation of the dimeric protease. An E37K substitution in PR2 significantly retards autoproteolytic cleavage during expression. Furthermore, it permits convenient measurement of the dimer dissociation of PR2E37K (elevated Kd ∼20 nM) by enzyme kinetics. Differential scanning calorimetry reveals a Tm of 60.5 for PR2 as compared with 65.7°C for HIV-1 protease (PR1). Consistent with weaker binding of the clinical inhibitor darunavir (DRV) to PR2, the Tm of PR2 increases by 14.8°C in the presence of DRV as compared with 22.4°C for PR1. Dimer interface mutations, such as a T26A substitution in the active site (PR2T26A) or a deletion of the C-terminal residues 96–99 (PR21–95), drastically increase the Kd (>105-fold). PR2T26A and PR21–95 consist predominantly of folded monomers, as determined by nuclear magnetic resonance (NMR) and size-exclusion chromatography coupled with multiangle light scattering and refractive index measurements (SMR), whereas wild-type PR2 and its active-site mutant PR2D25N are folded dimers. Addition of twofold excess active-site inhibitor promotes dimerization of PR2T26A but not of PR21–95, indicating that subunit interactions involving the C-terminal residues are crucial for dimer formation. Use of SMR and NMR with PR2 facilitates probing for potential inhibitors that restrict protein folding and/or dimerization and, thus, may provide insights for the future design of inhibitors to circumvent drug resistance.
Keywords: HIV/AIDS, retroviral protease, dimer dissociation, light scattering, NMR, enzyme kinetics
Introduction
Human immunodeficiency virus type 2 (HIV-2) is another retrovirus capable of causing AIDS. HIV-2 possesses a gene organization like that of HIV-1 and is expected to have a similar frame-shifting mechanism of expression and regulation of its gene products.1 The HIV-2 protease (PR2), encoded in the Pol domain of the Gag-Pol polyprotein, is flanked at the N terminus by the 82-amino acid transframe region (TFR) and at the C terminus by the reverse transcriptase (RT) (http://www.hiv.lanl.gov/content/sequence/HIV/COMPENDIUM/compendium.html). It is indispensable for virus maturation by processing the Gag and Gag-Pol into mature structural and functional proteins.2 PR2 is a dimeric aspartyl protease comprising two identical 99-amino acid monomers, each of which contributes one of the two conserved catalytically essential Asp25 residues.3–5 During virus maturation, it is cleaved from the Gag-Pol polyprotein by an autocatalytic process that is presumably analogous to the demonstrated autoprocessing of PR1.2
Sequence alignment of HIV-1 protease (PR1) (BH5 isolate, Swiss-Prot: P04587.3) with PR2 (ROD isolate, GenBank AAB23105, Fig. 1) indicates that 47 of the amino acids in the two enzymes are identical (red), and an additional 20 are conservative substitutions (light purple) (similarity relations given in http://helixweb.nih.gov/multi-align/). The greatest variability is seen in residues (gold) that are largely solvent exposed.6 The structures of PR1 and PR2 virtually overlay each other in the vicinity of the active site and dimer interface.5 Consistent with these analogies and not too surprisingly, heterodimeric tethered forms of PR1 and PR2 have been shown to be catalytically active.7,8
Figure 1.
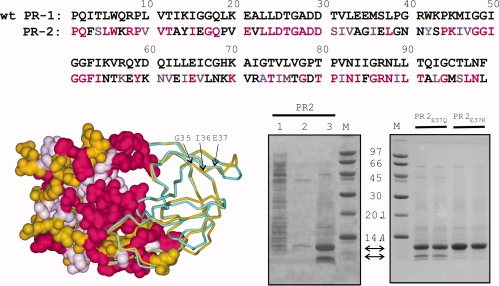
(Top) Sequence homology between wild-type PR1 (without stabilizing mutations) and PR2 (PDB code: 3EBZ) showing identical residues (magenta) and conservative substitutions (light purple). (Bottom left) Structural overlay of PR2 (gold) with autoproteolysis-resistant PR1 (PDB code: 2IEN, shown in cyan). Both crystal structures contain the inhibitor DRV (not shown) in the active site. The left half of the structure shows a surface representation of PR2 with identical residues and conservative substitutions relative to PR1-colored magenta and light purple, respectively. The major site of autoproteolysis, G35/I36, and residue E37 that was mutated to restrict autoproteolysis are indicated by arrows. (Bottom right) Expression of PR2 and its mutants in E. coli and analyses by SDS-PAGE. Lane 1, total soluble extract after initial lysis and centrifugal fractionation. The insoluble pellet obtained from the prior step was briefly sonicated in buffer containing 1M urea and 0.5% NP-40 (see “Materials and Methods” for complete composition) and the supernatant (lane 2) and insoluble (inclusion bodies, lane 3, and duplicate lanes of proteins derived from PR2E37Q and PR2E37K mutants) fractions derived after centrifugation are shown. Proteins were subjected to 20% homogeneous PhastGel electrophoresis followed by coomassie staining.
Existing HIV-2 studies have been largely limited to examining the differences in response of the two viruses and their essential enzymes to clinical inhibitors originally designed to target HIV-1.9-12 Both HIV-1 and -2 exhibit similar sensitivities to most nucleoside inhibitors of RT, whereas HIV-2 is highly resistant to most nonnucleoside inhibitors of HIV-1 RT. Significant differences also exist between their responses to clinical protease inhibitors (PIs) designed to target PR1. Ki values of PIs for PR2 are consistently higher by a factor of ∼2 to >80 than the corresponding Kis for PR1,11 yet to date no inhibitors specific for PR2 have been developed, and antiretroviral therapy of HIV-2 follows protocols similar to those employed for HIV-1. Although several second-generation PIs such as darunavir (DRV), tipranavir, and lopinavir exhibit subnanomolar Ki values for PR2, these values are still substantially larger than the corresponding Kis for PR1. Interestingly, several naturally occurring variants of PR2 contain amino acid substitutions characteristic of PI-resistant strains of HIV-1.13
When compared with crystal structures for PR1 and its mutants that are available in the hundreds, fewer than 20 crystal structures of PR2 exist in the protein data bank, and most are only at resolutions >2 Å. Of these, one earlier structure consists of a complex with a FDA-approved drug for HIV-1 (indinavir14), and only recently have crystal structures been published for PR2 in complex with DRV, a potent second-generation PI that is designed to be more effective against protease variants, and also with two related antivirals.5
With the ever growing threat that HIV-2 is slowly and persistently spreading from West Africa to other parts of the world,15,16 it becomes important to characterize the enzyme with respect to aspects that have not been understood. These include structural studies with active site-directed drugs designed specifically for PR2 as well as the newer generation of PIs designed to combat drug resistance in HIV-1 and biochemical and biophysical studies particularly addressing its inhibition by dimer dissociation. In spite of an extensive effort by various research groups, clinical inhibitors targeting the dimerization of PR1 are unavailable. Thus, to revive interest and research in areas that are not amenable to study in the PR1 system, we have now systematically developed a facile expression, purification, and in vitro folding scheme for PR2 to enable structural studies, and analyzed the protein by kinetic, biochemical, and biophysical methods. The catalytic activity, chemical denaturation, and differential scanning calorimetric (DSC) profiles for PR2 have been determined. Importantly, subjecting PR2 and its dimer interface mutants to SMR enabled determining the apparent molecular masses, a technique that was not applicable to PR1 due to its interaction with the column matrix. This protocol also enabled monitoring the monomer–dimer equilibrium of PR2 at increasing urea concentrations in the absence and presence of a clinical inhibitor and comparison with dissociation as monitored by kinetic enzyme assays. Finally, both the dimeric and folded monomeric forms of PR2 were characterized by solution NMR and compared with PR1. We suggest that PR2 may provide a useful tool to probe for dimerization inhibitors of retroviral proteases using SMR and NMR, as described in this study.
Results and Discussion
Purification scheme and physical properties of PR2
SDS-PAGE analysis of the induced total cell extract of E. coli bearing the plasmid for the expression of the 99-amino acid coding region of PR2 shows a weak band corresponding to the full-length protease product when compared with the uninduced cell extract. Analysis of the insoluble pellet obtained on a small scale after the initial lysis of cells and washing of the pellet in 1M urea and 0.5% Triton X-100 in buffer, as described in “Materials and Methods,” reveals that the expressed PR2 is enriched in this fraction as shown in Figure 1, lane 3 (top arrow between the gel panels). The protein is about 80% pure. The major contaminant is derived from self-degradation (autoproteolysis) of PR2 during expression, and corresponds to residues 36–99 of PR2 (lower arrow between the gel panels) as determined by mass spectrometry and N-terminal sequencing. Thus, the cleavage occurs between residues G35 and I36 of PR2 mapping to a region preceding the base of the flap or the elbow region (N40) in the 3-D structure (Fig. 1, bottom left, indicated by arrows). A minor fragment corresponding to the region 36–90 is also observed, resulting from a slower cleavage between residues 90 and 91. It appears that both fragments are almost completely insoluble under the conditions of their accumulation in E. coli. They are not present in the initial bacterial soluble lysate or in the subsequent wash steps. This is also evident from our subsequent observation that purified PR236–99 readily precipitates when dialyzed from the HPLC eluate (acetonitrile/TFA/water, 35/0.05/64.95) into 50 mM sodium acetate buffer, pH 5, 50 mM NaCl.
The scheme previously described17 for purification of PR1 from inclusion bodies using size-exclusion chromatography and reverse-phase HPLC under denaturing conditions, followed by protein folding using the dialysis or the quench protocol, is applicable for inactive PR2 constructs such as substitution mutants PR2D25N and PR2T26A and deletion mutant PR21–95. However, purification and folding of active PR2 constructs requires a slightly different scheme because of the intrinsic property of the enzyme to undergo autoproteolysis at low pH [∼3, see Fig. 2(A) and subsequent section]. Under the conditions of reverse-phase HPLC, when the buffer in which the protein is dissolved (4M GnHCl, 50 mM Tris, pH 8) is exchanged with the acidic column eluant on loading (95.95% v/v water and 0.05% TFA; pH 2.4), PR2 undergoes cleavage, presumably because it folds to an active enzyme and thus becomes subject to enhanced autoproteolysis. Thus, to limit cleavage and maximize the yield of folded, active full-length PR2, peak fractions following size-exclusion chromatography under denaturing conditions (see “Materials and Methods”) were pooled, adjusted to pH 5 and dialyzed against 50 mM sodium acetate buffer, pH 5, and 50 mM NaCl. Subsequently, the protein was refractionated in the same dialysis buffer to obtain intact, full-length protease. This same protocol is also suitable (although not required) for the inactive mutants PR2D25N, PR2T26A, and PR21–95. Alternatively, these mutant proteins can be dried after reverse-phase HPLC, dissolved in 4M GnHCl, 50 mM sodium acetate, pH 5, and folded by dialysis at this pH, as for catalytically active PR2. The full-length PR2 is stable under these conditions for use in kinetic and biophysical experiments requiring extended times of analysis.
Figure 2.
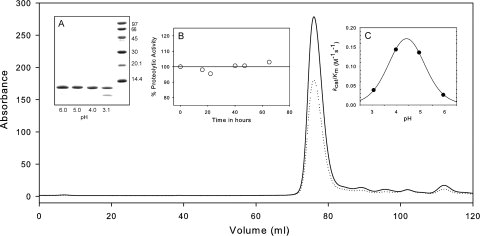
Size-exclusion chromatography and preliminary characterization of PR2. PR2 after purification and in vitro folding was applied to the preequilibrated column (Superdex-75, 1.6 × 60 cm) at a flow rate of 1.4 mL/min at room temperature. Traces of the absorbance monitored at 280 (solid) and 260 nm (dotted) are shown for the entire chromatogram. Insets: (A) Susceptibility of PR2 to autoproteolysis as a function of pH. PR2 (1.5 μg/μL) was incubated for 2 h at room temperature at the pH values indicated. Note that lane 4 (pH 3.1) shows significant autoproteolytic cleavage products. (B) Catalytic activity of PR2 monitored as a function of time maintained at room temperature in 20 mM sodium phosphate buffer at pH 6.0 and 50 mM sodium chloride. Aliquots were assayed at pH 5.0 (see “Materials and Methods”) at the time intervals indicated. (C) Dependence of kcat/Km on pH for PR2 determined at a protein concentration of 0.14 μM at 28°C. The line is a theoretical curve for pKa values of 3.8 and 5.0.
The overall yield of PR2 is significantly lower than achieved for the autoproteolysis-resistant PR1, apparently because of (1) poorer accumulation of the expressed PR2 in insoluble form, presumably in inclusion bodies and (2) autoproteolysis during expression. Approximately, 25% of the total expressed protein is in the soluble fraction after lysis of the cells, and about the same amount becomes soluble when the insoluble fraction is washed with 1M urea and 0.5% Triton X-100 to purify partially the trapped PR2 for subsequent column purification (Fig. 1). The solubility of PR2 has aided in its purification by pepstatin-A affinity chromatography directly from bacterial lysates after expression, as shown in earlier studies.18
Two substitution mutants, PR2E37Q and PR2E37K, were constructed, and analyses of their inclusion bodies by SDS-PAGE are shown in Fig. 1 (right gel panel) in duplicate lanes. Both mutations significantly retard the autoproteolysis at the G35/I36 site, with PR2E37K showing almost no products corresponding to the 36–99 or 36–90 fragments. PR2E37K was selected for larger-scale purification and subsequent characterization along with PR2. Because of the higher yield of purified enzyme, the E37K mutation may be helpful in obtaining the amounts of protein needed for production of crystals for structural studies with inhibitors. In addition, PR2E37K may have useful applications in studies of dimer dissociation, because in comparison with PR2, its dissociation is relatively easy to measure by activity assays, presumably because of a higher dimer dissociation constant, Kd (see subsequent section). However, poorer solubility at pH 6 of PR2E37K, when compared with PR2, makes PR2E37K undesirable for biochemical and biophysical studies at pH values approaching 6.
Autoproteolysis as described earlier is common to retroviral proteases and has been exhaustively studied in the case of PR1.19,20 Wild-type PR1 exhibits autoproteolysis at three distinct sites: one major cleavage between residues L5/W6 and two minor cleavages between residues L33/E34 and L63/I64. The major cleavage site of PR2, G35/I36, is in the same region as the minor L33/E34 site in PR1 and the major L40/P41 site in the 125-amino acid HTLV-1 protease.21 The three cleavages that we have consistently observed in our PR2 studies, G35/I36 and minor sites at L90/T91 and L23/L24, are among the six autoproteolytic cleavage sites documented.19 Overall, wild-type PR2 is consistently less prone to autoproteolytic degradation at pH 5 when compared with wild-type PR1 (cf. Fig. 2). By contrast, reliable kinetic and biochemical studies, or structural studies without an inhibitor, are not feasible with PR1 in the absence of stabilizing mutations such as Q7K, L33I, and L63I.20
In distinct contrast to PR1, which exhibits strong, nonspecific interactions with several column matrices under nondenaturing conditions (our observations), PR2 can be fractionated by size exclusion chromatography under optimal assay conditions (50 mM sodium acetate at pH 5 and 50 mM NaCl; cf. Fig. 2). This has made possible the use of this chromatographic method for the final purification step of folded PR2 constructs, as well as their molecular mass analysis by SMR as described.
Kinetic properties of PR2
The folded PR2 (17 μM) can be stably maintained at 4°C in 20 mM phosphate buffer at pH 6 and 50 mM NaCl, as demonstrated by the observation that the catalytic activity does not diminish up to 72 h [Fig. 2(B)]. Thus, the preferred condition for storing the folded PR2 is either at 4°C for shorter periods between experiments or frozen at −20°C for long-term storage. Significant autoproteolysis of PR2 at the G35/I36 site, as confirmed by electrospray mass spectrometry, occurs around pH 3 [Fig. 2(A)], indicating that this site is susceptible to cleavage possibly due to local unfolding and depends on the protonation of a group with a pKa below 4. However, accumulation of the protein leading to high concentrations during expression also leads to this cleavage as noted earlier. The kinetic parameters Km and kcat for PR2-catalyzed hydrolysis of substrate IV under the conditions described under “Materials and Methods” are 72.4 ± 8.7 μM and 6.4 ± 0.3 s−1, respectively. PR2E37K exhibits very similar Km and kcat values of 71.9 ± 9.3 μM and 5.6 ± 0.2 s−1, respectively, indicating that the E37K mutation does not significantly alter the catalytic properties of the enzyme. The kinetic parameters for both PR2 constructs at pH 5, 250 mM NaCl, are comparable in magnitude to the kcat of 2.9 s−1 and Km of 48 μM, previously determined for pseudo wild-type PR1 under the same conditions.22 Compensating differences in Km and kcat for the two enzymes result in values of kcat/Km of 88 and 60 mM−1 s−1 for PR2 and PR1, respectively, which differ by a factor of only 1.4. The pH dependence of kcat/Km for substrate IV hydrolysis catalyzed by PR2 in the presence of 250 mM NaCl indicates a requirement for two ionizable groups, with pKa values of 3.8 and 5.0 [Fig. 2(C)], presumably from the two catalytic Asp25 residues. These pKas are comparable to the values of 3.17 and 4.93 obtained for PR1-catalyzed hydrolysis of a similar substrate.23 In many cases, values of kcat/Km are also quite similar for PR1 and PR2 when determined for peptides that contain natural Gag or Gag-Pol cleavage sites.24,25 Thus, the similarity between PR1 and PR2 structures (cf. Fig. 1) also encompasses their catalytic properties.
Effect of inhibitor DRV on DSC thermograms of PR2
At pH 5 in the absence of inhibitor, PR2 shows a broad transition between 45 and 65°C without a well-defined maximum. SDS-PAGE of the samples before and after DSC revealed that a large proportion of the initially homogeneous protein had undergone autoproteolysis (see Fig. 3, inset) during the course of the DSC experiment. As shown in Figure 3 and similar to pH 5, PR2 also undergoes a highly asymmetric transition at pH 6 with a pronounced leading slope at temperatures ∼50–58°C before a peak at 60.5°C. Although PR2 is stable at room temperature under the pH conditions used, it is likely that it becomes susceptible to autoproteolysis with increasing temperature, possibly as a result of increased accessibility of cleavage sites. This peak maximum is lower than the Tm of 65.7°C previously observed for PR1 at pH 5.26
Figure 3.
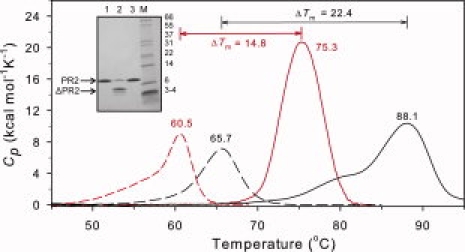
DSC thermograms for PR2 (red) in the absence (dashed lines) and presence (solid lines) of an approximately twofold molar excess of DRV in 20 mM sodium phosphate buffer, pH 6.0, 50 mM NaCl, compared with PR1 (black) in 50 mm sodium acetate, pH 4.8. Data for PR1 are from Ref. 26. For further experimental details, see text. The inset shows SDS-PAGE of PR2 before (lane 1) and after (lane 2) a DSC scan at pH 5.0, showing extensive autoproteolysis in the absence of inhibitor. As expected, a DSC scan of PR2 performed in the presence of an approximately twofold excess of DRV (lane 3) does not result in autoproteolytic degradation of the protein.
In the presence of excess DRV inhibitor, no autoproteolysis occurs (see inset, Fig. 3). However, similar to observations for PR1/DRV,26,27 the transition for the PR2/DRV complex was found to be irreversible and led to apparent aggregation of the protein. Thus, accurate thermodynamic parameters could not be obtained. The DRV complex of PR2 exhibits a single, symmetrical thermal transition (Fig. 3) with a Tm of 75.3°C. A virtually identical thermogram, both in Tm and magnitude, was obtained at pH 5. By contrast, the PR1/DRV complex shows a biphasic transition, which we previously suggested arose from two orientations of the inhibitor in the PR1 active site,26 as seen in the crystal structure. Consistent with this interpretation of the present single DSC transition, only one orientation of DRV is observed in the PR2/DRV crystal.5 The difference (ΔTm) between the observed Tm values for PR in the presence and absence of an inhibitor provides a qualitative estimate of the strength of inhibitor binding.26,27 By this criterion, binding of DRV to PR2 (ΔTm = 14.8°C) appears significantly weaker than for PR1 (ΔTm = 22.4°C) (Fig. 3). This observation is consistent with the ∼17-fold higher Ki value for DRV with PR2 relative to PR1.11
Thermograms for PR2E37K (not shown), run at pH 5 to avoid protein precipitation at pH 6, were similar in general appearance to those shown for PR2, exhibiting an asymmetrical transition with a maximum at 62.5°C for the free enzyme and a single, more symmetrical transition at 77.6°C (ΔTm = 15.1°C) in the presence of DRV, indicative of the similar behavior of these two proteins. The asymmetrical transition in the absence of DRV also presumably results from partial autoproteolysis. Thus, in spite of the significantly diminished autoproteolytic activity of PR2E37K during expression, the mutation does not restrict autoproteolysis under the conditions of DSC.
Denaturation and monomer–dimer equilibria
Plots of activity versus urea concentration for both PR2E37K and PR2 exhibit a 50% decrease in activity at ∼2M urea [Fig. 4(A)]. However, the curve for PR2 is shallow and lacks a well-defined inflection point, whereas that for PR2E37K is sigmoid with a distinct inflection at ∼1.8M [Fig. 4(A)]. The response of PR2E37K to GnHCl is also sigmoid and almost identical in its shape and midpoint (1M) to that of PR1. Thus, PR2E37K is well suited for use in studies of denaturation and of dimer dissociation, as discussed later.
Figure 4.
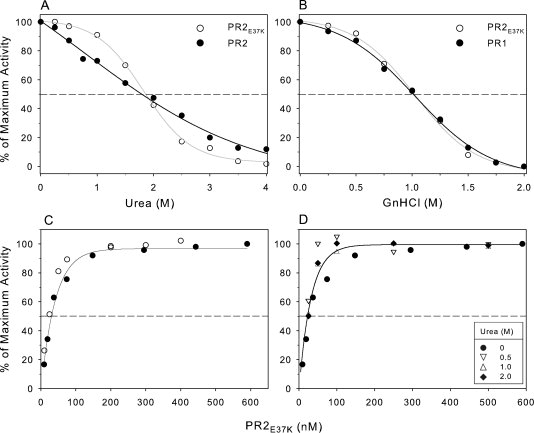
(A and B) Effect of urea and guanidine hydrochloride on catalytic activity. Catalytic activity was measured by monitoring the hydrolysis of substrate IV by 120 nM PR2 and 150 nM PR2E37K in 50 mM sodium acetate buffer, pH 5, at 28°C. For complete experimental details, see text. (A) Comparison of the catalytic activities of PR2E37K and PR2 as a function of increasing urea concentration. (B) Comparison of the catalytic activities of PR2E37K and PR1 as a function of increasing GnHCl concentration. (C) Effect of enzyme concentration on the activity of PR2E37K in 50 mM acetate buffer, pH 5, containing 250 mM NaCl, at 28°C, in the absence of urea. Solid and open circles are data from two separate experiments. (D) Lack of an effect of urea on the concentration dependence of PR2E37K activity: solid circles, no urea [data from (C)]; inverse triangles, 0.5M urea; triangles, 1.0M urea; solid diamonds, 2M urea. Note that each data set was normalized to a maximum activity of 100%. The lower urea concentrations had little effect on the maximum activity, but in the presence of 2M urea, the observed maximum activity was ∼60% of that in the absence of urea.
The Kd for dimer dissociation of wild-type PR2 could not be measured reproducibly, because a decrease in the catalytic activity was not reliably detectable at the lowest enzyme concentrations assayed (5–10 nM) due to the sensitivity limitation of the assay. This observation suggests that Kd for PR2 may be in the same range (<10 nM28,29) as that estimated for PR1. However, the Kd for PR2E37K could be determined with relative ease. A plot of the catalytic activity as a function of enzyme concentration [Fig. 4(C)] indicates a dimer dissociation constant (Kd) of ∼20 nM for PR2E37K. Because of its reproducibility in showing dissociation, PR2E37K was used to assess the influence on Kd at final urea concentrations of 0.5, 1, and 2M [Fig. 4(D)]. At the maximum concentration examined (2M urea), only 60% of the maximal activity (0M urea) was observed, but PR2E37K still exhibited roughly the same Kd as in the absence of urea. This decreased activity is also consistent with the midpoint of the rate transition observed at ∼1.8M urea [Fig. 4(A)]. We ascribe this diminished activity to an approximately fourfold increase in Km for substrate IV to 295 μM (with little or no accompanying change in kcat) measured in 2M urea. At the substrate concentration of 330 μM used in the experiments to determine Kd, the enzyme is calculated to be only 53% saturated with substrate at 2M urea when compared with 82% in the absence of urea (Km = 72 μM). Urea is known to increase the solubility of hydrophobic groups in water30 and may mitigate the driving force for substrate binding to the hydrophobic active site of the protease at a concentration that is insufficient to cause dissociation of the PR2E37K dimer.
Mass analysis of wild-type PR2 and its interface mutants by light scattering measurements
SMR provides a convenient, fast, and powerful method for the determination of protein interaction and self-association, since it is nondenaturing and affords both separation by size and quantitative mass data for protein multimers in a single experiment. However, PR1 and its mutant constructs have not been readily amenable to date to this approach because of strong, nonspecific binding of PR1 to several column matrices. Only recently, an approach has been described to fractionate PR1 under very dilute (submicromolar) concentrations (in the presence of bovine serum albumin) on a Phenomenex BioSep SEC3000 column.31 By contrast, PR2 has excellent chromatographic characteristics under nondenaturing conditions on Superdex-75, permitting use of SMR to assess the effect of urea and interface mutations, either in the absence or presence of an active site inhibitor, on dimerization/dissociation.
Results of the mass analysis by SMR at varying urea concentrations are summarized in the first three rows of Table I and Figure 5(A) and complement the use of enzyme assays, which provide only an indirect measurement of monomer versus dimer distribution. At the protein concentration of ∼6 μM estimated in the chromatographic eluate, PR2 exists exclusively as dimers both in the absence and presence of 2M urea, consistent with the low Kd (presumably <20 nM for PR2) and the lack of an effect of 2M urea on the Kd of PR2E37K [Fig. 4(D)]. At 4M urea in the absence of DRV, a significant fraction of PR2 is clearly monomeric, as indicated by the apparent mass of 14,670 ± 205, which represents an equilibrium between the monomer and dimer species. In the presence of DRV, the mass is similar to that expected for a dimer, representing the ternary dimer-DRV complex.
Table I.
Summary of SMR Data of HIV-2 Proteases
| Molecular masses estimated by SMRa (g/mol) |
|||||
|---|---|---|---|---|---|
| Construct | Inhibitor DRVb | Mexperimental | Mcalcc(monomer) | Mexperimental/Mcalc(monomer) | Major species |
| PR2 | − | 22,400 ± 336 | 10,719 | 2.09 ± 0.03 | Dimer |
| + | 19,555 ± 156 | 1.82 ± 0.02 | Ternary complex | ||
| PR2-2M | − | 21,790 ± 501 | 2.03 ± 0.05 | Dimer | |
| + | 20,590 ± 165 | 1.92 ± 0.02 | Ternary complex | ||
| PR2-4M | − | 14,670 ± 205 | 1.37 ± 0.02 | Dimer + monomer | |
| + | 19,170 ± 326 | 1.79 ± 0.03 | Ternary complex | ||
| PR2D25N | − | 21,900 ± 635 | 10844 | 2.02 ± 0.06 | Dimer |
| + | 24,620 ± 591 | 2.27 ± 0.06 | Ternary complex | ||
| PR2T26A | − | 11,170 ± 179 | 11293 | 0.99 ± 0.02 | Monomer |
| + | 11,150 ± 133 | 0.99 ± 0.01 | Monomer | ||
| PR21–95 | − | 10,570 ± 180 | 10292 | 1.03 ± 0.02 | Monomer |
| + | 10,510 ± 315 | 1.02 ± 0.03 | Monomer | ||
Proteins were fractionated on a Superdex-75 column at room temperature equilibrated in 50 mM sodium acetate, pH 5, 50 mM NaCl. The notations 2M and 4M indicate the presence of 2 and 4M urea, respectively, in the sample and column eluant.
Proteins either in the absence or added to 1.1-fold excess of inhibitor darunavir (DRV).
Mcalc indicates the monomer mass of unlabeled PR2, 13C 15N-labeled PR2T26A, and 15N-labeled PR2D25N and PR21–95 proteins.
Figure 5.
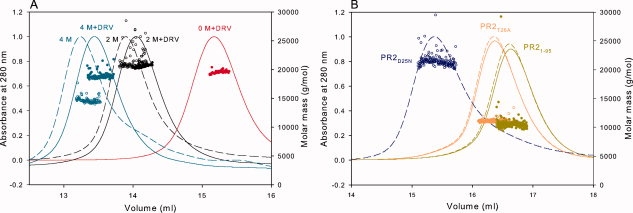
Analytical size-exclusion chromatography with inline multiangle light scattering and refractive index measurements (SMR) of PR2 and its mutants in 50 mM sodium acetate, pH 5, 50 mM NaCl. Proteins were folded as described in “Materials and Methods.” Based on the width at half peak height, the concentrations of proteins sampled for light scattering, refractive index, and UV measurements are expected to be roughly 6 μM. Molecular masses (circles) were calculated using the Astra software provided by Wyatt Technology Inc. (A) The final concentrations of urea in the sample and column buffer are 0M (red), 2M (black), and 4M (cyan). Dashed lines are in the absence of inhibitor; continuous lines are in the presence of a 1.1-fold excess of DRV added to the sample prior to chromatography. (B) Fractionation profiles and molecular mass values of PR2D25N (blue), PR2T26A (orange), and PR21-95 (dark yellow). PR2T26A and PR21-95 fractionated after the addition of 1.1-fold excess DRV, shown in continuous lines, exhibit monomer masses (see Table I) similar to proteins fractionated without DRV (dashed lines). Molar masses are shown as open and closed circles for the samples in the absence and presence of DRV, respectively. Several features of the chromatograms are worth noting: (1) In the absence of urea, dimeric PR2 and PR2D25N both elute in a retention volume slightly greater than 15 mL, whereas monomeric PR2T26A and PR21-95 elute significantly later as expected. Interestingly, the deletion mutant PR21-95, with only a ∼4% lower monomer mass, elutes slightly later than PR2T26A. (2) Urea in the column eluant causes the dimers to be less strongly retained and shifts the elution to significantly smaller volumes, possibly by altering interactions of the protein with the column matrix. (3) Binding of the inhibitor DRV in the presence (A) or absence of urea shifts the elution to slightly greater volumes relative to the unliganded protein but has no effect on the elution of monomers PR2T26A and PR21-95, with which it presumably does not interact.
Observed masses under native conditions of three PR2 mutant constructs in which Kd is significantly increased relative to the wild type are shown in rows 4–6 of Table I and Figure 5(B). The mutant PR2D25N in which the catalytic Asp has been replaced, a substitution mutant of the active-site interface (PR2T26A), and a deletion mutant of the C-terminal β-sheet interface (PR21–95), were analyzed by both SMR (Fig. 5B) and solution NMR (Fig. 6; see the following section). PR2D25N gives a dimer mass even in the absence of inhibitor, with an apparent Kd that must be considerably less than 6 μM. Previous NMR studies had shown that Kd for PR1D25N is 1.3 μM.26,29,32 By contrast, PR2 mutants bearing the T26A substitution or a deletion of residues 96–99 are monomeric (Fig. 5B), similar to the corresponding PR1 mutants that also exist as monomers at this concentration (Kd >1 mM29,33,34). Under the same conditions but in the presence of a 1.1-fold excess of DRV, PR2T26A and PR21-95 also exhibit monomer masses [Fig. 5(B)]. These light-scattering results are clearly corroborated by analysis of the 1H-15N HSQC spectra for these mutants, as described in the following section.
Figure 6.
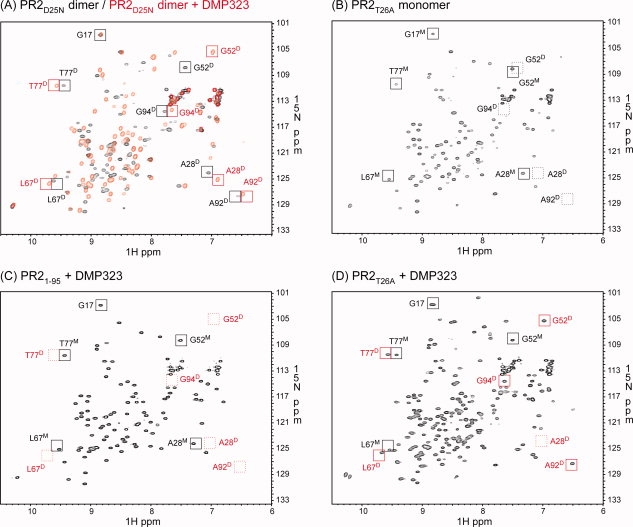
1H-15N HSQC spectra acquired for (A) PR2D25N in the absence (black) and presence (red) of DMP323, (B) PR2T26A, (C) PR21-95 in the presence of DMP323 and (D) PR2T26A in the presence of DMP323. Proteins were folded as described in “Materials and Methods” in 50 mM sodium acetate buffer, pH 5, containing 50 mM NaCl, with final concentrations of 150–200 μM dimer (A) and 82–110 μM monomer (B-D). Tentative signal assignments are shown for spectra in panels (A) and (B) and compared with (C) and (D). The spectrum of PR21-95 in the absence of DMP323 is not shown, because it was identical to that in the presence of DMP323. Black and red squares indicate positions of signals in the absence and presence of DMP323, respectively. Dashed squares indicate positions of characteristic peaks that are not observed. Superscripted D and M beside the residue number denote dimer- and monomer-specific signals, respectively.
Characterization of dimer and monomer folds of PR2
For catalytically inactive mutants of PR1, 1H-15N HSQC spectra provide the most convenient and reliable method for determining the position of the monomer–dimer equilibrium and have been extensively employed for this purpose.29 Such studies have been crucial for characterizing the monomer–dimer distributions for PR1 constructs because of their unsuitability for mass analysis by SMR. The concentration range of HSQC experiments (roughly 14–200 μM as dimer) is complementary to the lower concentrations appropriate for SMR and permits studies of dimer–monomer equilibria in this range. Furthermore, folded monomers can be identified by their characteristic signals, thus permitting a distinction between folded and unfolded monomers. In the present study, we have identified and tentatively assigned a number of peaks for PR2 constructs that undergo diagnostic shifts in position, depending on whether the protein is a folded monomer, a dimer, or a dimer with bound inhibitor (Fig. 6), analogous to previous assignments for PR1.34
PR2 proteins display stable, dispersed spectra characteristic of folded proteins with no loss in signal intensities over time. For example, a sample of PR2D25N can produce a reproducible spectrum over months. The 1H-15N HSQC spectrum of PR2D25N recorded at 150–200 μM concentration exhibits a single set of well-separated peaks [Fig. 6(A)] characteristic of a dimer. At a lower protein concentration (corresponding to 25 μM dimer) than that used in Figure 6(A), the 1H-15N HSQC spectrum of PR2D25N shows small peaks that correspond to a fraction present as monomer (data not shown), consistent with a Kd of 0.3 (±0.15) μM estimated from the peak volumes of the dimer and monomer signals. This observation is consistent with the similar effect of the D25N mutation on PR1, which increases Kd by more than two orders of magnitude relative to wild type.26
As previously noted,29 the binding of inhibitors at the active site shifts the monomer–dimer equilibrium in favor of the dimer with bound inhibitor as a ternary complex. To assess the effects of inhibitor binding, a symmetrical inhibitor, DMP323, was used to avoid more-complex spectra and overlapping signals resulting from asymmetry of the protein induced by binding of unsymmetrical inhibitors such as DRV. In the presence of DMP323, several characteristic peaks of PR2D25N show shifts. For example, the chemical shift of residue G52 at the tip of the flap significantly shifts upon DMP323 addition [Fig. 6(A)], whereas signals of residues at the dimer interface, such as G94 and A92, do not exhibit major changes. These results indicate that DMP323 binds to the active site of the PR2 without drastic changes in the protease core signals. Some of the high-field signals previously identified in the spectrum of PR1D25N (for example G52 and A9222) are observed in similar positions in the present PR2D25N spectrum.
PR2T26A was expected to have a much larger dimer dissociation constant than PR2D25N on the basis of the present SMR data as well as the effect of this mutation on PR1T26A, whose Kd in the absence of inhibitors is too large to be measured by NMR. In the absence of DMP323, PR2T26A [Fig. 6(B)] exhibits some peaks (such as G17, L67, and T77) in positions similar to those of PR2D25N. However, even at 400 μM monomer, peaks characteristic of the dimer, such as those characteristic of the dimer interface (A28, G94, and A92), were not detected in the PR2T26A spectrum in the absence of an inhibitor. Based on the protein concentration and signal-to-noise ratio of the spectrum, Kd for PR2T26A was estimated to be >8 mM. In the presence of DMP323, the PR2T26A spectrum exhibits two sets of signals [Fig. 6(D)]. Based on the similarity of the peak positions in the spectra of Figure 6(A) and (B), one set of signals corresponds to the monomer and the other set of signals to the DMP323-bound dimer. The concurrent observation of distinct monomer peaks indicates that even in the presence of a twofold excess of DMP323, this equilibrium is not fully shifted to the DMP-bound dimer and is slow relative to the NMR time scale. The fraction of free dimer is expected to be negligible. Based on the peak volumes of the signals of the dimer and monomer, an apparent dissociation constant, which corresponds to KLKd/[DMP], was estimated to be 73 (±4) μM, where Kd is the dissociation constant for the free dimer, KL is the ligand dissociation constant of DMP, and [DMP] is the concentration of DMP323 present in excess of that bound to the dimer.
The 1H-15N HSQC spectrum of PR21–95 in the presence of DMP323 [Fig. 6(C)] is identical to that in the absence of this inhibitor. The PR21–95 spectrum does not show characteristic peaks for G52, A28, and A92 of the DMP323-bound dimer and is very similar to the PR2T26A spectrum recorded in the absence of DMP323. These results clearly indicate that PR21-95 is a folded monomer under the present conditions, as a result of a larger intrinsic Kd and/or much weaker dimer stabilization by DMP323 binding (larger KL) relative to PR2T26A. Similarly, dimer formation in the presence of DMP323 was not observed for PR15-95,34 whereas partial dimerization was observed for PR1T26A.33 Thus, the active-site mutation D25N and interface mutations, T26A and deletion of residues 96–99, affect the dimerization of both proteins similarly. These analyses also indicate that interface contacts between the C-terminal strands are indispensable for dimer formation and cannot be compensated by the addition of the inhibitor DMP323, as in the case of PR2T26A, which forms dimer-DMP323 complexes at a concentration of ∼106 μM monomer in the presence of twofold excess DMP323.
Concluding remarks
In addition to being essential to the maturation and life cycle of HIV-2, a second pathogen that is likely to be of increasing concern as a cause of AIDS, PR2 is remarkable for its striking similarities to its counterpart, PR1, of the more-common HIV-1. The most striking differences between the two enzymes are in solubility, physical interactions with chromatographic media, and stability toward autoproteolysis under different conditions. These characteristics of PR2 can potentially be exploited where the use of PR1 has not been feasible, for example, in studies with native enzyme requiring extended times or for facile determination of the effect of inhibitors on monomer–dimer equilibria by SMR mass analysis. To date, identification of possible inhibitors of HIV protease dimerization has been hampered by lack of physical techniques to identify conclusively the monomeric and dimeric species. In the case of PR2, the SMR technique together with NMR has shown that strongly binding active-site inhibitors promote dimerization of otherwise folded monomeric species and co-chromatograph with the dimeric protease. Conversely, this method may provide a convenient approach for the screening of potential dimerization inhibitors that ideally shift the equilibrium by binding tightly to the monomer, thereby permitting its detection.
Materials and Methods
Cloning and site-directed mutagenesis of PR2
The mature wild-type PR2 (accession number AAB23105) gene was synthesized and expressed using the pET11a vector and E. coli BL21. Substitution mutations D25N, E37K, E37Q, and T26A and deletion of residues 96–99 to encode PR21–95 were performed using the appropriate primers on the PR2 template DNA and the Quik-change site-directed mutagenesis protocol (Stratagene, Carlsbad, CA). The genes were sequenced, and expressed proteins were also verified by mass spectrometry after partial purification from a 10-mL culture prior to conducting large-scale growth and purification.
Expression, purification, and protein folding
PR2 was expressed and purified by a similar procedure as described for PR1,17,35 with some modifications. Cells were grown in Luria-Bertani medium, and expression was induced at 0.7 OD600nm with a final concentration of 1 mM isopropyl β-d-1-thiogalactopyranoside (IPTG) for a period of 3–4 h. Cells derived from 1 L of culture were suspended in 80 mL of buffer A [50 mM Tris HCl, pH 8, 10 mM ethylenediaminetetraacetic acid (EDTA) and 10 mM dithiothreitol (DTT)], followed by the addition of lysozyme (100 μg/mL) and sonicated at 4°C. The insoluble recombinant protein was washed by resuspension in 70 mL of buffer containing 50 mM Tris-HCl, pH 8, 10 mM EDTA, 10 mM DTT, 1M urea, and 0.5% Triton X-100 and subsequently in buffer A. In all cases, the insoluble fraction was pelleted by centrifugation at 20,000g for 30 min at 4°C. The final pellet was solubilized in 50 mM Tris-HCl, pH 8.0, 7.5M GnHCl, 5 mM EDTA, 10 mM DTT to yield a concentration of ∼20 mg/mL. A maximum of 30 mg of protein was applied on a Superdex-75 column (HiLoad 2.6 cm × 60 cm, GE HealthCare, Piscataway, NJ) equilibrated in 50 mM Tris-HCl, pH 8, 4M GnHCl, 5 mM EDTA, 1 mM DTT, and at a flow rate of 3 mL/min at ambient temperature. Peak fractions were pooled and adjusted to pH 5. Approximately 4 mg of protein at 0.2–0.3 mg/mL in column buffer was dialyzed against 1 L of 20 mM sodium phosphate buffer, pH 6, or 50 mM sodium acetate, pH 5, each containing 50 mM NaCl for 4–5 h at room temperature and then overnight with fresh buffer. The sample was concentrated using a Centriprep YM-10 device (Millipore Corp, Bedford, MA) and loaded onto a Superdex-75 column (1.6 cm × 60 cm) equilibrated in the same buffer at a flow rate of 1.4 mL/min at room temperature. Peak fractions were analyzed by SDS-PAGE, combined and concentrated to ∼0.5 mg/mL and stored in aliquots at −20°C. Unless stated otherwise, protein concentrations are given for a dimer.
PR2D25N, PR2T26A, and PR21-95 were folded differently from PR2. After fractionation of the protein under denaturing conditions on the Superdex-75 column, as described in the preceding paragraph, peak fractions were combined and subjected to reverse-phase HPLC on POROS 20 R2 resin (PerSeptive Biosystems, Framington, MA) and eluted using a linear gradient from 99.95% water (v/v) and 0.05% TFA to 60% acetonitrile (v/v), 0.05% TFA (v/v), and 39.95% water (v/v) over a period of 16 min at a flow rate of 4 mL/min. An aliquot of the protein was lyophilized, dissolved in 4M GnHCl, 50 mM sodium acetate buffer, pH 5, to a final concentration of 0.2–0.3 mg/mL, dialyzed to remove GnHCl, and concentrated and purified by size-exclusion chromatography as described for wild-type PR2. Peak fractions were pooled and concentrated to ∼1 mg/mL and stored at 4°C.
Enzyme assays
Initial rates of enzymatic hydrolysis of the chromogenic peptide substrate IV [Lys-Ala-Arg-Val-Nle-(4-nitrophenylalanine)-Glu-Ala-Nle-NH2, California Peptide Research, Napa, CA]36 were routinely measured at 310 nm in 50 mM sodium acetate buffer, pH 5.0, containing 250 mM sodium chloride, at 28°C. Reactions were initiated either by addition of the enzyme to buffer solutions already containing the substrate or by addition of substrate immediately (<2 min) after the enzyme. Observed rates of absorbance change were converted to M−1 s−1 by use of Δɛ310 1797 for hydrolysis of the substrate. Substrate concentrations were determined from the UV spectrum of the substrate stock solutions (ɛ280 12,000 M−1 cm−1). For determination of pH dependence, 50 mM sodium formate, sodium acetate, and 20 mM sodium phosphate buffers at the desired pH and containing 250 mM sodium chloride were used.
Sample stability
To determine sample stability with respect to autoproteolysis as a function of pH, PR2 (3 mg/mL) in 20 mM sodium phosphate, pH 6, and 50 mM NaCl was mixed with an equal volume of either 100 mM sodium formate or sodium acetate buffers to give a series of solutions whose final pH values varied from 3.1 to 6.0. After 2 h at room temperature, each 4-μL mixture was added to 1.7 μL of SDS-PAGE sample buffer and subjected to electrophoresis on a 20% homogeneous PhastGel (GE HealthCare).
Differential scanning calorimetry
Solutions for DSC were prepared by overnight dialysis of the enzyme solutions against the appropriate degassed buffers (20 mM sodium phosphate, pH 6.0, 50 mM NaCl, or 50 mM sodium acetate, pH 5.0, 40 mM NaCl). For experiments in the presence of DRV, the inhibitor solution (160 or 220 μM in sodium phosphate or acetate buffer of the appropriate pH) was added to give a final concentration approximately twice that of the protease. PR2 concentrations were 17.2 and 14.6 μM in the absence and presence of DRV (31.5 μM), respectively. Even though the initial scan of PR2 in the presence of DRV at pH 6 showed a symmetrical transition, a reproducible rescan was not possible, indicating denaturation and possible aggregation of the protein. DSC data collection and analysis were as previously described.26,27
Molecular mass analysis
Molecular masses were analyzed by analytical SEC with inline multiangle light scattering (DAWN EOS, Wyatt Technology Inc., Santa Barbara, CA), refractive index (OPTILAB DSP, Wyatt Technology Inc.), and UV (Waters 2487, Waters Corporation, Milford, MA) detectors. One hundred micrograms of purified protein in a constant injection volume of 170 μL in 50 mM sodium acetate, pH 5, and 50 mM NaCl was applied to the preequilibrated column (Superdex-75, 1.0 × 30 cm) at a flow rate of 0.5 mL/min at room temperature and eluted in the same buffer. For chromatograms containing the inhibitor or urea, samples were premixed with 1.1-fold excess of DRV and the appropriate concentration of urea prior to the injection. The column was equilibrated with the buffer containing the same concentration of urea for fractionating samples that contained urea. Molecular masses were calculated using the Astra software provided with the instrument.
NMR
All 1H-15N-correlation spectra were recorded in 50 mM sodium acetate buffer with 50 mM NaCl at pH 5 in 95% H2O/5% D2O and a sample volume of ∼330 μL in a 5 mm Shigemi tube (Shigemi, Inc., Allison Park, PA). Backbone chemical shifts were assigned for PR2D25N using HNCA, CBCACONH, and 15N/13C-edited NOESY experiments and for PR2T26A using HNCA and CBCACONH, both at 150–200 μM protein concentration.37,38 All spectra were acquired on an Avance 600 spectrometer with a cryogenic probe (Bruker Instruments, Billerica, MA) at 20°C. Data were processed and analyzed using the nmrPipe, nmrDraw, and nmrView software.39,40 Approximately 80% and 50% of the signals were tentatively assigned for PR2D25N and PR2T26A, respectively. Dimer dissociation constants were calculated based on the peak volumes of dimer and monomer signals observed in the HSQC spectra for PR2D25N (50 μM as monomer) and PR2T26A (106 μM as monomer) in the presence of a twofold molar excess of the inhibitor DMP323.41
Acknowledgments
This work was authored, in whole or in part, by National Institutes of Health staff. We are grateful to Jinfa Ying for recording a preliminary HSQC spectrum of PR2D25N, Ad Bax for discussions and reading the manuscript, and Brian Martin for N-terminal sequencing. DRV was obtained through the NIH AIDS Research and Reference Reagent Program, Division of AIDS, NIAID, NIH and DMP323 from DuPont Pharmaceuticals.
Glossary
Abbreviations:
- DRV
darunavir
- DSC
differential scanning calorimetry
- FDA
United States Food and Drug Administration
- GnHCl
guanidine hydrochloride
- HIV-1
human immunodeficiency virus type 1
- HIV-2
human immunodeficiency virus type 2
- PIs
clinical inhibitors of HIV-1 protease
- PR1
mature HIV-1 protease
- PR2
mature HIV-2 protease
- HPLC
high pressure liquid chromatography
- HSQC
heteronuclear single quantum coherence
- SEC
size exclusion chromatography
- SMR
size exclusion chromatography coupled with multiangle light scattering and refractive index measurements
- SDS-PAGE
sodium dodecyl sulfate-polyacrylamide gel electrophoresis
- substrate IV
Lys-Ala-Arg-Val-Nle-(4-nitrophenylalanine)-Glu-Ala-Nle-NH2
- TFA
trifluoroacetic acid.
References
- 1.Hatfield DL, Levin JG, Rein A, Oroszlan S. Translational suppression in retroviral gene expression. Adv Virus Res. 1992;41:193–239. doi: 10.1016/S0065-3527(08)60037-8. [DOI] [PMC free article] [PubMed] [Google Scholar]
- 2.Louis JM, Weber IT, Tozser J, Clore GM, Gronenborn AM. HIV-1 protease: maturation, enzyme specificity, and drug resistance. Adv Pharmacol. 2000;49:111–146. doi: 10.1016/s1054-3589(00)49025-3. [DOI] [PubMed] [Google Scholar]
- 3.Copeland TD, Oroszlan S. Genetic locus, primary structure, and chemical synthesis of human immunodeficiency virus protease. Gene Anal Tech. 1988;5:109–115. doi: 10.1016/0735-0651(88)90010-6. [DOI] [PubMed] [Google Scholar]
- 4.Tong L, Pav S, Mui S, Lamarre D, Yoakim C, Beaulieu P, Anderson PC. Crystal structures of HIV-2 protease in complex with inhibitors containing the hydroxyethylamine dipeptide isostere. Structure. 1995;3:33–40. doi: 10.1016/s0969-2126(01)00133-2. [DOI] [PubMed] [Google Scholar]
- 5.Kovalevsky AY, Louis JM, Aniana A, Ghosh AK, Weber IT. Structural evidence for effectiveness of darunavir and two related antiviral inhibitors against HIV-2 protease. J Mol Biol. 2008;384:178–192. doi: 10.1016/j.jmb.2008.09.031. [DOI] [PMC free article] [PubMed] [Google Scholar]
- 6.Gustchina A, Weber IT. Comparative analysis of the sequences and structures of HIV-1 and HIV-2 proteases. Proteins. 1991;10:325–339. doi: 10.1002/prot.340100406. [DOI] [PubMed] [Google Scholar]
- 7.Patterson CE, Seetharam R, Kettner CA, Cheng YS. Human immunodeficiency virus type 1 and type 2 protease monomers are functionally interchangeable in the dimeric enzymes. J Virol. 1992;66:1228–1231. doi: 10.1128/jvi.66.2.1228-1231.1992. [DOI] [PMC free article] [PubMed] [Google Scholar]
- 8.Bagossi P, Cheng YS, Oroszlan S, Tozser J. Comparison of the specificity of homo- and heterodimeric linked HIV-1 and HIV-2 proteinase dimers. Protein Eng. 1998;11:439–445. doi: 10.1093/protein/11.6.439. [DOI] [PubMed] [Google Scholar]
- 9.Witvrouw M, Pannecouque C, Switzer WM, Folks TM, De CE, Heneine W. Susceptibility of HIV-2, SIV and SHIV to various anti-HIV-1 compounds: implications for treatment and postexposure prophylaxis. Antivir Ther. 2004;9:57–65. [PubMed] [Google Scholar]
- 10.Sluis-Cremer N, Tachedjian G. Mechanisms of inhibition of HIV replication by non-nucleoside reverse transcriptase inhibitors. Virus Res. 2008;134:147–156. doi: 10.1016/j.virusres.2008.01.002. [DOI] [PMC free article] [PubMed] [Google Scholar]
- 11.Brower ET, Bacha UM, Kawasaki Y, Freire E. Inhibition of HIV-2 protease by HIV-1 protease inhibitors in clinical use. Chem Biol Drug Des. 2008;71:298–305. doi: 10.1111/j.1747-0285.2008.00647.x. [DOI] [PubMed] [Google Scholar]
- 12.Menendez-Arias L, Tozser J. HIV-1 protease inhibitors: effects on HIV-2 replication and resistance. Trends Pharmacol Sci. 2008;29:42–49. doi: 10.1016/j.tips.2007.10.013. [DOI] [PubMed] [Google Scholar]
- 13.Pieniazek D, Rayfield M, Hu DJ, Nkengasong JN, Soriano V, Heneine W, Zeh C, Agwale SM, Wambebe C, Odama L, Wiktor SZ. HIV-2 protease sequences of subtypes A and B harbor multiple mutations associated with protease inhibitor resistance in HIV-1. AIDS. 2004;18:495–502. doi: 10.1097/00002030-200402200-00016. [DOI] [PubMed] [Google Scholar]
- 14.Chen Z, Li Y, Chen E, Hall DL, Darke PL, Culberson C, Shafer JA, Kuo LC. Crystal structure at 1.9-A resolution of human immunodeficiency virus (HIV) II protease complexed with L-735,524, an orally bioavailable inhibitor of the HIV proteases. J Biol Chem. 1994;269:26344–26348. [PubMed] [Google Scholar]
- 15.de Silva TI, Cotten M, Rowland-Jones SL. HIV-2: the forgotten AIDS virus. Trends Microbiol. 2008;16:588–595. doi: 10.1016/j.tim.2008.09.003. [DOI] [PubMed] [Google Scholar]
- 16.Gurjar RS, Ravi V, Desai A. Molecular epidemiology of HIV type 2 infections in South India. AIDS Res Hum Retroviruses. 2009;25:363–72. doi: 10.1089/aid.2008.0259. [DOI] [PubMed] [Google Scholar]
- 17.Ishima R, Torchia DA, Louis JM. Mutational and structural studies aimed at characterizing the monomer of HIV-1 protease and its precursor. J Biol Chem. 2007;282:17190–17199. doi: 10.1074/jbc.M701304200. [DOI] [PubMed] [Google Scholar]
- 18.Rittenhouse J, Turon MC, Helfrich RJ, Albrecht KS, Weigl D, Simmer RL, Mordini F, Erickson J, Kohlbrenner WE. Affinity purification of HIV-1 and HIV-2 proteases from recombinant E. coli strains using pepstatin-agarose. Biochem Biophys Res Commun. 1990;171:60–66. doi: 10.1016/0006-291x(90)91356-w. [DOI] [PubMed] [Google Scholar]
- 19.Rose JR, Salto R, Craik CS. Regulation of autoproteolysis of the HIV-1 and HIV-2 proteases with engineered amino acid substitutions. J Biol Chem. 1993;268:11939–11945. [PubMed] [Google Scholar]
- 20.Mildner AM, Rothrock DJ, Leone JW, Bannow CA, Lull JM, Reardon IM, Sarcich JL, Howe WJ, Tomich CS, Smith CW. The HIV-1 protease as enzyme and substrate: mutagenesis of autolysis sites and generation of a stable mutant with retained kinetic properties. Biochemistry. 1994;33:9405–9413. doi: 10.1021/bi00198a005. [DOI] [PubMed] [Google Scholar]
- 21.Louis JM, Oroszlan S, Tozser J. Stabilization from autoproteolysis and kinetic characterization of the human T-cell leukemia virus type 1 proteinase. J Biol Chem. 1999;274:6660–6666. doi: 10.1074/jbc.274.10.6660. [DOI] [PubMed] [Google Scholar]
- 22.Ishima R, Torchia DA, Lynch SM, Gronenborn AM, Louis JM. Solution structure of the mature HIV-1 protease monomer: insight into the tertiary fold and stability of a precursor. J Biol Chem. 2003;278:43311–43319. doi: 10.1074/jbc.M307549200. [DOI] [PubMed] [Google Scholar]
- 23.Polgar L, Szeltner Z, Boros I. Substrate-dependent mechanisms in the catalysis of human immunodeficiency virus protease. Biochemistry. 1994;33:9351–9357. doi: 10.1021/bi00197a040. [DOI] [PubMed] [Google Scholar]
- 24.Pichuantes S, Babe LM, Barr PJ, DeCamp DL, Craik CS. Recombinant HIV2 protease processes HIV1 Pr53gag and analogous junction peptides in vitro. J Biol Chem. 1990;265:13890–13898. [PubMed] [Google Scholar]
- 25.Tozser J, Blaha I, Copeland TD, Wondrak EM, Oroszlan S. Comparison of the HIV-1 and HIV-2 proteinases using oligopeptide substrates representing cleavage sites in Gag and Gag-Pol polyproteins. FEBS Lett. 1991;281:77–80. doi: 10.1016/0014-5793(91)80362-7. [DOI] [PubMed] [Google Scholar]
- 26.Sayer JM, Liu F, Ishima R, Weber IT, Louis JM. Effect of the active-site D25N mutation on the structure, stability and ligand binding of the mature HIV-1 protease. J Biol Chem. 2008;283:13459–13470. doi: 10.1074/jbc.M708506200. [DOI] [PMC free article] [PubMed] [Google Scholar]
- 27.Sayer JM, Louis JM. Interactions of different inhibitors with active-site aspartyl residues of HIV-1 protease and possible relevance to pepsin. Proteins. 2008;75:556–568. doi: 10.1002/prot.22271. [DOI] [PMC free article] [PubMed] [Google Scholar]
- 28.Louis JM, Clore GM, Gronenborn AM. Autoprocessing of HIV-1 protease is tightly coupled to protein folding. Nat Struct Biol. 1999;6:868–875. doi: 10.1038/12327. [DOI] [PubMed] [Google Scholar]
- 29.Louis JM, Ishima R, Torchia DA, Weber IT. HIV-1 protease: structure, dynamics, and inhibition. Adv Pharmacol. 2007;55:261–298. doi: 10.1016/S1054-3589(07)55008-8. [DOI] [PubMed] [Google Scholar]
- 30.Nozaki Y, Tanford C. The solubility of amino acids and related compounds in aqueous urea solutions. J Biol Chem. 1963;238:4074–4081. [PubMed] [Google Scholar]
- 31.Davis DA, Tebbs IR, Daniels SI, Stahl SJ, Kaufman JD, Wingfield P, Bowman MJ, Chmielewski J, Yarchoan R. Analysis and characterization of dimerization inhibition of a multi-drug-resistant human immunodeficiency virus type 1 protease using a novel size-exclusion chromatographic approach. Biochem J. 2009;419:497–506. doi: 10.1042/BJ20082068. [DOI] [PMC free article] [PubMed] [Google Scholar]
- 32.Katoh E, Louis JM, Yamazaki T, Gronenborn AM, Torchia DA, Ishima R. A solution NMR study of the binding kinetics and the internal dynamics of an HIV-1 protease-substrate complex. Protein Sci. 2003;12:1376–1385. doi: 10.1110/ps.0300703. [DOI] [PMC free article] [PubMed] [Google Scholar]
- 33.Louis JM, Ishima R, Nesheiwat I, Pannell LK, Lynch SM, Torchia DA, Gronenborn AM. Revisiting monomeric HIV-1 protease. Characterization and redesign for improved properties. J Biol Chem. 2003;278:6085–6092. doi: 10.1074/jbc.M209726200. [DOI] [PubMed] [Google Scholar]
- 34.Ishima R, Ghirlando R, Tozser J, Gronenborn AM, Torchia DA, Louis JM. Folded monomer of HIV-1 protease. J Biol Chem. 2001;276:49110–49116. doi: 10.1074/jbc.M108136200. [DOI] [PubMed] [Google Scholar]
- 35.Wondrak EM, Louis JM. Influence of flanking sequences on the dimer stability of human immunodeficiency virus type 1 protease. Biochemistry. 1996;35:12957–12962. doi: 10.1021/bi960984y. [DOI] [PubMed] [Google Scholar]
- 36.Richards AD, Phylip LH, Farmerie WG, Scarborough PE, Alvarez A, Dunn BM, Hirel PH, Konvalinka J, Strop P, Pavlickova L, Kostka V, Kay J. Sensitive, soluble chromogenic substrates for HIV-1 proteinase. J Biol Chem. 1990;265:7733–7736. [PubMed] [Google Scholar]
- 37.Grzesiek S, Bax A. Improved 3D triple-resonance NMR techniques applied to a 31 kDa protein. J Magn Reson. 1992;96:432–40. [Google Scholar]
- 38.Muhandiram DR, Kay LE. Gradient-enhanced triple-resonance 3-dimensional NMR experiments with improved sensitivity. J Magn Reson B. 1994;103:203–216. [Google Scholar]
- 39.Delaglio F, Grzesiek S, Vuister GW, Zhu G, Pfeifer J, Bax A. NMRPipe: a multidimensional spectral processing system based on UNIX pipes. J Biomol NMR. 1995;6:277–293. doi: 10.1007/BF00197809. [DOI] [PubMed] [Google Scholar]
- 40.Johnson BA. Using NMRView to visualize and analyze the NMR spectra of macromolecules. Methods Mol Biol. 2004;278:313–352. doi: 10.1385/1-59259-809-9:313. [DOI] [PubMed] [Google Scholar]
- 41.Lam PY, Ru Y, Jadhav PK, Aldrich PE, DeLucca GV, Eyermann CJ, Chang CH, Emmett G, Holler ER, Daneker WF, Li L, Confalone PN, McHugh RJ, Han Q, Li R, Markwalder JA, Seitz SP, Sharpe TR, Bacheler LT, Rayner MM, Klabe RM, Shum L, Winslow DL, Kornhauser DM, Hodge CN. Cyclic HIV protease inhibitors: synthesis, conformational analysis, P2/P2' structure-activity relationship, and molecular recognition of cyclic ureas. J Med Chem. 1996;39:3514–3525. doi: 10.1021/jm9602571. [DOI] [PubMed] [Google Scholar]