

Abstract
Quantitative measurement of small molecules with high spatiotemporal resolution provides a solid basis for correct understanding and accurate modeling of metabolic regulation. A promising approach toward this goal is the FLIP (fluorescent indicator protein) nanosensor based on bacterial periplasmic binding proteins (PBPs) and fluorescence resonance energy transfer (FRET) between the yellow and cyan variants of green fluorescent protein (GFP). Each FLIP has a PBP module that specifically binds its ligand to induce a conformation change, leading to a change in FRET between the two GFP variant modules attached to the N- and C-termini of the PBP. The larger is the dynamic range the more reliable is the measurement. Thus, we attempted to expand the dynamic range of FLIP by introducing a circular permutation with a hinge loop deletion to the PBP module. All the six circularly permutated PBPs tested, including structurally distinct Type I and Type II PBPs, showed larger dynamic ranges than their respective native forms when used for FLIP. Notably, the circular permutation made three PBPs, which totally failed to show FRET change when used as their native forms, fully capable of functioning as a ligand binding module of FLIP. These FLIPs were successfully used for the determination of amino acid concentration in complex solutions as well as real-time measurement of amino acid influx in living yeast cells. Thus, the circular permutation strategy would not only improve the performance of each nanosensor but also expand the repertoire of metabolites that can be measured by the FLIP nanosensor technology.
Keywords: periplasmic binding protein, metabolite, real-time measurement, biosensor
Introduction
The cell regulates its metabolisms to respond to the changes of internal and external environments. To understand the metabolic regulation and to construct quantitative models, data on the dynamics of small molecule metabolites are indispensable.1 Such data would also contribute to understand and model signal transduction pathways that use small molecules as their inputs and/or outputs.2 However, because most conventional methods to determine the intracellular concentration of small molecules include destructive steps, such as, cell fixation or homogenization, they cannot be used for the continuous observation in a real-time mode. It is also difficult to totally eliminate contamination of small molecules from off-target compartments during homogenization. Especially, yeast and plant cells accumulate large amount of small molecules in the vacuole. Accordingly, leakage of small molecules from the vacuole during the destructive steps would readily overwhelm their cytosolic pools, making the determination of their concentrations impossible. To measure small molecule metabolites with high spatiotemporal resolution, we need such sensors and detection systems that can circumvent these issues.
Photodetection by luminescence and/or fluorescence would realize nondestructive and continuous measurements of intracellular states. Because any bioluminescence method requires a substrate for the chemical reaction to release luminescence, permeability of the substrate across the plasma membrane often limits the applicability of the method. On the other hand, fluorescence-based methods are free from the permeability problem. Expression of fluorescent proteins under the promoters that respond to certain small molecules has been used to report their dynamics.3 Because these systems are based on transcription, translation, maturation, and accumulation of the fluorescent proteins, they inevitably show delayed and slow responses. Thus, these systems are, in principle, suited for neither the observation of rapid changes nor the measurement that requires a subcellular resolution.
By contrast, methods based on fluorescence resonance energy transfer (FRET) are suitable for measurements that require high spatiotemporal resolution. FRET is a physical phenomenon that occurs between two fluorophores located in the close proximity, and its efficiency depends on the distance and orientation factor between the two fluorophores, the degree of spectral overlap between the donor emission and the acceptor absorption, the quantum yield of the donor in the absence of acceptor, and the refractive index of the medium.4 By utilizing FRET technology and protein labeled with fluorescent entities, many physical interactions between two proteins and intramolecular conformational changes of a protein have been successfully detected as changes of FRET efficiency in a real-time manner.5
A prerequisite to construct a genetically encoded FRET-based sensor for a certain small molecule is a protein that not only has high affinity and specificity to the molecule but also displays a significant conformational change upon its binding to the molecule. In this study, we utilized bacterial periplasmic binding proteins (PBPs) as the ligand-binding module. PBP is a component of the bacterial ATP binding cassette transporter system and resides in the periplasm of the cell to play a key role in transporting small molecules into the cytoplasm.6 The affinities and specificities of PBPs to their cognate ligands are usually very high. A variety of PBPs are known to recognize various small molecules ranging from sugars, amino acids, metals, inorganic ions, etc.7 The X-ray crystallographic data are available for many PBPs8 and have been successfully exploited to modify their binding properties.9 PBPs share a common three-dimensional structure consisting of two lobes, despite the limited identity among their primary amino acid sequences.10 Each PBP captures its ligand at the pocket formed between the two lobes.8
The combination of FRET-technology and PBPs has been providing a versatile platform to construct sensors for various small molecules. Especially, fusion of green fluorescent protein (GFP) variants to the N- and C-termini of PBPs has led to the development of genetically encoded FRET-based sensors termed as fluorescent indicator proteins (FLIPs), which have been demonstrated to be useful in the detection of their cognate ligands both in vitro and in vivo.11–15 PBPs with various binding properties can be searched from appropriate bacteria that have adapted to a variety of different habitats.16 Despite the remarkable progress in manipulating the properties of PBPs,9 there remains a difficulty in their use for FLIP development; the dynamic range of FRET ratio change often falls short of acquiring significant data on the dynamics of small molecules. To improve the dynamic ranges, semirational methods have been undertaken using linker truncation and fluorophore integration into the loops of the PBP modules.17 Although these methods have been successfully used, they still require a substantial amount of labor in DNA construction even for the improvement of a single sensor. Because the combination of PBPs and FRET per se has proved useful, a more general method to improve the dynamic ranges is desirable to further enhance the utility of FLIPs to accelerate the analysis of dynamics of various small molecules in living cells.
Here, we propose a novel approach that uses a circular permutation of PBPs to improve the dynamic range of FLIPs. We demonstrates that all the six circularly permutated PBPs (cpPBPs) tested displayed significantly larger dynamic ranges than their native forms when used as the ligand-binding modules of FLIPs, thereby proving the concept of this approach.
Results
Construction of amino acid nanosensors
We selected a set of six PBPs that bind amino acids, namely, HisJ, ArgT, ArtJ, GlnH, GltI, and LivJ, as the ligand-binding modules to develop nanosensors (Table I). Although LivJ is a Type I PBP, the other five are Type II PBPs. Genes encoding these PBPs were cloned from genomic DNA of E. coli. Binding specificities and affinities of HisJ and ArgT for their cognate substrates have been characterized.18,19 We made each mature form of these PBPs flanked with two GFP variants by attaching a yellow fluorescent protein (Venus) and a cyan fluorescent protein (ECFP) to the N- and C- termini, respectively (Fig. 1).
Table I.
Properties of FLIPs for Amino Acids
| Sensor | PBP | PDBID | Structural classification | Position of removed hinge | Ligand | Dynamic range | Apparent Kd (μM) |
|---|---|---|---|---|---|---|---|
| FILP-HisJ | HisJ | 1HSL | Type II | – | His | −14% | 0.023 |
| FlIP-cpHisJ194 | HisJ | – | – | 182–193 | His | +63% | 14 |
| FLIP-ArgT | ArgT | 2LAO | Type II | – | Lys, Arg, Orna | ∼0% | – |
| FLIP-cpArgT194 | ArgT | – | – | 182–193 | Lys, Arg, Orna | +57% | 48b |
| FLIP-ArtJ | ArtJ | – | Type II | – | Arg | ∼0% | – |
| FLIP-cpArtJ185 | ArtJ | – | – | 179–184 | Arg | +54% | 9.4 |
| FLIP-GlnH | GlnH | 1GGG | Type II | – | Gln | −6% | 0.048 |
| FLIP-cpGlnH183 | GlnH | – | – | 177–182 | Gln | +13% | 0.040 |
| FLIP-GltI | GltI | – | Type II | – | Asp, Glu | ∼0% | – |
| FLIP-cpGltI210 | GltI | – | – | 204–209 | Asp, Glu | +31% | 35c |
| FLIP-LivJ | LivJ | 1Z15 | Type I | – | Leu, Ile, Val | −14% | 0.15d |
| FLIP-cpLivJ261 | LivJ | – | – | 249–260 | Leu, Ile, Val | +25% | >1100d |
Orn, ornithine.
Kd for Arg.
Kd for Glu.
Kd for Leu.
Figure 1.
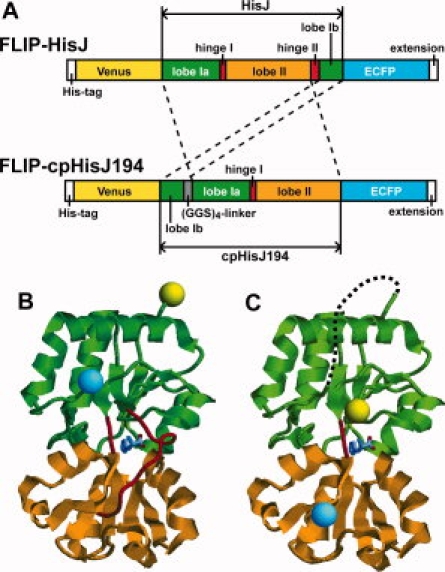
Design of genetically encoded FRET-based nanosensors using PBP and circularly permutated PBP as ligand-binding module. (A) FLIP-HisJ and FLIP-cpHisJ194 constructs. To construct cpHisJ194, the second hinge (a.a. 182–193) was removed and the 194th residue of HisJ was used as the first residue of cpHisJ194. The C- and N-termini of HisJ were connected by a (Gly-Gly-Ser)4 linker peptide. Both proteins have a His6-tag for affinity purification and an extension at their N- and C-termini, respectively. (B) Structural model of FLIP-HisJ based on the crystal structure of HisJ (PDBID: 1HSL). (C) Structural model of FLIP-cpHisJ194. Yellow sphere, N-terminal Venus; cyan sphere, C-terminal ECFP; green string, lobe I of HisJ; orange string, lobe II of HisJ; red string, hinges of HisJ; dotted string, (Gly-Gly-Ser)4 linker peptide. Histidine molecule as the ligand is colored in CPK. Images are generated by RasMol and Adobe Photoshop software.
We performed titration of each purified fusion protein in the presence of different concentrations of its cognate ligand. FLIP-HisJ, FLIP-LivJ, and FLIP-GlnH showed ligand concentration-dependent decreases in FRET ratio (Figs. 2 and 3). The dynamic ranges were −14%, −14%, and −6% for FLIP-HisJ, FLIP-LivJ, and FLIP-GlnH, respectively (Fig. 3, Table I). On the other hand, FLIP-ArgT, FLIP-ArtJ, and FLIP-GltI failed to show any significant signal change in FRET (Fig. 3). We determined the binding constant (Kd) of each of the three sensors to its cognate substrate fluorometrically (Table I). To determine the substrate specificity, we incubated each FLIP with 19 different amino acids and measured FRET signal changes (Supporting Information Fig. S1). FLIP-HisJ and FLIP-GlnH showed a high specificity to histidine and glutamine, respectively. FLIP-LivJ showed affinities to leucine, isoleucine, and valine. Unexpectedly, FLIP-LivJ responded also to threonine.
Figure 2.
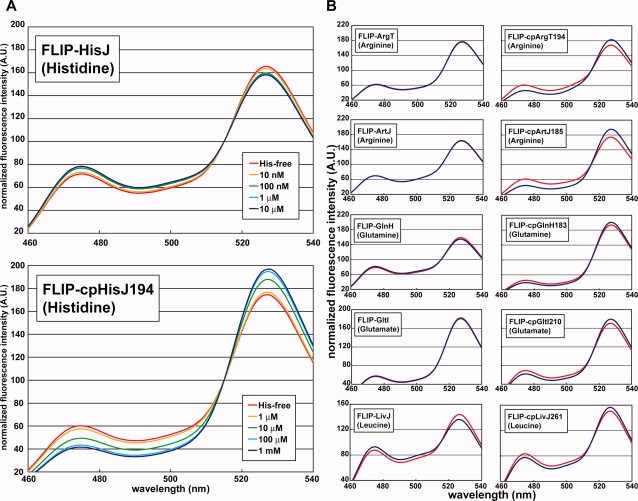
Ligand-dependent spectral changes of FLIPs for amino acids. (A) Histidine concentration-dependent spectral changes of FLIP-HisJ (above) and FLIP-cpHisJ194 (below). (B) Ligand-dependent spectral changes of amino acid nanosensors. Blue line, spectrum in the presence of each ligand (1 mM); red line, spectrum in the absence of the ligand. The substrate used in the spectral measurement is shown in each chart.
Figure 3.
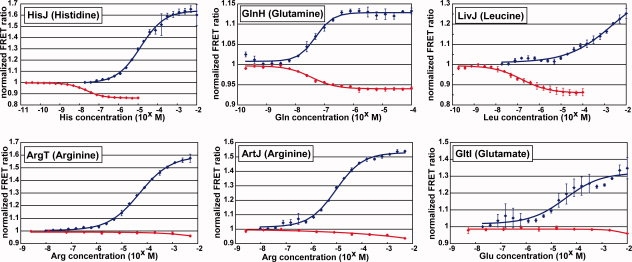
Dose response of FLIPs for amino acids. Ligand concentration-dependent FRET ratio (527/475-nm ratio) changes were plotted for each amino acid nanosensor. Red line, “linearly fused”-type nanosensor or FLIP-PBP; blue line, “circularly permutated”-type nanosensor or FLIP-cpPBP. Each saturation curve represents the average of titrations of three independently purified FLIPs, and each error bar indicates standard deviation from the average.
Expansion of FRET dynamic range via circular permutation of PBP
A most frequently encountered problem in developing FLIPs is the small dynamic range of signal change. Because the five Type II PBPs used in this study have their N- and C-termini in the same lobe, it was expected that the change of the distance between the two fluorophores could not be large enough for significant FRET signal change. If the two GFP variants are attached to different lobes, the dynamic range of FRET signal change would be improved.
Thus, we decided to engineer PBP per se via a circular permutation to make the newly formed N- and C-termini reside in different lobes. Because structural data are available for four PBPs used in this study (Table I), we can exploit them for designing each circular permutation. The positions of hinges of each PBP were identified by visual inspection of the structural data. For ArtJ and GltI, which lack structural information, we predicted the positions of their hinges based on homology models generated by SwissModel.20
Following the identification/prediction of the hinge loops, we deleted one of them to generate new N- and C-termini (Fig. 1). The “old” N- and C-termini were connected via a flexible linker peptide (Gly-Gly-Ser)4. The PBP engineered via a circular permutation with a hinge loop deletion in this study was named “cpPBP.” Each cpPBP was flanked with two GFP variants, Venus and ECFP, attached to the “new” N- and C- termini, respectively. These fusion proteins were named FLIP-cpPBPs. For instance, cpHisJ194 indicates that it uses the 194th residue of HisJ as its N-terminus (Fig. 1).
We performed titration of purified FLIP-cpPBPs in the presence of different concentrations of cognate ligands. All the six FLIP-cpPBPs showed ligand concentration-dependent changes in FRET signal. The dynamic ranges were +63%, +57%, +54%, +13%, +31%, and +25% for FLIP-cpHisJ194, FLIP-cpArgT194, FLIP-cpArtJ185, FLIP-cpGlnH183, FLIP-cpGltI210, and FLIP-cpLivJ261, respectively (Fig. 3, Table I). Notably, in sharp contrast to the absence of any significant FRET signal change of FLIP-ArgT, FLIP-ArtJ, and FLIP-GltI, all their circularly permutated variants, namely, FLIP-cpArgT194, FLIP-cpArtJ185, and FLIP-cpGltI210, showed a significant increment in FRET signal dependent on the concentration of cognate substrates (Figs. 2 and 3). Furthermore, the dynamic ranges of FLIP-cpHisJ194, FLIP-cpGlnH183, and FLIP-cpLivJ261 were ∼4.5-fold, ∼2.2-fold, and ∼1.8-fold larger than those of FLIP-HisJ, FLIP-GlnH, and FLIP-LivJ, respectively (Table I). Thus, the circular permutation strategy succeeded in expanding the dynamic range of all the six PBPs that we examined. Intriguingly, when FLIP-HisJ, FLIP-GlnH, and FLIP-LivJ showed a ligand-dependent decrease in FRET signal, all of their circularly permutated variants (i.e., FLIP-cpHisJ194, FLIP-cpGlnH183, and FLIP-cpLivJ261) showed a ligand-dependent increase in FRET ratio.
Next, we determined the Kd of each FLIP-cpPBP for the cognate ligand fluorometrically (Table I). FLIP-cpHisJ194 and FLIP-cpLivJ261 have lower affinities for the cognate ligands than FLIP-HisJ and FLIP-LivJ, respectively. In contrast, FLIP-cpGlnH183 and FLIP-GlnH have comparable affinities to glutamate. Thus, the effect of a circular permutation with a hinge loop deletion to the affinity for the cognate ligand varies from one PBP to another. To determine the ligand specificity, each FLIP-cpPBP was incubated with different amino acids and FRET signal changes were measured (Fig. S1). FLIP-cpHisJ194 showed a high specificity to histidine but had relatively low affinities for other basic amino acids, lysine and arginine. FLIP-cpGlnH183 showed a high specificity to glutamine. In contrast, FLIP-cpLivJ261 displayed a relatively wide spectrum of affinities for a number of amino acids; it responded to not only leucine, isoleucine, and valine but also phenylalanine and methionine. FLIP-cpArgT194, FLIP-cpArtJ185, and FLIP-cpGltI210 showed a high specificity to lysine and arginine, arginine, and aspartic acid and glutamic acid, respectively. As for ArgT, the observed specificity is consistent with that reported previously.19
Determination of amino acid concentrations in complex solutions in vitro
To test whether the FLIP-cpPBPs are applicable to the determination of amino acids in complex solutions, we tried to perform titrations of standard yeast culture media that were spiked with known concentrations of amino acids. We used FLIP-cpHisJ194 and FLIP-cpArtJ185 to determine the concentrations of histidine and arginine, respectively (Fig. 4). The determined values by these nanosensors were, albeit in the same order of magnitude, somewhat higher than the expected values (Fig. 4). The discrepancy between the expected and determined values in hisitidine determination was greater than that in arginine determination, presumably because FLIP-cpHisJ194 has weak affinities for other basic amino acids (Supporting Information Fig. S1).
Figure 4.

Analysis of amino acids in complex solutions. (A) Purified FLIP-cpHisJ194 was titrated with different dilutions of yeast culture media spiked with given concentrations of histidine. (B) Purified FLIP-cpArtJ185 was titrated with different dilutions of yeast culture media spiked with given concentrations of arginine. Blue line, ligand concentration at 10 mM; red line, ligand concentration at 2 mM. The dilution at the half-saturation equals the binding constant and can be used to quantify the substrate concentration.
In vivo analysis of amino acid uptake
To test the FLIPs in vivo, we tried to perform real-time measurements of cytosolic amino acid concentration dynamics in living yeast cells. The concentration of cytosolic amino acids can range from tens of micromolar to tens of millimolar in the yeast.21 Among the nanosensors developed in this study, FLIP-cpHisJ194 seemed to be readily applicable to the measurement of the dynamics of cytosolic histidine without further modification. In the yeast cells, histidine is likely the terminal product that is consumed only via protein synthesis. We transformed a histidine-prototrophic strain W303H with a plasmid that expresses FLIP-cpHisJ194. Fluorescent micrographs of the obtained transformants showed that the nanosensor protein is localized exclusively in the cytosol but not in the vacuole [Fig. 5(A)]. We set the yeast cell suspension in a fluorometer and recorded the fluorescence spectra at every 30 s. When we raised the extracellular concentration of histidine from 0 to 1 mM, the 527/475-nm emission intensity ratio showed ∼10% increment within 10 min [Fig. 5(B)] and leveled off to an asymptotic level within 30 min (data not shown). The magnitude of increment in the FRET ratio was dependent on the concentration of extracellular histidine. The observations indicated that FLIP-cpHisJ194 enables real-time measurement of histidine influx in living yeast cells.
Figure 5.
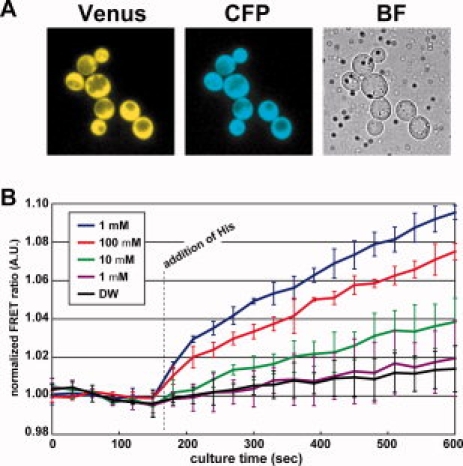
In vivo analysis of amino acid influx. (A) Fluorescent micrographs of living yeast cells expressing FLIP-cpHisJ194. Venus, yellow channel image for Venus; ECFP, cyan channel image for ECFP; BF, bright field image. (B) Real-time measurements of cytosolic amino acid concentration dynamics in yeast cell suspensions. Addition of histidine caused an increase of the FRET ratio. The magnitude of increase depended on the concentration of the extracellular histidine (blue, red, green lines). Almost no change was observed with addition of low level of histidine (purple) or water (black). Data are presented as the average of at least three experiments, and each error bar indicates standard deviation from the average.
However, strictly speaking, we cannot attribute the increment of FRET ratio solely to the influx, because the FRET ratio showed a slight increment even in the absence of extracellular histidine. Importantly, we observed a slight decrease of FRET ratio in a similar experiment using FLIP-HisJ L52D that exhibits a decrease in FRET ratio upon histidine-binding (Kd for His, 460 μM; dynamic range −35%) (data not shown). These results are consistent to indicate that the observed changes were not artifacts but indeed reflected a small increment in the cytosolic concentration of histidine. We assume that, in response to the medium change associated with the measurement, the cells conceivably mobilized amino acids by stimulating their export from the vacuole, salvage from proteins, and/or de novo synthesis.
Discussion
One of the major goals of current biology would be the quantitative modeling of reactions that occur in living cells.22 To model these reactions, it is vital to accumulate quantitative data on the dynamics of each component involved in the reactions. Because biomolecular components are not always distributed uniformly in the cell, measurement with subcellular resolution is often required. Furthermore, to acquire dynamics data on these molecules, a method for nondestructive, real-time measurements is indispensable. As an approach to fulfill with these requirements, genetically encoded FRET-based nanosensors termed FLIPs have been developed by combining PBPs and FRET between two GFP variants.
FRET-based sensors including FLIPs often suffer from narrow dynamic ranges, falling short of achieving reliable dynamics data. However, optimization of the dynamic range is not a trivial task. The most prevailing methods to date are basically a brute-force examination of various linkers of different sequences and/or lengths that connect the fluorophore to the detector protein.23,24 Because the FLIP nanosensor has two linkers, the number of combinations to be examined becomes inevitably large. In addition, the index of the dynamic range is not the absolute value of FRET efficiency, but the difference between the FRET efficiency of the open (ligand-free) and closed (ligand-bound) forms, thereby making the screening more difficult. Although fluorophore integration into the loops of the PBP was reported as an alternative method to improve the dynamic range,17 the number of constructs to be examined in this strategy is still substantial. A much simpler and more generally applicable method is desirable for the improvement of dynamic range of FLIPs.
Why is the dynamic range small and how can we improve it? FRET is a physical phenomenon in which nonradiative energy transfer occurs between two fluorophores.4 The FRET efficiency is dependent on the distance and orientation factor between the two fluorophores, the degree of spectral overlap between the donor emission and the acceptor absorption, the quantum yield of the donor in the absence of acceptor, and the refractive index of the medium.4,5 When the GFP variants are utilized as fluorophores, the distance providing the half maximum efficiency is in the range of 1–10 nm,25 which is suited for the detection of intramolecular conformational changes of proteins. Indeed, various genetically encoded FRET-based sensors have been constructed by combining proteins that changes their conformation on ligand binding and GFP variants as detector and reporter modules, respectively.11–15 However, the fusion of GFP variants to the N- and C-termini of a protein is not always successful in terms of achieving enough change of the distance between the two fluorophores and, hence, enough change in the FRET efficiency.
In this context, it should be noted that N- and C-termini of most Type II PBPs reside in the same lobe of the molecule.10 Accordingly, the distance between the two fluorophores attached to both ends of such a PBP is expected to show only a small difference between the open and the closed forms, leading to a narrow dynamic range of FRET ratio change. To expand the distance change between the two fluorophores upon ligand binding, we intended to attach two fluorophores to different lobes of a PBP by introducing a circular permutation to the PBP at its hinge position, because we predicted, based on structural information of PBPs, that the change of distance between the new N- and C-termini of the cpPBP would be larger than that of the native PBP.
We tested six PBPs recognizing amino acids in both their native and circularly permutated forms as ligand binding modules in FLIPs. Although three of the six native PBPs worked with rather small dynamics ranges, all the six circularly permutated forms showed much improved dynamic ranges. Notably, the circular permutation was effective for not only Type II but also Type I PBPs and even the three PBPs totally incapable of showing FRET in their native forms. Thus, the circular permutation strategy would contribute to expand the repertoire of PBPs to be used for FLIPs, and, hence, small molecules to be detected by this technology. Intriguingly, the orientations of the FRET ratio change of FLIP-cpPBPs were opposite to those of cognate FLIP-PBPs. A pair of nanosensors that bind the same ligand but show FRET ratio change to the opposite directions may be useful in designing carefully controlled experiments. The FLIP-cpPBPs were successfully used for in vitro measurements of the cognate amino acids in complex solutions as well as real-time detection of amino acid influx in living yeast cells.
Although the FLIPs can measure the relative change of ligand concentration, they cannot measure its absolute value directly. To estimate the absolute value, a careful calibration has to be performed using a perfusion culture.12 It should be also noted that, under certain conditions, the FRET signals can change independently of the conformational change of PBP modules. For instance, when the FLIPs are localized to small subcellular compartments or the membranes, their local concentration can be extremely high. Because GFP variants tend to dimerize at high concentration,26 GFP variant modules of FLIPs may dimerize to induce FRET even in the absence of the ligands. It is, thus, desirable to use monomeric mutants of fluorescent protein for such FLIPs.26
Introduction of a circular permutation with a hinge loop deletion to HisJ and LivJ resulted in a marked decrease in their affinities for cognate ligands; reduction of the number of loops forming the hinge and the closer proximity of the two GFP variant entities might affect the stability of the closed form of these PBPs. Nevertheless, the sensors retain an ability to bind their cognate ligands in the physiological concentration ranges. These results can be interpreted as follows in the context of the evolutionary scenario of the PBPs. The origin of current PBPs is assumed to be a CheY-like single-domain protein.10 Domain swapping between the C-terminal helices of two CheY-like molecules might lead to the formation of a hinge region and the appearance of the most ancestral Type I PBP. Subsequently, some Type I proteins changed to the Type II protein via “domain dislocations.” As a result of this diversification, the Type I PBPs evolved to bear three loops to form the hinge, whereas the Type II PBPs evolved to have two loops. Based on this scenario, we reasoned that, if the primordial state of PBPs is composed of two separate CheY-like proteins located in the proximity, then even a PBP mutant retaining only a single hinge loop may well retain an ability to bind its cognate ligand. Thus, we introduced a circular permutation to each PBP to delete one of the hinge loops and found that the resultant cpPBP does bind its ligand often with a diminished affinity, which may be a reflection of a state close to the primordial PBP and is not unexpected.
Conclusion
In conclusion, we demonstrated that the introduction of a circular permutation to PBP is effective in expanding the dynamic range of the FRET ratio change of FLIP nanosensor. The dynamic range of FLIP-cpPBP would be further improved by the optimization of its linkers23,24 and the circular permutation of the fluorophores.27 The circular permutation strategy proposed here would not only improve the performance of each nanosensor but also expand the repertoire of small molecules to be measured by the FLIP technology, thereby contributing to deepen our understanding of metabolic regulation.
Materials and Methods
Molecular cloning
The ORF encoding each PBP was amplified using PCR from genomic DNA of E. coli strain DH5α. Amplified products were cloned into a TA-cloning vector pCRII-TOPO (Invitrogen). For each PBP, an N-terminal oligonucleotide primer with a SpeI site was designed to clone the processed mature periplasmic form devoid of the signal sequence, whereas a C-terminal oligonucleotide primer with a BglII site was designed to eliminate the stop codon. A cassette was constructed using a fragment encoding Venus (a brighter version of enhanced yellow fluorescent protein) followed by an enhanced cyan fluorescent protein (ECFP) on a Saccharomyces cerevisiae-E. coli shuttle vector pRS316. Each truncated PBP-encoding fragment was fused between the two GFP variant-encoding gene fragments on the cassette. Then, the chimeric fragment encoding Venus-PBP-ECFP was inserted into pET28a and transferred into E. coli strain Rosetta (DE3, pLysS) for expression and purification of the nanosensor.
Construction of cpPBPs
The DNA fragment encoding a PBP with a (Gly-Gly-Ser)4 peptide linker and a XbaI site at the C-terminus was obtained by PCR and cloned into pCRII-TOPO. The SpeI-PBP-BglII fragment and SpeI-PBP-(Gly-Gly-Ser)4-XbaI fragment were ligated using Mighty Mix (TaKaRa, Japan) and purified with AMPure beads (Agencourt). The purified ligation products were used as a template for PCR to amplify the fragment that encodes a desired cpPBP. Each cpPBP-encoding fragment was sandwiched between the two GFP variant-encoding fragments. Then, the chimeric fragment that encodes Venus-cpPBP-ECFP was inserted into pET28a and transferred into E. coli strain Rosetta (DE3, pLysS) for expression and purification (see later). These nanosensors are named FLIPs based on the nomenclature by Frommer's laboratory.11–15
Protein expression and purification
The transformed cells of Rosetta (DE3, pLysS) were cultivated overnight at 30°C in 2×YT medium containing antibiotics (20 μg/mL kanamycin and 30 μg/mL chloramphenicol), and the aliquot of the culture was transferred to 30 mL of fresh 2×YT medium containing the appropriate antibiotics. When the cell density reached an A600 of 0.3–0.5, isopropyl β-d-thiogalatoside (IPTG) was added to a final concentration of 0.05 mM to induce the expression of the protein encoded on the expression vector pET28a, and the mixture was cultured for 4 h at 30°C. Following an overnight incubation at 4°C, the cells were collected by centrifugation and lyzed by sonication on ice in 12 mL of lysis buffer (50 mM NaH2PO4, 300 mM NaCl, 10 mM imidazole) using the UR-20P sonicator (TOMY Seiko., Tokyo, Japan). Lysates were cleared by centrifugation (20,400g, 10 min, 4°C), and the supernatants containing soluble proteins were incubated with 30 μL of Ni-NTA resin for 3 h at 4°C. Then, the resin was washed three times with 1 mL of wash buffer (50 mM NaH2PO4, 300 mM NaCl, 20 mM imidazole), and bound proteins were eluted with an appropriate volume of elution buffer (50 mM NaH2PO4, 300 mM NaCl, 200 mM imidazole).
In vitro characterization of biosensors
Emission spectra of purified proteins were recorded spectrofluorometrically using the FP-6500 fluorometer (JASCO, Tokyo) after exciting ECFP at 433 nm. All in vitro analyses were performed in 20 mM sodium phosphate buffer (pH 7.0). FRET was determined as Venus-ECFP emission intensity ratio (527/475 nm intensity). The apparent Kd was determined as the ligand concentration at which the sensor is half-saturated.
Determination of amino acid concentration in vitro
Serial dilutions of the sample were measured with a FLIP to determine the dilution ratio at which the FLIP is half-saturated. The concentration of the ligand in the solution was determined from this dilution ratio and the apparent Kd of the sensor.
Spectroscopic analysis of yeast cell suspension
To express FLIPs in the yeast, we constructed a series of pFLIP plasmids, each of which expresses a FLIP from the PMA1 promoter and is marked with URA3. For the examination of histidine influx, we transformed a histidine-prototrophic strain W303H28 with pFLIP-cpHisJ194. Following an overnight cultivation of the transformant in YC medium (Yeast nitrogen base 6.7 g/L, succinate 10 g/L, NaOH 6 g/L, glucose 20 g/L, amino acid mixture 0.8 g/L) lacking histidine and uracil (YC-His-Ura), an aliquot was transferred to 30 mL of fresh YC-His-Ura medium. When the cell density reached an A600 of 0.3–0.4, an aliquot was drawn from the culture, washed with PBS, and resuspended in the same volume of PBS, to which appropriate amounts of histidine were added. Dynamics of fluorescent emission spectra of the cell suspension were recorded by the fluorometer (FP-6500) with an interval scan program with 30-s intervals.
Imaging of living yeast cells
The yeast strain W303H transformed with each pFLIP was grown overnight in YC-Ura medium, and the aliquot of the culture was transferred to 30 mL of fresh YC-Ura medium. A drop of cell culture was placed on a glass slide and covered with a coverslip. Imaging of yeast cells was performed on a fluorescence microscope (Axioskop II plus, Carl Zeiss) with a cooled charge-coupled device camera (AxioCam, Carl Zeiss). Fluorescent images were recorded using AxioVision3.0 software with 440/21 excitation filter and 480/30 emission filter (for ECFP) and with 500/25 excitation filter and 545/35 emission filter (for Venus). The microscopic images, thus, acquired were processed with Photoshop software (Adobe Systems).
Glossary
Abbreviations:
- cpPBP
circularly permutated periplasmic binding protein
- ECFP
enhanced cyan fluorescent protein
- FLIP
fluorescent indicator protein
- FRET
fluorescence resonance energy transfer
- GFP
green fluorescent protein
- PBP
periplasmic binding protein.
References
- 1.Castrillo JI, Zeef LA, Hoyle DC, Zhang N, Hayes A, Gardner DC, Cornell MJ, Petty J, Hakes L, Wardleworth L, Rash B, Brown M, Dunn WB, Broadhurst D, O'Donoghue K, Hester SS, Dunkley TP, Hart SR, Swainston N, Li P, Gaskell SJ, Paton NW, Lilley KS, Kell DB, Oliver SG. Growth control of the eukaryote cell: a systems biology study in yeast. J Biol. 2007;6:4. doi: 10.1186/jbiol54. [DOI] [PMC free article] [PubMed] [Google Scholar]
- 2.Hinnebusch AG. Mechanisms of gene regulation in the general control of amino acid biosynthesis in Saccharomyces cerevisiae. Microbiol Rev. 1988;52:248–273. doi: 10.1128/mr.52.2.248-273.1988. [DOI] [PMC free article] [PubMed] [Google Scholar]
- 3.Becskei A, Séraphin B, Serrano L. Positive feedback in eukaryotic gene networks: cell differentiation by graded to binary response conversion. EMBO J. 2001;20:2528–2535. doi: 10.1093/emboj/20.10.2528. [DOI] [PMC free article] [PubMed] [Google Scholar]
- 4.Lakowicz JR. Principles of fluorescence spectroscopy. 2nd edition. New York: Kluwer Academic; 1999. [Google Scholar]
- 5.Truong K, Ikura M. The use of FRET imaging microscopy to detect protein–protein interactions and protein conformational changes in vivo. Curr Opin Struct Biol. 2001;11:573–578. doi: 10.1016/s0959-440x(00)00249-9. [DOI] [PubMed] [Google Scholar]
- 6.Linton KJ, Higgins CF. The Escherichia coli ATP-binding cassette (ABC) proteins. Mol Microbiol. 1998;28:5–13. doi: 10.1046/j.1365-2958.1998.00764.x. [DOI] [PubMed] [Google Scholar]
- 7.Tam R, Saier MH., Jr Structural, functional, and evolutionary relationships among extracellular solute-binding receptors of bacteria. Microbiol Rev. 1993;57:320–346. doi: 10.1128/mr.57.2.320-346.1993. [DOI] [PMC free article] [PubMed] [Google Scholar]
- 8.Dwyer MA, Hellinga HW. Periplasmic binding proteins: a versatile superfamily for protein engineering. Curr Opin Struct Biol. 2004;14:495–504. doi: 10.1016/j.sbi.2004.07.004. [DOI] [PubMed] [Google Scholar]
- 9.Looger LL, Dwyer MA, Smith JJ, Hellinga HW. Computational design of receptor and sensor proteins with novel functions. Nature. 2003;423:185–190. doi: 10.1038/nature01556. [DOI] [PubMed] [Google Scholar]
- 10.Fukami-Kobayashi K, Tateno Y, Nishikawa K. Domain dislocation: a change of core structure in periplasmic binding proteins in their evolutionary history. J Mol Biol. 1999;286:279–290. doi: 10.1006/jmbi.1998.2454. [DOI] [PubMed] [Google Scholar]
- 11.Fehr M, Frommer WB, Lalond S. Visualization of maltose uptake in living yeast cells by fluorescent nanosensors. Proc Natl Acad Sci USA. 2003;99:9846–9851. doi: 10.1073/pnas.142089199. [DOI] [PMC free article] [PubMed] [Google Scholar]
- 12.Fehr M, Lalonde S, Lager I, Wolff MW, Frommer WB. In vivo imaging of the dynamics of glucose uptake in the cytosol of COS-7 cells by fluorescent nanosensors. J Biol Chem. 2003;278:19127–19133. doi: 10.1074/jbc.M301333200. [DOI] [PubMed] [Google Scholar]
- 13.Lager I, Fehr M, Frommer WB, Lalonde S. Development of a fluorescent nanosensor for ribose. FEBS Lett. 2003;553:85–89. doi: 10.1016/s0014-5793(03)00976-1. [DOI] [PubMed] [Google Scholar]
- 14.Okumoto S, Looger LL, Micheva KD, Reimer RJ, Smith SJ, Frommer WB. Detection of glutamate release from neurons by genetically encoded surface-displayed FRET nanosensors. Proc Natl Acad Sci USA. 2005;102:8740–8745. doi: 10.1073/pnas.0503274102. [DOI] [PMC free article] [PubMed] [Google Scholar]
- 15.Gu H, Lalonde S, Okumoto S, Looger LL, Scharff-Poulsen AM, Grossman AR, Kossmann J, Jokobsen I, Frommer WB. A novel analytical method for in vivo phosphate tracking. FEBS Lett. 2006;580:5885–5893. doi: 10.1016/j.febslet.2006.09.048. [DOI] [PMC free article] [PubMed] [Google Scholar]
- 16.Lager I, Looger LL, Hilpert M, Lalonde S, Frommer WB. Conversion of a putative agrobacterium sugar-binding protein into a FRET sensor with high selectivity for sucrose. J Biol Chem. 2006;281:30875–30883. doi: 10.1074/jbc.M605257200. [DOI] [PubMed] [Google Scholar]
- 17.Deuschle K, Okumoto S, Fehr M, Looger LL, Kozhukh L, Frommer WB. Construction and optimization of a family of genetically encoded metabolite sensors by semirational protein engineering. Protein Sci. 2005;14:2304–2314. doi: 10.1110/ps.051508105. [DOI] [PMC free article] [PubMed] [Google Scholar]
- 18.Wolf A, Lee KC, Kirsch JF, Ames GF-L. Ligand-dependent conformational plasticity of the periplasmic histidine-binding protein HisJ. J Biol Chem. 1996;271:21243–21250. doi: 10.1074/jbc.271.35.21243. [DOI] [PubMed] [Google Scholar]
- 19.Nikaido K, Ames GF-L. Purification and characterization of the periplasmic lysine-, arginine-, ornithine-binding protein (LAO) from Salmonella typhimurium. J Biol Chem. 1992;267:20706–20712. [PubMed] [Google Scholar]
- 20.Arnold K, Bordoli L, Kopp J, Schwede T. The SWISS-MODEL workspace: a web-based environment for protein structure homology modelling. Bioinformatics. 2006;22:195–201. doi: 10.1093/bioinformatics/bti770. [DOI] [PubMed] [Google Scholar]
- 21.Kitamoto K, Yoshizawa K, Ohsumi Y, Anraku Y. Dynamic aspects of vacuolar and cytosolic amino acid pools of Saccharomyces cerevisiae. J Bacteriol. 1988;170:2683–2686. doi: 10.1128/jb.170.6.2683-2686.1988. [DOI] [PMC free article] [PubMed] [Google Scholar]
- 22.Kitano H. International alliances for quantitative modeling in systems biology. Mol Syst Biol. 2005;1 doi: 10.1038/msb4100011. 2005.0007. [DOI] [PMC free article] [PubMed] [Google Scholar]
- 23.Hires SA, Zhu Y, Tsien RY. Optical measurement of synaptic glutamate spillover and reuptake by linker optimized glutamate-sensitive fluorescent reporters. Proc Natl Acad Sci USA. 2008;105:4411–4416. doi: 10.1073/pnas.0712008105. [DOI] [PMC free article] [PubMed] [Google Scholar]
- 24.Shimozono S, Hosoi H, Mizuno H, Fukano T, Tahara T, Miyawaki A. Concatenation of cyan and yellow fluorescent proteins for efficient resonance energy transfer. Biochemistry. 2006;45:6267–6271. doi: 10.1021/bi060093i. [DOI] [PubMed] [Google Scholar]
- 25.Patterson GH, Piston DW, Barisas BG. Förster distances between green fluorescent protein pairs. Anal Biochem. 2000;284:438–440. doi: 10.1006/abio.2000.4708. [DOI] [PubMed] [Google Scholar]
- 26.Zacharias DA, Violin JD, Newton AC, Tsien RY. Partitioning of lipid-modified monomeric GFPs into membrane microdomains of live cells. Science. 2002;296:913–916. doi: 10.1126/science.1068539. [DOI] [PubMed] [Google Scholar]
- 27.Nagai T, Yamada S, Tominaga T, Ichikawa M, Miyawaki A. Expanded dynamic range of fluorescent indicators for Ca2+ by circularly permuted yellow fluorescent proteins. Proc Natl Acad Sci USA. 2004;101:10554–10559. doi: 10.1073/pnas.0400417101. [DOI] [PMC free article] [PubMed] [Google Scholar]
- 28.Kubota H, Obata T, Ota K, Sasaki T, Ito T. Rapamycin-induced translational derepression of GCN4 mRNA involves a novel mechanism for activation of the eIF2α kinase GCN2. J Biol Chem. 2003;278:20457–20460. doi: 10.1074/jbc.C300133200. [DOI] [PubMed] [Google Scholar]