Abstract
We present a novel method for integrating two single-molecule measurement modalities, namely, total internal reflection microscopy and electrical detection of biomolecules using nanopores. Demonstrated here is the electrical measurement of nanopore based biosensing performed simultaneously and in-sync with optical detection of analytes. This method makes it possible, for the first time, to visualize DNA and DNA-protein complexes translocating through a nanopore with high temporal resolution (1000 frames∕s) and good signal to background. This paper describes a detailed experimental design of custom optics and data acquisition hardware to achieve simultaneous high resolution electrical and optical measurements on labeled biomolecules as they traverse through a ∼4 nm synthetic pore. In conclusion, we discuss new directions and measurements, which this technique opens up.
INTRODUCTION
Nanometer-scale pores fabricated in ultrathin solid-state membranes have recently been used for the high-throughput label-free detection of individual biomolecules.1, 2, 3, 4 The nanopore method uses the native electrical charge of nucleic acids or polypeptides present in an electrolyte solution to capture and slide the biopolymers through these pores. As this occurs it removes a portion of the solvent molecules present in the pore, giving rise to a time-dependent ionic current signal, which provides information on the biopolymers’ dynamics,5, 6, 7 length,8, 9 secondary structure,10, 11 and possible interactions with other biomolecules.12, 13, 14 One of the prominent features of the nanopore method is that both short and relatively long biopolymers can be readily analyzed, making it an extremely versatile tool with broad applications in biotechnology and analytical biochemistry. One particular application of note is the development of the “next-generation” single-molecule DNA sequencing methods.15, 16, 17, 18
Solely probing the ionic current flowing through nanopores, while proven to be highly useful, has a number of clear shortcomings. First and foremost, it provides temporal information rather than positional information on the process or the biomolecule under study. Second, the resolution at which close-by side-groups can be detected, for example, neighboring nucleotides along a strand of DNA, is limited. This limitation is partially determined by the effective membrane thickness, typically of the order of ∼15 nm19 [corresponding to ∼50 basepairs on double-stranded DNA (dsDNA)]. Finally, numerous potential applications for nanopores, such as DNA sequencing, rely on high-throughput detection, which would involve the simultaneous probing of hundreds or even thousands of individual nanopores. However, the ability to individually address the ion current flowing through thousands of these pores on a tiny silicon membrane remains to be a challenging feat.
To address these limitations, a number of ideas have been proposed, which supplement electrical measurements with other techniques, such as transverse electron tunneling20, 21 or nanopore electrical capacitance fluctuations.22, 23 Here we present a method that complements electrical measurements with high-sensitivity wide-field optical detection. Our method involves a customized total internal reflection fluorescence (TIRF) excitation, which permits low-background fluorescence probing on a nanometer-thin SiN membrane immersed between two aqueous solutions. This design allows us to simultaneously detect fluorescence of individual fluorophores and electrical signals from the nanopore during translocation of biomolecules through the nanopore. This technique can be straightforwardly used with fluorescence resonance energy transfer (FRET) tags,24 providing positional information on molecules threaded in the pore. The wide-field optical detection has the inherent advantage of allowing numerous pores to be probed simultaneously, significantly enhancing the method’s throughput. Additionally, the optical detection open up the possibility of tagging biopolymers with multicolor fluorescent markers, which can be programmed to report on the DNA sequence.17 Thus the method is applicable for emerging nanopore sequencing approaches. We demonstrate the feasibility of our system by optically probing labeled dsDNA and DNA-protein complexes inside a ∼4 nm pore.
GENERATING EVANESCENT EXCITATION ON THIN SOLID-STATE MEMBRANES
TIR is one of the commonly used methods for producing local electromagnetic (EM) fields, which excite fluorophores close to a refractive index matched interface.25 In this method, excitation light propagating from higher refractive index medium to a lower refractive index medium, when incident at angles higher the critical angle, becomes totally internally reflected at the interface. Since the EM wave does not propagate into the liquid, only molecules near the interface are excited, significantly reducing the fluorescence background. Additionally, the amount of scattered light in the liquid medium is minimized, further reducing the background. These features make TIR illumination ideal for single-molecule spectroscopy. Although confocal imaging has been used to image stained λ-phage DNA molecules in ∼250 nm channels,26 using TIR illumination removes material restrictions for opaqueness and permits a higher signal∕background detection. Moreover, since large surfaces can be excited using TIR, a wide-field imaging device can be used for parallel imaging of many molecules simultaneously. To integrate TIR microscopy with nanopore measurements, we generated an evanescent field at the SiN membrane separating the cis from the trans fluid chambers. The refractive index change at the SiN interface of the cis (n=1.33) and trans (n=1.41) buffers is selected to achieve total internal reflection of excitation laser light when incident at critical angle. We found that despite the relatively large index of refraction of silicon-nitride (SiN) (n∼2.06),27 TIR excitation field can nevertheless be generated by immersing the 20–30 nm thick SiN film in between two fluids of appropriate dielectric properties. This constitutes a straightforward and general method for low-background detection of single molecules on solid-state surface immersed in between aqueous solutions.
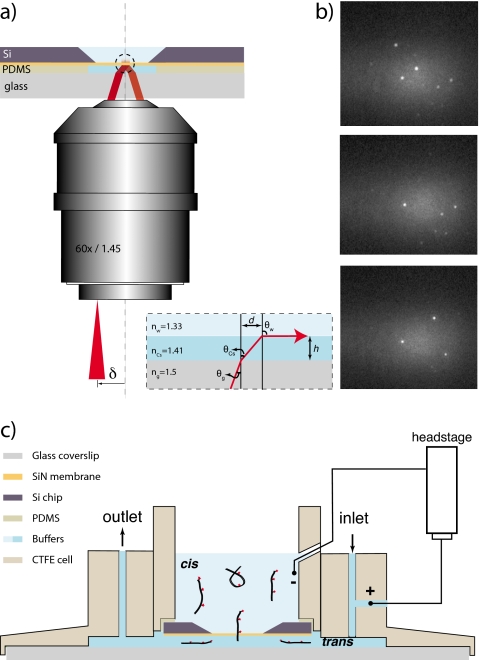
Our method is schematically depicted in Fig. 1a. A silicon chip containing a free-standing SiN membrane (20×20 μm2) is mounted ∼50 μm from a glass coverslip on a custom made chlorotrifluoroethylene (CTFE polymer material) flow cell, creating a micro fluidic trans chamber [see Fig. 1c]. The cell consists of two main parts: an insert holding the silicon chip and an outer cell used to form the fluidic chambers. Thin layers of fast curing polydimethlysiloxane (PDMS) are used to bond the silicon chip (with a nanopore drilled into the free-standing silicon-nitride membrane19) to the CTFE insert and a No. 1 glass coverslip to the outer cell. The fluid chamber with sample solution in the insert is termed the cis chamber. The space between the silicon chip and the glass coverslip (trans chamber) is filled with the refractive index matched CsCl buffer (see text below) using the inlet-outlet flow channels. For electrical measurements, a side opening in this flow channel is used to insert the trans electrode, and the cis electrode is immersed into the buffer in the insert (both Ag∕AgCl). The central through opening in the sample cell is used for mounting on an inverted microscope for optical visualization and measurements.
Figure 1.
(a) Schematic illustration (not to scale) of the TIR method for illumination of a thin solid membrane (orange) immersed between two aqueous fluids (light blue). Corresponding indices of refraction are indicated as nCs and nW. The system is designed such that TIR occurs at the SiN surface, enabling single-molecule detection. Inset shows ray path of an arbitrary ray incident at the glass-CsCl interface. θg, θCs, and θw are the ray angles at different interfaces, and d is the shift in the center of field of view caused due to in the intermediate CsCl column of height h. (b) Images of the SiN membrane where individual DNA molecules conjugated to single ATTO647N fluorophores are immobilized. (c) A schematic illustration of the flow cell. Outer cell and the inset are made from CTFE. Thin layers of fast curing PDMS are used to glue the silicon chip and the glass coverslip to the insert and outer cell, respectively. Inlet and outlet flow channels are used to transfer fluid in the trans chamber. Ionic current through the nanopore is measured using two Ag∕AgCl electrodes immersed in the cis and trans chambers as shown.
The refractive indices of the buffer used in the cis chamber, nw≈1.33, (water buffer, 1M KCl and 10 mM tris, pH of 8.5) and trans chamber (aqueous buffer solution of high index of refraction nCs) are smaller than the glass index of refraction ng=1.5 (nw<nCs<ng). A parallel beam of light is introduced from the glass coverslip side at an angle θg smaller than the critical angle of reflection of the glass∕trans chamber interface but slightly larger than the trans∕cis critical angle creates a TIR excitation at the SiN membrane [see inset of Fig. 1a]. We note that the in-plane location of the TIR excitation region is displaced by a distance d=h tan(θCs), where h is the height of the trans chamber. In this study we used a salt buffer solution containing 7M CsCl and 10 mM tris, pH of 8.5 (“Cs7M,” n=1.41), which satisfied the conditions described above. A high numerical aperture (NA) objective (Olympus 60×∕1.45) was used to achieve TIR by focusing the incident laser beam to an off-axis point at its back focal plane (δ), thus controlling the angle of incidence θg. An electron multiplying charged coupled device (EMCCD) camera (Andor, iXon DU-860) was used to record fluorescence images from the membrane surface. As the incident angle is increased, the critical angle for TIR is indicated by (1) the abrupt disappearance of the laser light observed from the cis side of the membrane, (2) the appearance of the displaced TIR laser beam, visualized at the back focal plane of the objective lens using the microscopes’ eyepiece, and (3) a sudden decrease in the background intensity, which increases the signal to background for single-molecule imaging (see Fig. S2 in the supporting information).28 In our setup, we observe a ≥2-fold increase in signal to background in images of single fluorophores immobilized the SiN membrane when imaged under two-fluid TIR illumination as compared with epi-illumination. For our nanopore experiments, the incident laser beam width is shaped using a long focal length achromatic doublet lens (200 mm) such that the illuminated area on the SiN membrane is ∼10×20 μm2.
To validate the performance of our optical setup, a 640 nm laser (20 mW) (iFlex2000, Point-Source, Hamble, UK) was coupled to the system through a single-mode polarization-preserving optical fiber, producing a collimated Gaussian laser beam with a diameter of 0.7 mm. This high-quality beam was necessary to ensure a tightly focused spot at the objective entrance, thus minimizing undesired scattering. The cis side of the SiN surface was coated with streptavidin using common procedures.29 Short biotinylated DNA oligos, each labeled with a single ATTO647N fluorophore, were immobilized on the surface and imaged by projecting the fluorescence light onto an electron multiplying CCD camera, working at maximum EM gain and 10 ms integration. Figure 1b displays three typical images of single molecules immobilized on the SiN surface, as imaged under TIRF. As can be clearly seen, single fluorophores are readily resolved with high contrast, requiring no further image processing. The fluorescence spots displayed discrete photo bleaching step as expected from single molecules.
SYNCHRONIZATION OF OPTICAL AND ELECTRICAL DATA ACQUISITION
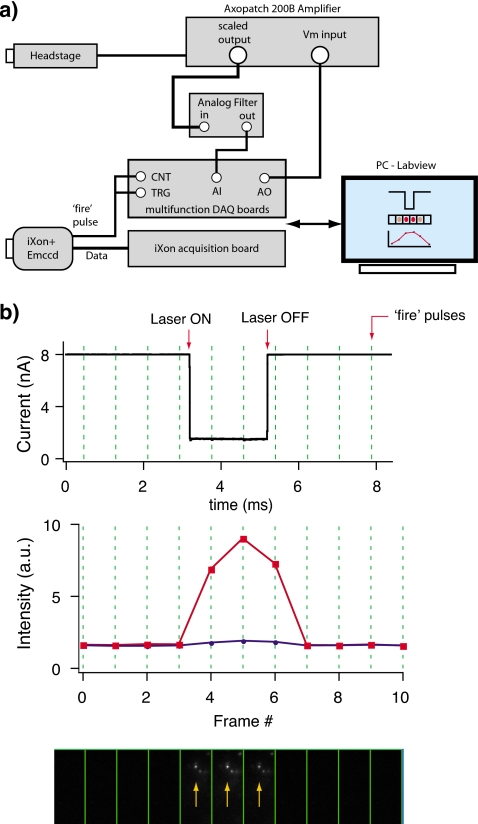
For synchronous detection of the optical and electrical signals in the nanopore experiment, a combination of hardware and custom LABVIEW software was designed. Figure 2a describes schematically our acquisition hardware. Axopath 200B amplifier (Molecular Devices, Inc., Sunnyvale, CA, USA) connected to the Ag∕AgCl electrodes was used to record ion current across the nanopore. The electrical signals were low pass-filtered at 50 KHz using an external four-pole Butterworth filter as previously described.2 For synchronization of electrical and optical signals, multifunction data acquisition DAQ board (National Instruments, PCI-6154) is used to acquire ion-current signal at 16 bit analog to digital conversion resolution. The “fire” pulse (a TTL pulse marking the beginning of each exposure) from the EM-CCD camera triggers the ion-current acquisition and is used to produce accurate time stamps on a counter board (National Instruments, PCI-6602). The counter board is internally synchronized to the DAQ board using the RTSI bus with a clock rate of 250 KHz. This way, the combined data stream includes a unique time stamp at the beginning of each of the CCD frames, which were synchronized with the ion-current sampling. When a translocation event is detected through a drop in the ion current, the software searches for the corresponding frame number in the counter information and saves the actual images corresponding to this number. Typically the camera frame rate was set to 1 KHz (fire pulse rate).
Figure 2.
(a) A block diagram depicting the hardware setup for synchronizing the EM-CCD data stream with the A∕D sampling of the ion-current signal. Headstage of Axopatch 200B amplifier measures ionic current, whereas the EM-CCD camera records images. Both measurements are synchronized by using the fire pulse to trigger start both current and image acquisition (see text). (b) Synchronization test of the electrical and optical signals. Top panel shows the current acquisition of a current pulse from a function generator, coupled to the Axon 200B headstage, which simulates an “event.” The same pulse is used to switch ON∕OFF the excitation laser (arrows). Synchronization is achieved by recording accurate time stamps using a DAQ board, generated by the EM-CCD fire pulses at 1 KHz rate (marked by vertical dotted lines). To test the system fluorescent beads were immobilized on the SiN membrane. A typical set of images during an event (bottom panel) and the extracted intensity at the bead position (red, squares) and at a background spot (blue, circles) are shown. The arrows in the bottom panel indicate the bead used for this analysis.
Synchronization of electrical and optical signals of our setup was extensively tested by electrically coupling millisecond long electrical pulses to the amplifier headstage generated by a function generator [Fig. 2b]. These current pulses are similar in shape and timescale of real nanopore signals. The excitation laser was modulated ON∕OFF using the same signal, providing a synchronous source of light and electrical pulses. For the synchronization tests, fluorescent beads were immobilized on the SiN membrane and imaged using our camera as explained above. Thousands of electrical∕optical events were acquired this way over a time period of 4–6 h to determine the robustness of our system. This confirmed that over extended periods of time, there is no loss of synchronization between acquisition of electrical signal from Axon amplifier and image frames from the EM-CCD camera. The only error in the synchronization will be the electronic jitter, which is <10 μs.
LOCALIZING NANOPORE POSITION
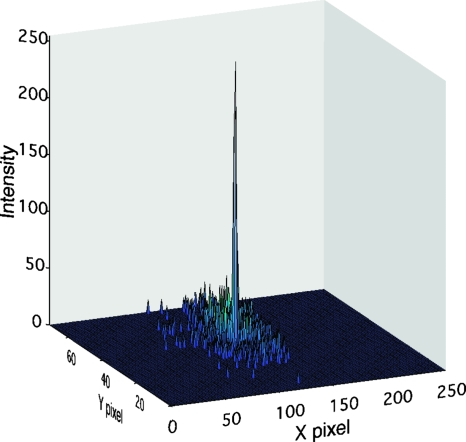
Having demonstrated single-molecule resolution in fluorescence, we combined the two modalities to measure synchronous optical and electrical signals during DNA translocation through a nanopore. To achieve this goal the pore location on the SiN membrane must first be identified in the images. We took advantage of the fact that the background fluorescent spots (i.e., from molecules colliding with the SiN membrane) are, on average, random in position and time. However fluorescence signal from the pore is stationary in position and lights up in-sync with the electrical signal. Thus the pixel corresponding to the pore location will, over time, accumulate the highest fluorescence intensity. A simple summation of all images in given experiment reveals a clear peak (Fig. 3). This peak corresponds to the pore position on the CCD. Once the pore location is identified, intensities from the pixel corresponding to the pore are used for further data analysis.
Figure 3.
Accumulated image (sum intensity of all frames) is analyzed for maximum intensity pixel. The pore pixel clearly seen as a prominent peak when compared to all other pixels (these pixels may light up due to random collision of labeled sample with SiN membrane).
OPTICAL VISUALIZATION OF DNA TRANSLOCATION THROUGH A SOLID-STATE NANOPORE
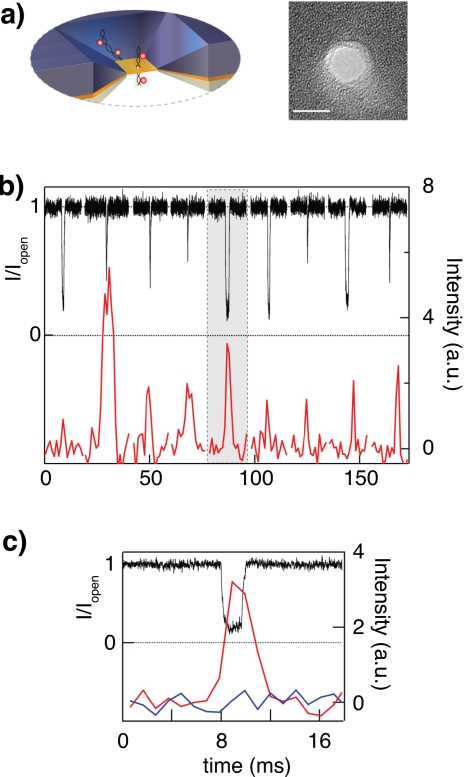
We performed simultaneous optical and electrical measurements to detect fluorophore-labeled dsDNA translocating through a 4 nm pore. Sample concentrations in these experiments were 0.1nM–0.2nM. Figure 4a shows schematically the experimental geometry, and a TEM image of a typical ∼4 nm pore. In this experiment we used a 421 bp fragment (DNA-Al647), labeled with Alexa647 fluorophores, by incorporation of low concentrations of amine-modified thymine bases during polymerase chain reaction (PCR) reaction, followed by conjugation with the amine-reactive dye (see supporting information).28 In Fig. 4b, we display nine representative ion current and their corresponding fluorescence intensity events (black and red curves respectively) after the DNA-Al647 molecules were added to cis side of the pore (200 mV bias generating an open pore current of 4 nA; images were acquired at 1 ms integration with maximum EM gain). The nanopore location was determined as explained above. The fluorescence intensity shown is extracted from a 3×3 pixel area on the CCD centered at the nanopore. It is important to note that synchronous acquisition of current and optical data helps us to define an internal background threshold for every event. Intensity at pore location ∼5 ms before the electrical event is used as background value for that event. Only optical events in which the intensity at the pore position is at least one standard deviation higher than its corresponding background are included in our analysis. This ensures that every event has a meaningful background threshold eliminating spurious signals. In Fig. 4c we display a close-up view of an event [highlighted in Fig. 4b] displaying also the fluorescence trace of a background spot in blue. Note that the background spot traces obtained from a nearby, randomly chosen, location does not show any correlated changes in intensity during the translocation event.
Figure 4.
Synchronous electrical and optical signals from DNA molecules during translocation through a 4 nm solid-state nanopore. (a) Schematic illustration of labeled dsDNA molecules threaded through a 4 nm nanopore (TEM image displayed on right panel). (b) A typical set of translocation events of 421 bp PCR segment, each labeled randomly with ∼5 Alexa647 dyes. Normalized current blockades (black lines) and fluorescence intensity measured at the pore position (red lines, background corrected) are overlaid. Events are spaced 20 ms for display purposes. (c) A magnified view of the highlighted event (gray background in panel b), also displaying the fluorescence background (blue line, measured on a pixel ∼3 μm away from the nanopore).
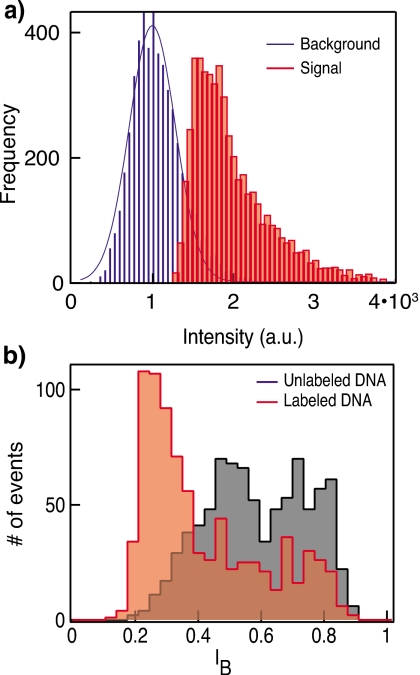
The clear correlation between the photon bursts and the ion-current blockades, shown in Fig. 4b, was further analyzed by obtaining statistics of ∼800 individual DNA molecules [Fig. 5a]. An intensity count distribution in the images acquired in the 3×3 pixel area centered at the nanopore location is shown in red, and a similar analysis performed at a background location (also 3×3 pixel area) roughly ∼3 μm away from the pore is shown in blue. Since our sample is labeled with multiple fluorophores, intensity collected from individual DNA molecules translocating through the nanopore may reflect the population heterogeneity of the sample. Heterogeneous population intensities are reflected in our data, as seen by the broad intensity distribution with multiple peaks. The background location [blue histogram in Fig. 5a] displayed a markedly different photon distribution and is well-approximated by a single Gaussian, as expected for a random noise source. Previous studies30 showed that the intensity of a population of fluorescently tagged molecules, where each molecule is labeled with “n” fluorophores, is a smooth long-tailed distribution. It is therefore interesting to note that our data reflect a multipeak intensity distribution. There are possibilities that multipeak intensity reflects differently labeled molecules interacting with the pore or that the heterogeneity is dependent on the position∕orientation of fluorophores during translocation.
Figure 5.
(a) Optical detection and (b) electrical detection distributions measured using labeled (red, filled rectangles) and unlabeled (black) DNA translocations. The distributions of synchronous optical measurements of DNA-AL647 translocations showing multiple populations. Histogram shows intensity in images at a 3×3 pixel area centered at nanopore and at a randomly chosen background position (blue, lines). Optical intensities are baseline corrected for the EM-CCD readout noise.
Simultaneous detection of the optical signals and the electrical current provides synergistic and independent information of the same molecule during its translocation through the pore. To illustrate this we display in Fig. 5b, a comparison of the normalized current blockade (IB=Ib∕Io) for the 421 bp labeled (red) and control unlabeled DNA (black). The current blockade histograms display two major peaks for the labeled and unlabeled molecules: (a) a common peak at IB∼0.8 and (b) lower peaks with IB∼0.5 or IB∼0.25 for the unlabeled or labeled molecules, respectively. The appearance of two blockade peaks is in agreement with previously published results, attributing the characteristic high IB peak values to DNA molecules colliding but not translocating through the pore and the lower IB values to full translocation events.9 Interestingly the coupling of the Alexa dyes to the DNA results in a shift in the translocation peak IB to much lower values. IB values are highly sensitive to the molecular cross section traversing the pore;14 hence the increase in the molecular cross section of DNA due to addition of multiple fluorophores is likely responsible for the observed shift in the blockade distributions. Evidently, the ion-current signal is not as sensitive to the number of fluorophores attached to each DNA molecule, as the optical sensing signal displays multiple populations.
OPTICAL DETECTION OF PROTEIN-DNA COMPLEXES THROUGH A NANOPORE
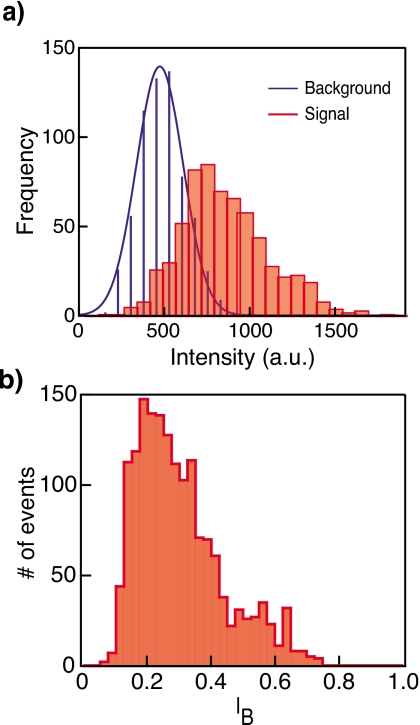
To further generalize our measurement approach, we show optical detection of protein-DNA complexes through a nanopore. As a model system we used the protein, avidin, bound to biotinylated dsDNA with a single stranded overhang. Our sample contains a shorter 5′ biotinylated single-stranded DNA (ssDNA) (16 or 50 bases) strand hybridized to longer ssDNA template strand (62 or 96 bases). Biotin on the shorter strand is complexed with avidin, which is later labeled. In this experiment one site is used to connect the protein to the DNA, and the other three are populated with labeled biotins. We estimate an average two to three fluorophores per DNA-avidin complex. To prepare this sample, a 96 base ssDNA was first hybridized to 50 base 5′ biotinylated complementary ssDNA using standard protocols. After hybridization, the DNA molecule was mixed with avidin at a molar ratio that yields one DNA molecule per avidin (see supplementary information). The avidin-DNA complex was mixed with fluorescently labeled biotin molecules (ATTO647N). The labeled protein-DNA complexes were then added to the cis chamber, and simultaneous optical and electrical events were recorded. There is a possibility that DNA-avidin complexes enter the pore from the double-stranded end. These events result in very long (>300 ms) blockades, which are automatically identified by the acquisition program and are quickly cleared by applying a reverse voltage pulse, as previously described.2 Data were acquired at an applied potential of 150 mV and frame rate of 333 Hz. Figure 6 shows distributions of optical (top) and electrical (bottom) signals from hundreds of events similar to the one shown in Fig. 5. The intensity distributions of the translocation events at the pore are shown in red, and the intensity measured at the background location is shown in blue. Similar to the case of multilabeled DNA sample, intensity count statistics at the pore shows the characteristic multipeak histogram, possibly reflecting that the avidin-DNA complexes comprise of a population with one to three dye labels (events showing no fluorescence were excluded from this analysis). The blockade current distribution shown in Fig. 6b displays a peak at IB≈0.2, as expected for the 3.5 nm pore used in this study (the collision peak was removed selecting only long events).
Figure 6.
Inset: schematic of avidin-DNA complex traversing a ∼3 nm solid-state pore. Top panel (a) displays intensity count distributions extracted from single complex translocation events at the pore location (red, filled rectangles) and at the background (blue, lines) location. Optical intensities are baseline corrected for the EM-CCD readout noise. The bottom panel (b) displays the normalized ion-current blockade distribution for the events shown in (a).
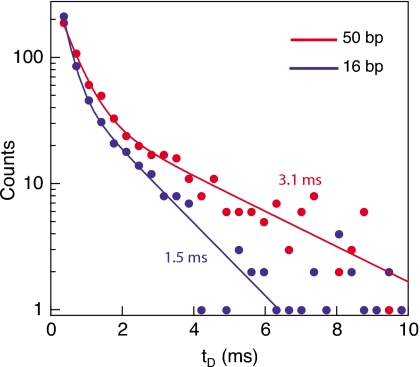
While the ssDNA overhang can be readily threaded through the 3 nm pore, we hypothesize that the bulkier avidin molecule (∼5 nm diameter31) plus the DNA duplex (∼2 nm) form a 6–7 nm wide complex that cannot enter the pore. Therefore after threading of the ssDNA region into the pore, the duplex region can either be unzipped or “squeezed” through the pore. Due to the applied potential at the pore, retraction of molecule against the electrical force is of low likelihood. To test which of these two options is valid, we performed two measurements using the same nanopore comparing the electrical dwell time distributions of two molecules with varying duplex lengths, a 16 bp duplex, or a 50 bp duplex region, with identical ssDNA overhang (blue and red traces in Fig. 7, respectively). In this configuration, both “squeezing” and “retraction” are expected to be independent of the length of duplex region (the translocation time of a ∼50 bp duplex is ∼10 μs—two orders of magnitude shorter than the characteristic times we measure in this experiment9), whereas timescales of unzipping is expected to significantly increase with the length of duplex region. Both distributions are fitted by double-exponential functions, where the shorter timescale corresponds to molecular collisions with nanopore. Focusing on the longer timescale, our data show a ∼2 fold increase when comparing the 16 bp duplex to the 50 bp duplexes (1.5 and 3.1 ms, respectively). This trend is in agreement with our previous studies using smaller nanopores32 and suggests that under our experimental conditions, electrical force on protein-DNA complex, at the nanopore result in unzipping of the duplex region of the DNA.
Figure 7.
Dwell time distributions (measured from the electrical signals) of the avidin-DNA complex with a 50 bp duplex region (red, top curve) or a 16 bp duplex region (blue, bottom curve). Lines represent double-exponential fits to the histograms. We observe a twofold increase in the longer timescale for the 50 bp duplex as compared with the 16 bp duplex (3.1±0.3 and 1.5±0.1 ms, respectively).
DISCUSSION AND CONCLUSIONS
In this paper, we present a novel method to complement the ion-current measurements in nanopore based sensing with simultaneous optical detection. Our method entails a customized TIR illumination, which enable us to excite and image molecules threaded through a nanoscale pore sandwiched between two fluids. When the system is equipped with a synchronous electrical∕optical hardware, it permits the detection of the changes in the ionic current as well as the fluorescence signal emitted by the labeled biomolecules, simultaneously. We apply our method to two systems: (1) fluorescently labeled dsDNA and (2) labeled DNA-protein complexes. In both systems we have used a small number of fluorophores per biomolecule (typically one to five) to illustrate its sensitivity and temporal resolution. The main advantage of the additional optical detection lies in the fact that it adds a completely independent measurement coordinate to the system.
Future applications for this tandem method are extremely broad, giving way to a higher level of detail and understanding to the biomolecular processes under consideration. For example, a multicolor extension of our system can be readily constructed and used for detecting multiple species on the same DNA molecule or the detection of FRET. This opens up the nanopore field for screening for cooperative as well as differential binding of multiple DNA binding moieties. Multicolor measurements also enrich attempts toward realizing nanopore based genome sequencing, especially when combined with the wide-field imaging capabilities, which permit simultaneous signal probing from multiple nanopores.17
In summary, we show for the first time single-molecule optical visualization of labeled DNA and DNA-protein complexes translocating through ∼4 nm synthetic pores, with a temporal resolution of ∼1 ms. We show that we can easily localize the pore on membrane with good signal to noise and extract intensity traces of single DNA translocation events. Intensity distributions of these events showed multiple levels of fluorescence intensities corresponding to the varying degree of labeling. We believe that the optical modality of measurement in nanopore experiments will have far reaching consequences on developing applications such as high-throughput screening and DNA sequencing.
ACKNOWLEDGMENTS
A.M. acknowledges financial support from NIH under Award No. HG004128 and NSF under Award No. PHY-0646637.
References
- Howorka S. and Siwy Z., Chem. Soc. Rev. 38, 2360 (2009). 10.1039/b813796j [DOI] [PubMed] [Google Scholar]
- Wanunu M. and Meller A., in Laboratory Manual on Single Molecules, edited by Selvin P. and Ha T. (Cold Spring Harbor Press, Cold Spring Harbor, NY, 2008), pp. 395–420. [Google Scholar]
- Dekker C., Nat. Nanotechnol. 2, 209 (2007). 10.1038/nnano.2007.27 [DOI] [PubMed] [Google Scholar]
- Healy K., Schiedt B., and Morrison A. P., Nanomedicine 2, 875 (2007). 10.2217/17435889.2.6.875 [DOI] [PubMed] [Google Scholar]
- Meller A., Nivon L., and Branton D., Phys. Rev. Lett. 86, 3435 (2001). 10.1103/PhysRevLett.86.3435 [DOI] [PubMed] [Google Scholar]
- Meller A., J. Phys.: Condens. Matter 15, R581 (2003). 10.1088/0953-8984/15/17/202 [DOI] [Google Scholar]
- Fologea D., Uplinger J., Thomas B., McNabb D. S., and Li J. L., Nano Lett. 5, 1734 (2005). 10.1021/nl051063o [DOI] [PMC free article] [PubMed] [Google Scholar]
- Storm A. J., Chen J. H., Zandbergen H. W., and Dekker C., Phys. Rev. E 71, 051903 (2005). 10.1103/PhysRevE.71.051903 [DOI] [PubMed] [Google Scholar]
- Wanunu M., Sutin J., McNally B., Chow A., and Meller A., Biophys. J. 95, 4716 (2008). 10.1529/biophysj.108.140475 [DOI] [PMC free article] [PubMed] [Google Scholar]
- Akeson M., Branton D., Kasianowicz J. J., Brandin E., and Deamer D. W., Biophys. J. 77, 3227 (1999). 10.1016/S0006-3495(99)77153-5 [DOI] [PMC free article] [PubMed] [Google Scholar]
- Meller A., Nivon L., Brandin E., Golovchenko J., and Branton D., Proc. Natl. Acad. Sci. U.S.A. 97, 1079 (2000). 10.1073/pnas.97.3.1079 [DOI] [PMC free article] [PubMed] [Google Scholar]
- Hornblower B., Coombs A., Whitaker R. D., Kolomeisky A., Picone S. J., Meller A., and Akeson M., Nat. Methods 4, 315 (2007). [DOI] [PubMed] [Google Scholar]
- Fologea D., Ledden B., McNabb D. S., and Li J., Appl. Phys. Lett. 91, 053901 (2007). 10.1063/1.2767206 [DOI] [PMC free article] [PubMed] [Google Scholar]
- Wanunu M., Sutin J., and Meller A., Nano Lett. 9, 3498 (2009). 10.1021/nl901691v [DOI] [PMC free article] [PubMed] [Google Scholar]
- Branton D., Deamer D. W., Marziali A., Bayley H., Benner S. A., Butler T., Di Ventra M., Garaj S., Hibbs A., Huang X., Jovanovich S. B., Krstic P. S., Lindsay S., Ling X. S., Mastrangelo C. H., Meller A., Oliver J. S., Pershin Y. V., Ramsey J. M., Riehn R., Soni G. V., Tabard-Cossa V., Wanunu M., Wiggin M., and Schloss J. A., Nat. Biotechnol. 26, 1146 (2008). 10.1038/nbt.1495 [DOI] [PMC free article] [PubMed] [Google Scholar]
- Zwolak M. and Di Ventra M., Rev. Mod. Phys. 80, 141 (2008). 10.1103/RevModPhys.80.141 [DOI] [Google Scholar]
- Soni G. V. and Meller A., Clin. Chem. 53, 1996 (2007). 10.1373/clinchem.2007.091231 [DOI] [PubMed] [Google Scholar]
- Lee J. W. and Meller A., in Perspectives in Bioanalysis, edited by Mitchelson K. (Elsevier, Amsterdam, 2007), Vol. 2, pp. 245–264. [Google Scholar]
- Kim M. J., Wanunu M., Bell D. C., and Meller A., Adv. Mater. (Weinheim, Ger.) 18, 3149 (2006). 10.1002/adma.200601191 [DOI] [Google Scholar]
- Lagerqvist J., Zwolak M., and Di Ventra M., Nano Lett. 6, 779 (2006). 10.1021/nl0601076 [DOI] [PMC free article] [PubMed] [Google Scholar]
- Gierhart B. C., Flowitt D. G., Chen S. J., Zhu Z., Kotecki D. E., Smith R. L., and Collins S. D., Sens. Actuators B 132, 593 (2008). 10.1016/j.snb.2007.11.054 [DOI] [PMC free article] [PubMed] [Google Scholar]
- Gracheva M. E., Xiong A. L., Aksimentiev A., Schulten K., Timp G., and Leburton J. P., Nanotechnology 17, 622 (2006). 10.1088/0957-4484/17/3/002 [DOI] [Google Scholar]
- Sigalov G., Comer J., Timp G., and Aksimentiev A., Nano Lett. 8, 56 (2008). 10.1021/nl071890k [DOI] [PMC free article] [PubMed] [Google Scholar]
- Joo C. and Ha T., in Laboratory Manual on Single Molecules, edited by Selvin P. and Ha T. (Cold Spring Harbor Press, Cold Spring Harbor, NY, 2008), pp. 3–36. [Google Scholar]
- Axelrod D., Traffic (Oxford, U. K.) 2, 764 (2001). 10.1034/j.1600-0854.2001.21104.x [DOI] [PubMed] [Google Scholar]
- Chansin G. A. T., Mulero R., Hong J., Kim M. J., Demello A. J., and Edel J. B., Nano Lett. 7, 2901 (2007). 10.1021/nl071855d [DOI] [PubMed] [Google Scholar]
- Andersen K. N., Svendsen W. E., Stimpel-Lindner T., Sulima T., and Baumgärtner H., Appl. Surf. Sci. 243, 401 (2005). 10.1016/j.apsusc.2004.09.096 [DOI] [Google Scholar]
- See supplementary material at http://dx.doi.org/10.1063/1.3277116 for the description of sample preparation.
- Sabanayagam C. R., Eid J. S., and Meller A., Appl. Phys. Lett. 84, 1216 (2004). 10.1063/1.1646725 [DOI] [Google Scholar]
- Mutch S. A., Fujimoto B. S., Kuyper C. L., Kuo J. S., Bajjalieh S. M., and Chiu D. T., Biophys. J. 92, 2926 (2007). 10.1529/biophysj.106.101428 [DOI] [PMC free article] [PubMed] [Google Scholar]
- Pugliese L., Coda A., Malcovati M., and Bolognesi M., J. Mol. Biol. 231, 698 (1993). 10.1006/jmbi.1993.1321 [DOI] [PubMed] [Google Scholar]
- McNally B., Wanunu M., and Meller A., Nano Lett. 8, 3418 (2008). 10.1021/nl802218f [DOI] [PMC free article] [PubMed] [Google Scholar]


