

Summary
Objective
To examine the radial variation in mechanical and biochemical properties of engineered cartilage by examining the annulus and the central core of the constructs separately.
Method
Chondrocyte-seeded agarose hydrogels were grown in free-swelling and dynamic loading cultures for 42 days. Deformational loading (in unconfined compression) was performed biweekly. After testing, the constructs were allowed to recover for 1-2 hours, the central 3-mm cores removed, and the cores and annuli were retested separately. Histological and/or biochemical analyses for GAG, collagen, type I collagen, type II collagen, and elastin were performed. Multiple regression analysis was used to determine the correlation between the biochemical and material properties of the constructs.
Results
The cores and annuli of chondrocyte-seeded constructs did not exhibit significant differences in material properties and GAG content. Annuli possessed greater DNA and collagen content than cores. Dynamic loading enhanced the material properties and GAG content relative to free-swelling controls, but it did not alter the radial variations compared to free-swelling culture.
Conclusion
Dynamic loading did not result in radial variations as measured through the coring technique utilized in this study. Nutrient transport limitations and the formation of a fibrous capsule on the periphery may explain the differences in DNA and collagen between cores and annuli. No differences in GAG distribution may be due to sufficient chemical signals and building blocks for GAG synthesis throughout the constructs.
Keywords: Type I Collagen, Type II Collagen, Elastin, Glycosaminoglycans, Correlation Analysis
Introduction
One of the objectives of functional tissue engineering of articular cartilage is to engineer constructs whose mechanical properties mimic those of the native tissue. Since the primary mode of loading of articular joints under physiological conditions is dynamic compression, we have adopted an unconfined compression loading configuration in our cartilage bioreactors1, 2. In unconfined compression, an engineered cartilage disk is loaded between impermeable, smooth platens and is free to expand laterally (in the radial and circumferential directions). This loading configuration produces more uniform mechanical signals throughout a cylindrical cartilage sample than that of confined compression with a porous loading platen, which produces compaction at the tissue-platen interface. Additionally, unconfined compression produces both compressive strains (along the axial direction) and tensile strains (along the radial and circumferential directions), which better represents the physiologic loading environment as suggested by analyses of contacting cartilage layers3, 4. The uniformity of the interstitial fluid pressure through the depth of the sample, arising from compression, is also more physiologic4.
In this study, we follow up on our previous analysis of construct inhomogeneity through the thickness2, by investigating the development of construct properties in the radial direction. In addition to subjecting constructs to radial and circumferential tensile strains, unconfined compression loading between impermeable platens generates a pressure gradient where the fluid pressurization is highest in the central region and lowest at the radial edge, resulting in maximal fluid flow at the radial edge5-8. In the literature, several investigators have reported that dynamic loading of articular cartilage explants in unconfined compression preferentially stimulates chondrocyte biosynthetic activity at the periphery of cylindrical samples and have attributed this spatially-dependent biosynthesis to the higher fluid flow levels at the construct edge9-11. The influence of these radially-dependent stimuli, established by the unconfined compression loading configuration, on development of engineered cartilage constructs has not yet been investigated.
In the current study, we sought to determine if applied dynamic loading (loading for 3 h/day, free-swelling 21 h/day) can alter the radial inhomogeneity of constructs compared to free-swelling controls (24 h/day). Accordingly, we hypothesized that the radial inhomogeneity will be enhanced in loaded samples compared to free-swelling controls, due to the loading-enhanced fluid flow stimulation at the periphery. Our microscopy-based technique, previously used for investigating the inhomogeneity of material properties through the thickness of tissue constructs, is limited to samples of thickness much less than that of the radius of our constructs; consequently, an alternative testing methodology was developed for the current study2. Constructs cultured for 6 weeks under free-swelling or dynamic loading were mechanically tested whole as well as after concentric coring, to permit study of both the outer annulus and the 3-mm central core region on day 0, 28 and 42. Complementary biochemical properties and histological analyses were conducted for the core and the annular regions to permit study of the radial inhomogeneity of these parameters.
Materials and Methods
Primary chondrocytes were harvested from the carpometacarpal joints of 3 to 4 months old calves via 10 hour digestion in DMEM containing 5%FBS and 390 U/ml collagenase (Sigma Chemicals, St. Louis, MO) with mild agitation. Cells were encapsulated in 2% (w/v) low-melt agarose (Type VII, Sigma Chemicals) in PBS at 60×106 cells/ml and equilibrated for 3 days in DMEM containing 5%FBS. After this 3-day period (study day 0), disks, Ø5.0×2.3 mm, were cored and cultured in 100 mm Petri dishes (20 to 25 disks per plate) with 30 ml of DMEM (Mediatech, Herndon, VA) supplemented with buffers, antibiotics, antimycotics, amino acids, 20% fetal bovine serum (FBS; Atlanta Biochemical, Atlanta, GA) and 50 μg/ml ascorbic acid (Sigma Chemicals). Samples were maintained under sterile conditions and media were changed daily.
The constructs were either dynamically loaded, as described previously2, or maintained under free-swelling conditions through a 6-week culture period. Briefly, a custom loading device was utilized to impose a sinusoidal deformation with a magnitude of 10% peak-to-peak strain at a frequency of 1 Hz, above a 2% tare strain initially applied to the constructs. This loading regimen was carried out five days per week, with dynamic loading applied continuously for three hours each day. Custom agarose (type IB) templates with 8 mm diameter wells, cast into 60 mm Petri dishes (BD Falcon, Bedford, MA), were utilized to ensure that the agarose constructs were properly seated and to prevent construct shifting during dynamic unconfined compression loading or Petri dish transport. Prior to loading, the disks were transferred to the custom molds and dynamic loading was carried out in a volume of 5 ml DMEM. Free-swelling controls were also transferred to similar molds, containing 5 ml of DMEM, and maintained adjacent to the loading device during the loading. After loading, the disks were returned to 100 mm dishes, randomly flipped to reduce any orientation bias, and maintained as described above. Disks were removed for bulk mechanical testing on days 0, 14, 28, and 42. Following testing, the disks were processed for histology or stored at -30°C for biochemical analysis.
A custom unconfined compression device, with rigid-impermeable glass loading platens, was used to measure the equilibrium Young's modulus of the constructs12. Before each test, the disk thickness and diameter were measured, and the specimens were equilibrated in creep, under a tare load of 0.01 N. A stress-relaxation test was then performed, consisting of an applied ramp-and-hold displacement, with a ramp speed of 1 μm/s until the displacement reached 10% of the post-tare load thickness. Constructs were allowed to relax for 20 minutes, to reach an equilibrium value. Young's modulus (EY) was calculated from the equilibrium reaction force, the cross-sectional area of the sample, and the applied strain. Following stress relaxation test, a sinusoidal displacement of 40 μm amplitude was applied at 0.5 Hz and the unconfined dynamic modulus (G*) was similarly calculated from the load and displacement profiles, and the construct geometry. Each construct was tested whole, as described above, and then allowed to recover for 1 hour prior to coring with a 3 mm dermal punch mounted on a custom cutting rig, which was used to align and stabilize the constructs during coring. The annuli and central 3 mm cores were then tested separately. For half the samples, the annuli were tested first and for the other half the cores were tested first. Images of typical constructs, before and after coring, are presented in Figure 1.
Figure 1.
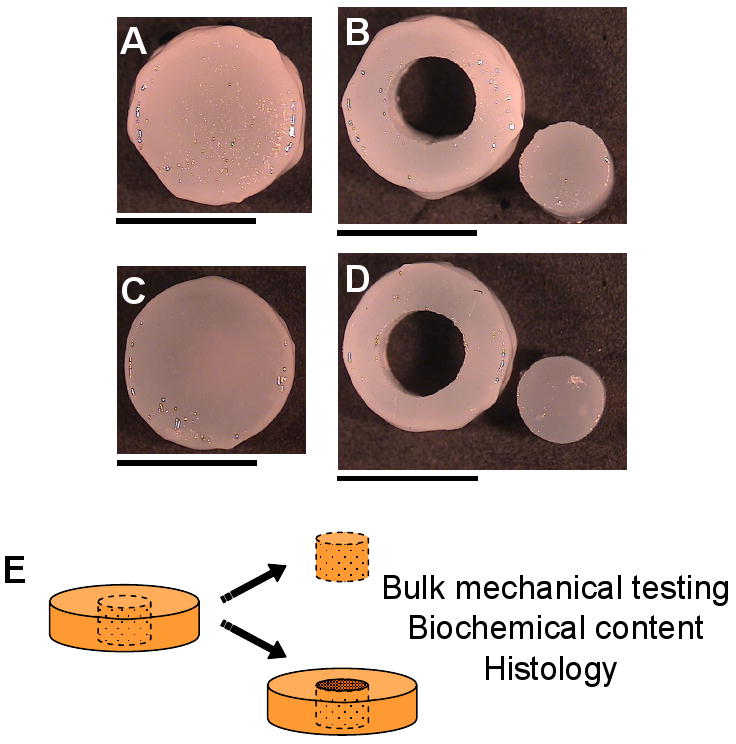
Images of free-swelling (A, B) and dynamically loaded (C, D) constructs were acquired at day 42, before (A, C) and after (B, D) coring of the constructs. Scale bars equal 5 mm. For this study, samples were tested whole, allowed to recover and then the annuli and cores were tested separately (E).
The samples for biochemical analyses were thawed, weighed wet, lyophilized, reweighed dry, and digested for 16 hours at 60°C in proteinase K (Fisher Scientific; in 50 mM Tris buffered saline containing 1 mM EDTA, 1 mM iodoacetamide and 10 μg/ml pepstatin A)13. The DNA content was quantified using the PicoGreen assay (Molecular Probes), adapted for use on a microtiter plate reader. Lambda phage DNA (0 to 1 μg/ml) was used as a standard14. The glycosaminoglycan (GAG) content was measured using the 1,9 dimethylmethylene blue (Sigma Chemicals) dye-binding assay that had been modified for use with microtiter plate reader. Shark chondroitin sulfate (0 to 50 μg/ml) was used as a standard15. The overall collagen content was measured using the orthohydroxyproline (OHP) colorimetric assay, adapted for use with microtiter plate reader16. Here, the digests were hydrolyzed by incubating with equal volume of 12 M HCl at 110°C for 18 hours, dried in the presence of sodium hydroxide, and resuspended in l ml of assay buffer prior to analysis. Bovine OHP (0 to 10 μg/ml) was used as a standard. Collagen content was calculated by assuming a 1 to 10 OHP-to-collagen mass ratio17. The collagen and GAG contents were normalized to the wet weight and DNA content of the constructs.
The samples for histological analysis were fixed in a 5% acetic acid, 3.7% formaldehyde and 70% ethanol solution18, serially dehydrated in ethanol, embedded in paraffin (Fisher Scientific), sectioned to 8 μm, and mounted onto microscope slides. The samples were then dewaxed, rehydrated, and stained with Safranin O (Sigma Chemical) and Picrosirius Red (Sigma Chemical) dyes to determine the distribution of GAG and collagen, respectively. For immunohistochemistry, sections were digested in 0.5 mg/ml of testicular hyaluronidase, swollen in 0.5M of acetic acid, blocked in 10% normal goat serum (NGS) and labeled with 10% NGS containing monoclonal primary antibody for types I collagen (MAB3391, Chemicon, Temecula, CA), type II collagen (II-II6B3, Developmental Studies Hybridoma Bank, Iowa City, IA), and elastin (BA-4, Sigma Chemical). Non-immune controls were incubated in 10% NGS alone. Alexa 488-conjugated goat anti-mouse secondary antibody labeling (Molecular Probes, Eugene, OR) and propidium iodide nuclear counterstaining (Molecular Probes) were performed to visualize the ECM and cells, respectively. After staining, the slides were coverslipped and sections were analyzed using an inverted microscope with an Olympus Fluoview confocal system (New York/New Jersey Scientific, Middlebush, NJ) with dual wavelengths excitation at 488 and 568 nm (20× objective lens).
Statistica (Statsoft, Tulsa, OK) was used to perform statistical analysis using multivariate ANOVA, with sample geometry (core, annulus, whole), time, and loading condition as the independent variables. Tukey HSD Post Hoc test was used to determine significant differences. p<0.05 was considered significant. Four samples were tested per group and results are presented as mean ± standard deviation. Statistica was also used to determine the correlation between the biochemical composition (GAG and collagen content) and the material properties (Young's and dynamic moduli) of the constructs. Pearson correlation analysis was performed to determine the Pearson product moment correlation coefficient (R) and significant differences (p<0.05).
Results
The changes in wet weight, dry weight, water content, and biochemical composition of the intact chondrocyte-seeded constructs are presented in Figure 2. The values and trends observed for these samples were similar to those previously reported by our group1, 2. Here, significant effect of time was observed all measures excepting the DNA content when normalized to the wet weight (ANOVA p<0.005; Tukey post hoc p<0.005), however there were no significant effect of loading. The wet weight and overall DNA content double over 6-week culture period, whereas the dry weight exhibited a 4-fold increase. When normalized to the wet weight, the DNA content of the free-swelling constructs remained constant through the 6-week culture period, however dynamically loaded constructs exhibited a 33% increase.
Figure 2.

Wet and dry weights (A), percent water (B), DNA content (C, D), and GAG and collagen contents (E, F) of intact free-swelling and dynamically loaded chondrocyte-seeded constructs. * represents significant differences versus day 0 constructs (ANOVA p<0.005; post hoc p<0.005).
The wet and dry weights (Figure 3A and Figure 3B, respectively) of the annuli and the cores were similar at day 0. Over time, these variables remained constant for 3-mm cores, however there was a significant temporal increase in the weights of the annuli by day 28 (ANOVA p<0.0005; Tukey post hoc p<0.0005) that parallel the trends observed for the whole constructs (compare Figure 2A to Figure 3A and Figure 3B). Additionally, the wet and dry weights of the annuli were significantly greater than the cores by day 14 for the wet weight (ANOVA p<0.005; Tukey post hoc p<0.005) and day 28 for the dry weight (ANOVA p<0.0005; Tukey post hoc p<0.0005). There was a significantly effect of load in the annuli at day 42 (ANOVA p<0.05; Tukey post hoc p<0.05). There was a resultant significant temporal decrease in the water content (Figure 3C) of the both the annuli and cores of the constructs (ANOVA p<0.005; Tukey post hoc p<0.005), however there were no significant inter-group differences. The changes in the DNA content (Figure 3D) over time was similar to those observed for the wet and dry weights. Here, the absolute DNA content of the core was 36% lower than the annuli on day 0 (Figure 3D), though no difference was found in the wet-weight normalized DNA content (Figure 3E). There was a 3-fold increased the absolute DNA content of the annulus, and 37% and 21% decrease in the absolute DNA content of the cores of the free-swelling and dynamic loading constructs, respectively, over time in culture. This decrease in the cores, however, was not statistically significant. There was a significant effect of time in the annuli of the constructs by day 28 (ANOVA p<0.005; Tukey post hoc p<0.05). Additionally, the DNA content of the annuli was significantly greater than the cores by day 28 for the dynamically loaded constructs and by day 14 for the free-swelling controls (ANOVA p<0.0005; Tukey post hoc p<0.01). When normalized to the wet weight, the DNA content (Figure 3E) of the free-swelling annuli and dynamically loaded cores showed a 10% reduction over the 6-week culture period, however there were no significant temporal changes. Here, the DNA content of the annuli was significantly greater than the cores by day 28 in the free-swelling constructs and by day 42 in the dynamically loaded constructs (ANOVA p<0.05; Tukey post hoc p<0.05).
Figure 3.

Wet weight (A), dry weight (B), percent water (C), and DNA content (D, E), of the annuli (open) and cores (closed) of free-swelling (boxes) and dynamically loaded (triangles) constructs over the 6-week culture period (n=4-9). Significant effect of time was observed for these samples (ANOVA p<0.05). * represents significant differences versus day 0 constructs (ANOVA p<0.05; post hoc p<0.05); † represents significant differences versus free-swelling controls (ANOVA p<0.01; post hoc p<0.05); § represents significant differences versus the respective cores (ANOVA p<0.001; post hoc p<0.05).
The GAG and collagen contents of these constructs increased over time for all groups (Figure 4), with significant changes occurring by day 14 (ANOVA p<0.0005; Tukey post hoc p<0.05). Significant differences in the GAG content with loading were observed at day 42 in the annuli and cores when the data was normalized to the wet weight (p<0.05), but only in the cores when data was normalized to the DNA content (p<0.05). Additionally, the annuli and cores were significantly different for the day 42 free-swelling constructs when the GAG content was normalized to the wet weight (p<0.05). By day 28, the GAG/DNA value was significantly greater in the cores than in the annuli (p<0.05). By day 14, the collagen content of the annuli of both free-swelling and dynamically loaded constructs was significantly greater than the corresponding cores (p<0.05). Additionally, the collagen/DNA value of the day 42 dynamically loaded core was significantly greater than the correspondent annulus and free-swelling sample (p<0.01).
Figure 4.

Wet GAG (A, B) and collagen (C, D) contents of the annuli (open) and cores (closed) of free-swelling (boxes) and dynamically loaded (triangles) constructs over the 6-week culture period (n=4-9). Significant effect of time was observed for these samples (ANOVA p<0.05). * represents significant differences versus day 0 constructs (ANOVA p<0.05; post hoc p<0.05); † represents significant differences versus free-swelling controls (ANOVA p<0.05; post hoc p<0.05); § represents significant differences versus the respective annular samples (ANOVA p<0.05; post hoc p<0.05).
The mechanical properties of all groups increased significantly over time in culture (Figure 5; p<0.008). There was a significant effect of loading on the Young's modulus by day 42 (Figure 5A; p<0.005). A significant decrease in Young's modulus (Figure 5A) was observed for the dynamically loaded core at day 14 (p<0.004). Additionally, there was a significant effect of loading on the dynamic modulus by day 28 for the whole constructs and the annuli and by day 42 for the cores (Figure 5 B, C, D; p<0.005). Similar results were obtained at other loading frequencies (data not shown). As the dynamic modulus is a structural property with fluid-flow dependence12, 19, this parameter would be affected by the differences in the geometry and boundary conditions between the cores, annuli, and whole disks. Therefore, comparisons between the three geometric configurations were not performed.
Figure 5.

Young's (A) and dynamic (B, C, D; measured at 0.5 Hz) moduli of free-swelling and dynamically loaded constructs over the 42-day culture period (n=7). The constructs were allowed to recover for 1 hour before the annulus and the 3 mm central core were tested. As the dynamic modulus is a structural property, inter-group comparisons between intact constructs (B), annuli (C), and cores (D) were not performed. *represents significant differences compared to day 0 (ANOVA p<0.005; Tukey p<0.003); ‡represents significant differences compared to corresponding free-swelling controls (ANOVA p<0.0005; Tukey p<0.005); †represents significant differences compared to whole sample (ANOVA p<0.0005; Tukey p<0.02); §represents significant differences compared to day 28 constructs (p<0.05).
Correlation analysis of the relationship between GAG and collagen content and the moduli of chondrocyte-seeded constructs are presented in Table 1. For the free-swelling constructs, there were no observed correlation between the material properties and the biochemical content. For the intact dynamically loaded constructs, significant positive correlation was observed between the GAG content and the Young's modulus and dynamic modulus, and between the collagen content and the dynamic modulus. These correlations were lost in the annulus of the constructs, but were maintained in the cores. Additionally, a significant positive correlation was observed between the collagen content and the Young's modulus for the dynamically loaded cores.
Table 1.
Pearson's correlation of the biochemical and material properties of the annuli chondrocyte-seeded agarose constructs. Pearson's correlation results relating biochemical constituents (GAG and collagen; normalized to the wet weight) to mechanical properties (Young's (EY) modulus and dynamic (G*) modulus) of annuli and cores free-swelling (FS) and dynamically loaded (DL) constructs. Significant p values are bolded (n=4-5).
| Loading | Pearson's R (p) | |||
|---|---|---|---|---|
| Whole | Annulus | Core | ||
| FS | GAG vs. EY | -0.11 (0.737) | 0.42 (0.139) | 0.25 (0.438) |
| Collagen vs. EY | 0.12 (0.731) | 0.16 (0.667) | 0.07 (0.833) | |
| GAG vs. G* | 0.42 (0.228) | 0.40 (0.157) | 0.25 (0.429) | |
| Collagen vs. G* | 0.47 (0.175) | 0.59 (0.072) | 0.18 (0.566) | |
| DL | GAG vs. EY | 0.71 (0.007) | 0.42 (0.139) | 0.56 (0.048) |
| Collagen vs. EY | 0.38 (0.353) | 0.12 (0.695) | 0.62 (0.023) | |
| GAG vs. G* | 0.70 (0.007) | 0.40 (0.157) | 0.69 (0.009) | |
| Collagen vs. G* | 0.69 (0.009) | 0.05 (0.852) | 0.65 (0.016) | |
Safranin O and Picrosirius Red stainings (Figure 6) were intense in the center of both free-swelling (Figure 6B, H) and dynamically loaded (Figure 6E, K) constructs at day 42. Along the circumferential surface, both free-swelling and dynamic loading possessed a dense GAG and collagen-rich layer (Figure 6A, D, G, J). The Picrosirius Red staining extended further into the free-swelling construct (Figure 6G) than into the dynamically loaded construct (Figure 6J). Along the axial surface, both free-swelling and dynamically loaded constructs had a dense, GAG and collagen-rich layer (Figure 6C, F, I, L). This layer was thinner, more intensely stained, and smoother in the dynamically loaded construct (Figure 6F, L) than in the free-swelling control (Figure 6C, I).
Figure 6.
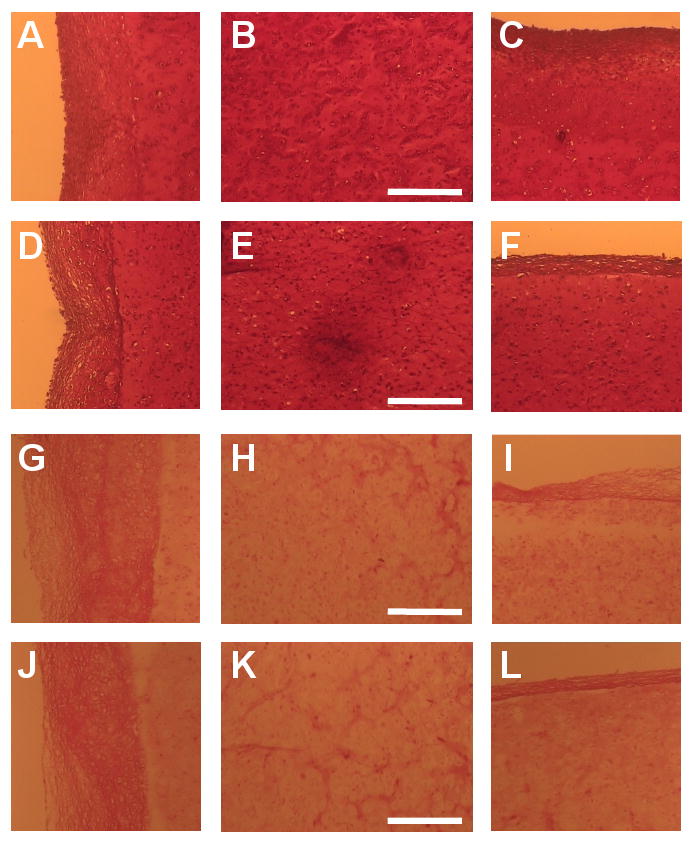
Safranin O (GAG; A-F) and picrosirius red staining (collagen; G-L) of free-swelling (A-C, G-I) and dynamically loaded (D- F, J-L) constructs on day 42. Images were acquired along the radial edge (first column), in the center (second column), and along the axial edge (third column) of the constructs. Scale bars equal 250 μm. Staining intensity distribution along the axial direction of the constructs for Safranin O (M; GAG) and Picrosirius Red (N; Collagen). Intensity is normalized by the intensity at the center region (x/h = 0.5), where x/h = 0 represents the top and bottom surfaces of the construct (n = 3).
At day 42, the type II collagen staining (Figure 7A-F) was intense for both free-swelling and dynamically loaded constructs along the axial and radial edges. There was a cell-dense type II collagen-free region around the periphery of both groups (Figure 7A, C, D, F). However, along the axial edge (Figure 7C, F), this region was more extensive in the free-swelling construct (Figure 7C) than for the dynamically loaded construct (Figure 7F). In the central region of the constructs (Figure 7B, E), staining was far less dense than that which was observed at the edges (Figure 7A, C, D, F). Additionally, staining in the center was more intense for the dynamically loaded construct (Figure 7E) than the free-swelling construct (Figure 7B).
Figure 7.
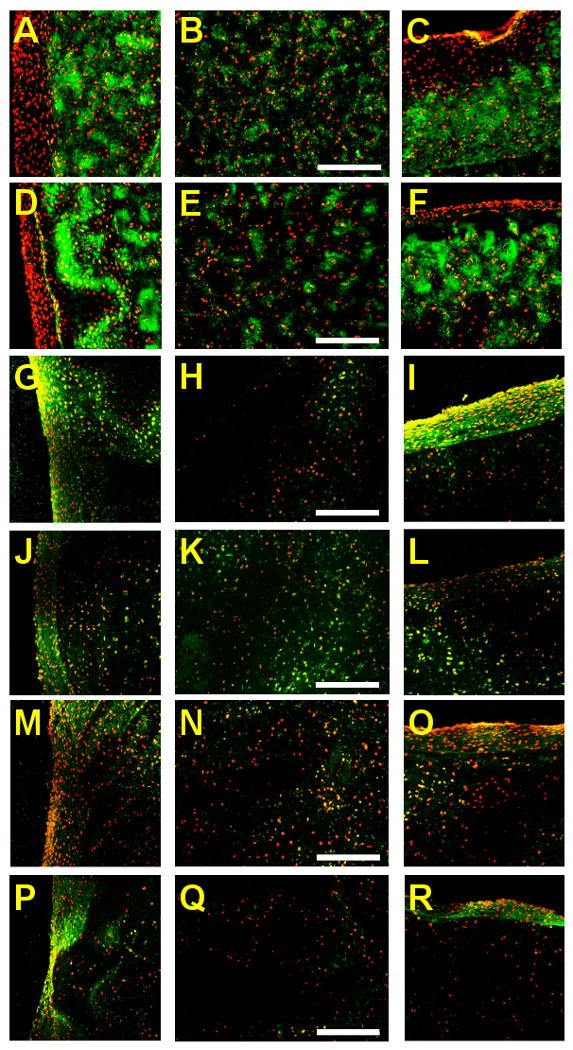
Immunofluorescent labeling (green) for type II collagen (A-F), type I collagen (G-L), and elastin (M-R) of free-swelling (A-C, G-I, M-O) and dynamically loaded (D-F, J-L, P-R) chondrocyte-seeded constructs at day 42. Images were acquired along the radial edge (first column), in the center (second column), and along the axial edge (third column) of the constructs. Propidium iodide counter staining (red) was used tovisualize the cell nuclei. Scale bars equal 200 μm.
At day 42, type I collagen (Figure 7G-L) and elastin immunofluorescence (Figure 7M-R) showed that although the fibrous outer layer is composed primarily of type I collagen in the free-swelling constructs, elastin is the dominant component in the dynamically loaded constructs (compare Figure 7G, I, J, L to Figure 7M, O, P, R). Interestingly, for the dynamically loaded constructs, type I collagen staining was more intense on the radial (unloaded) edge than on the axial (loaded) edge (Figure 7J, L). In the central region of the constructs, a small amount of type I collagen (Figure 7H, K) and elastin (Figure 7N, Q) staining were observed for both free-swelling and dynamically loaded constructs. Type I collagen labeling was more intense in the central region of the dynamically loaded constructs (Figure 7K) compared to free-swelling controls (Figure 7H), however similar levels of elastin staining was observed in the central region of both groups of constructs (Figure 7N, Q).
Discussion
The results of this study represent the first published attempt known to the authors that seeks to characterize the development of engineered cartilage tissue in the radial direction. Consistent with our previous findings2, 20-22, the moduli of the dynamically loaded constructs in the presented study were generally greater than free-swelling counterparts (for whole constructs as well as respective central core and annuli regions). Interestingly, the relative radial variation in material properties was unaffected by loading, with inner and peripheral regions derived from the constructs having similar Young's modulus and GAG content, with both areas possessing improved Young's modulus under dynamic loading. This is a surprising result given that it was expected that the radial fluid flow arising during unconfined cyclical compression would preferentially affect the region of the construct encompassed by the annulus and not be transmitted through to the center of the construct. We therefore must reject our hypothesis that dynamic loaded constructs exhibit different radial inhomogeneity than free-swelling constructs. In this regard, our findings for radial distribution in properties are reminiscent of those previously reported for axial distribution in properties, where the profile of the relative depth-varying modulus is similar for free-swelling and loaded constructs2.
Coring of the constructs appeared to significantly reduce the dynamic modulus of both the cores and the annuli compared to the respective intact samples (Figure 5 B, C, D). However, given that the dynamic modulus depends on the fluid pressurization within the sample 12, 19, this apparent reduction may be due to changes in the fluid flow boundary conditions resulting from the coring technique. Therefore, inter-group comparisons between the dynamic moduli of cores, annuli, and whole constructs were avoided. The lack of significant differences in the compressive Young's modulus between the cores and annuli, however, remains valid given that this measurement is a material property that is normalized to geometry and determined at equilibrium, thereby being fluid flow independent. The effects of dynamic loading also appear to be genuine as dynamic loading increased the measured mechanical properties regardless of sample geometry. Say something here like the fact that with radial fluid flow being greater at the edges, you would expect that the radial edge might have some better tissue development, but the cores do exhibit better properties as well with loading. It might be due to a combination of convection and diffusion through the construct due to loading as found in Mauck 2003 solute transport paper. 5
Histological analysis reveals the presence of a thick cell-rich fibrous layer that encompasses the free-swelling constructs as well as the circumferential surface of the dynamically loaded constructs, as previously reported22-24. The formation of this fibrous layer has been linked to fetal bovine serum 24 and may be due to the proliferation of cells that have crawled out (or been pushed out) onto their outer surfaces of the constructs. Immunostaining for type I and II collagen and elastin showed that the cell-rich fibrous layer is devoid of type II collagen25. However, the free-swelling and dynamically loaded constructs showed disparate type I collagen and elastin staining, with free-swelling constructs primarily expressing type I collagen and dynamically loaded constructs primarily expressing elastin at their peripheries. Dynamic loading appeared to downregulate the production of type I collagen while upregulating the production of elastin on the loaded surface, thereby reducing the differentiation of cells along the surface of the tissue. This downregulation of type I collagen production with loading has been reported in the literature25. These results are encouraging because elastin has been shown to be expressed in the superficial zone of articular cartilage26, 27 and may represent an adaptation of the articular surface in vivo due to mechanical stresses. This fibrous layer has been found to affect the mechanical properties of cartilage explants28 and therefore may also have had an unmeasured effect on the mechanical properties of the engineered cartilage in this study, particularly the annuli. The compromising of this layer due to coring may also have some effect on the measured decrease in mechanical properties of cores and annuli when compared to intact samples.
Positive correlations were found between the GAG content and the moduli of constructs, and between the collagen content and the dynamic moduli of the intact constructs, consistent with previous publications from our laboratory21. However, these correlations were not strong or consistent among all groups, nor did they necessarily persist after coring of the constructs. Thus, when constructs cultured under free-swelling and dynamic loading were analyzed separately, these correlations for whole constructs were maintained for the dynamically loaded group only. With coring the correlation between the GAG content and the moduli were maintained in the cores, but were lost in the annuli of the loaded constructs. Coring also reduced the correlation between the collagen content and the dynamic modulus of the annuli, however, a strong correlation between the collagen content and both moduli was still observed in the central core of dynamically loaded constructs. Nevertheless, taken together, these results confirm our expectation that the changes in the equilibrium stiffness of the constructs over time may be due primarily to the elaborated GAG molecules. Additionally, these results indicate that the collagen content plays a more significant role in the dynamic stiffness of the dynamically loaded constructs than free-swelling controls, possibly indicating structural adaptation to mechanical stimuli. A more highly organized collagen fiber network, which we believe is generated by the radial tensile strain associated with dynamic unconfined compression loading2, 29, may contribute to the significantly stiffer dynamic modulus observed for the loaded constructs at day 42. This explanation is supported by polarized light images of radial fiber alignment in dynamically loaded constructs reported previously2. The disruption of the collagen network and of the fibrous capsule may explain the loss of correlation in collagen content and dynamic modulus in the annuli as this tissue capsule is more present, and therefore would have more of an effect, on the annuli compared to the cores. Maybe fix this sentence and make it sound better?
While mechanical properties and GAG content generally did not exhibit differences between the core and annular regions, other measures did show significant differences. The absolute DNA content of cores was lower than annuli on day 0, but this is likely due to differences in size as wet-weight normalized data show no significant differences. The annuli, however, did increase in DNA content, in both absolute and wet-weight normalized data, compared to cores over time in culture. Less collagen per wet weight was produced in central core regions compared to their respective annular regions, which is consistent with our finding that the central region of constructs exhibited less intense staining for collagen compared to the outer edges2 (Figure 6 and Figure 7). The most likely explanation for these observations is transport limitation for nutrients and waste products; whereas solute transport between the central core and the culture medium occurs primarily through the axial surfaces of the construct (top surface), the annular region also benefits from transport through the lateral surface (radial edge). The increases in annuli DNA content may also be partially due to the heavily cellular outgrowth formed on the construct over time in culture. Transport limitations may be exacerbated by the formation of the dedifferentiated cell layer on the construct in terms of nutrient consumption and diffusion length. Dynamic loading, which is expected to enhance nutrient transport5, had an influence on GAG content in the cores and annuli, but not on collagen content, indicating a preferential mechanotransduction mechanism that warrants further investigation.
The findings of this study may be specific to our chondrocyte-seeded agarose hydrogel system and may not necessarily extend to more porous and permeable scaffolds. Seidel and co-workers reported that the material properties of chondrocyte-seeded polyglycolic acid (PGA) constructs did not benefit from culturing in a perfusion-mechanical stimulation bioreactor after a 30 day free-swelling culture period25. In contrast to the current study, GAG levels with loading were observed to drop with culture time. In addition, GAG normalized by wet weight was generally similar for central core regions and annular ring regions of constructs in our study, but was significantly decreased in the annular region for the PGA constructs. These results likely indicate that the effects of applied deformational loading are scaffold-dependent; indeed it is possible that the greater permeability of the PGA constructs would lead to greater amounts of GAG loss during loading.
In summary, this study shows that chondrocyte-seeded agarose disks do not exhibit significant inhomogeneity in material properties and GAG content along the radial direction, and collagen synthesis progresses at a slower rate in the core relative to the annular regions. The mechanical properties are governed predominantly by the GAG content, at least up to the stage of maturation achieved here. Dynamic loading enhanced the material properties and GAG content relative to free-swelling controls, but did not alter the spatial homogeneity. While nutrient transport limitations might explain the radial variation in DNA and collagen content, this does not appear to affect GAG distribution, most likely because chemical signals and building blocks for GAG synthesis remain available at sufficient levels in the core as well as the annulus. As this study represent the first attempts to characterize the radial development of engineered cartilage constructs, it is important to acknowledge the pitfalls of the adopted experimental design: It is possible that any effects of the fluid flow gradient produced during loading were masked by the coarseness of the coring technique used in the presented study. Future experiments may utilize smaller cores from various locations to better characterize the development of de novo matrix in the radial direction. In addition, the fibrous tissue formation and known variability of serum 30 motivate the adoption of a serum-free culture media for future research.
Acknowledgments
This work was supported by the NIH [AR46568 (CTH) and AR49922 (CTH) and a graduate research supplement (TNK)]. The authors also acknowledge Dr. Grace Chao for her contributions to the preparation of this manuscript.
References
- 1.Mauck RL, Soltz MA, Wang CC, Wong DD, Chao PH, Valhmu WB, et al. Functional tissue engineering of articular cartilage through dynamic loading of chondrocyte-seeded agarose gels. J Biomech Eng. 2000;122:252–260. doi: 10.1115/1.429656. [DOI] [PubMed] [Google Scholar]
- 2.Kelly TA, Ng KW, Wang CC, Ateshian GA, Hung CT. Spatial and temporal development of chondrocyte-seeded agarose constructs in free-swelling and dynamically loaded cultures. J Biomech. 2005;39:1489–1497. doi: 10.1016/j.jbiomech.2005.03.031. [DOI] [PubMed] [Google Scholar]
- 3.Ateshian GA, Wang H. A theoretical solution for the frictionless rolling contact of cylindrical biphasic articular cartilage layers. J Biomech. 1995;28:1341–1355. doi: 10.1016/0021-9290(95)00008-6. [DOI] [PubMed] [Google Scholar]
- 4.Park S, Krishnan R, Nicoll SB, Ateshian GA. Cartilage interstitial fluid load support in unconfined compression. J Biomech. 2003;36:1785–1796. doi: 10.1016/s0021-9290(03)00231-8. [DOI] [PMC free article] [PubMed] [Google Scholar]
- 5.Mauck RL, Hung CT, Ateshian GA. Modeling of neutral solute transport in a dynamically loaded porous permeable gel: implications for articular cartilage biosynthesis and tissue engineering. J Biomech Eng. 2003;125:602–614. doi: 10.1115/1.1611512. [DOI] [PMC free article] [PubMed] [Google Scholar]
- 6.Mow VC, Wang CCB, Hung CT. The extracellular matrix, interstitial fluid and ions as a mechanical signal transducter in articular cartilage. Osteoarthritis Cartilage. 1999;7:41–58. doi: 10.1053/joca.1998.0161. [DOI] [PubMed] [Google Scholar]
- 7.Armstrong CG, Lai WM, Mow VC. An analysis of the unconfined compression of articular cartilage. J Biomech Eng. 1984;106:165–173. doi: 10.1115/1.3138475. [DOI] [PubMed] [Google Scholar]
- 8.Armstrong CG, Mow VC. The mechanical properties of articular cartilage. Bull Hosp Jt Dis Orthop Inst. 1983;43:109–117. [PubMed] [Google Scholar]
- 9.Quinn TM, Grodzinsky AJ, Buschmann MD, Kim YJ, Hunziker EB. Mechanical compression alters proteoglycan deposition and matrix deformation around individual cells in cartilage explants. J Cell Sci. 1998;111(Pt 5):573–583. doi: 10.1242/jcs.111.5.573. [DOI] [PubMed] [Google Scholar]
- 10.Kim YJ, Sah RL, Grodzinsky AJ, Plaas AH, Sandy JD. Mechanical regulation of cartilage biosynthetic behavior: physical stimuli. Arch Biochem Biophys. 1994;311:1–12. doi: 10.1006/abbi.1994.1201. [DOI] [PubMed] [Google Scholar]
- 11.Buschmann MD, Kim YJ, Wong M, Frank E, Hunziker EB, Grodzinsky AJ. Stimulation of aggrecan synthesis in cartilage explants by cyclic loading is localized to regions of high interstitial fluid flow. Arch Biochem Biophys. 1999;366:1–7. doi: 10.1006/abbi.1999.1197. [DOI] [PubMed] [Google Scholar]
- 12.Soltz MA, Ateshian GA. Interstitial fluid pressurization during confined compression cyclical loading of articular cartilage. Annals Biomedical Eng. 2000;28:150–159. doi: 10.1114/1.239. [DOI] [PubMed] [Google Scholar]
- 13.Riesle J, Hollander AP, Langer R, Freed LE, Vunjak-Novakovic G. Collagen in tissue-engineered cartilage: types, structure, and crosslinks. J Cell Biochem. 1998;71:313–327. doi: 10.1002/(sici)1097-4644(19981201)71:3<313::aid-jcb1>3.0.co;2-c. [DOI] [PubMed] [Google Scholar]
- 14.McGowan KB, Kurtis MS, Lottman LM, Watson D, Sah RL. Biochemical quantification of DNA in human articular and septal cartilage using PicoGreen and Hoechst 33258. Osteoarthritis Cartilage. 2002;10:580–587. doi: 10.1053/joca.2002.0794. [DOI] [PubMed] [Google Scholar]
- 15.Farndale RW, Buttle DJ, Barrett AJ. Improved quantitation and discrimination of sulphated glycosaminoglycans by use of dimethylmethylene blue. Biochim Biophys Acta. 1986;883:173–177. doi: 10.1016/0304-4165(86)90306-5. [DOI] [PubMed] [Google Scholar]
- 16.Stegemann H, Stalder K. Determination of hydroxyproline. Clin Chim Acta. 1967;19:267–273. doi: 10.1016/0009-8981(67)90167-2. [DOI] [PubMed] [Google Scholar]
- 17.Hollander AP, Heathfield TF, Webber C, Iwata Y, Bourne R, Rorabeck C, et al. Increased damage to type II collagen in osteoarthritic articular cartilage detected by a new immunoassay. J Clin Invest. 1994;93:1722–1732. doi: 10.1172/JCI117156. [DOI] [PMC free article] [PubMed] [Google Scholar]
- 18.Lin W, Shuster S, Maibach HI, Stern R. Patterns of hyaluronan staining are modified by fixation techniques. J Histochem Cytochem. 1997;45:1157–1163. doi: 10.1177/002215549704500813. [DOI] [PubMed] [Google Scholar]
- 19.Mow VC, Kuei SC, Lai WM, Armstrong CG. Biphasic creep and stress relaxation of articular cartilage in compression? Theory and experiments J Biomech Eng. 1980;102:73–84. doi: 10.1115/1.3138202. [DOI] [PubMed] [Google Scholar]
- 20.Kelly TA, Wang CC, Mauck RL, Ateshian GA, Hung CT. Role of cell-associated matrix in the development of free-swelling and dynamically loaded chondrocyte-seeded agarose gels. Biorheology. 2004;41:223–237. [PubMed] [Google Scholar]
- 21.Mauck RL, Seyhan SL, Ateshian GA, Hung CT. Influence of seeding density and dynamic deformational loading on the developing structure/function relationships of chondrocyte-seeded agarose hydrogels. Ann Biomed Eng. 2002;30:1046–1056. doi: 10.1114/1.1512676. [DOI] [PubMed] [Google Scholar]
- 22.Mauck RL, Wang CC, Oswald ES, Ateshian GA, Hung CT. The role of cell seeding density and nutrient supply for articular cartilage tissue engineering with deformational loading. Osteoarthritis Cartilage. 2003;11:879–890. doi: 10.1016/j.joca.2003.08.006. [DOI] [PubMed] [Google Scholar]
- 23.Ng KW, Mauck RL, Statman LY, Lin EY, Ateshian GA, Hung CT. Dynamic deformational loading results in selective application of mechanical stimulation in a layered, tissue-engineered cartilage construct. Biorheology. 2006;43:497–507. [PubMed] [Google Scholar]
- 24.Kisiday JD, Kurz B, DiMicco MA, Grodzinsky AJ. Evaluation of medium supplemented with insulin-transferrin-selenium for culture of primary bovine calf chondrocytes in three-dimensional hydrogel scaffolds. Tissue Eng. 2005;11:141–151. doi: 10.1089/ten.2005.11.141. [DOI] [PubMed] [Google Scholar]
- 25.Seidel JO, Pei M, Gray ML, Langer R, Freed LE, Vunjak-Novakovic G. Long-term culture of tissue engineered cartilage in a perfused chamber with mechanical stimulation. Biorheology. 2004;41:445–458. [PubMed] [Google Scholar]
- 26.Naumann A, Dennis JE, Awadallah A, Carrino DA, Mansour JM, Kastenbauer E, et al. Immunochemical and mechanical characterization of cartilage subtypes in rabbit. J Histochem Cytochem. 2002;50:1049–1058. doi: 10.1177/002215540205000807. [DOI] [PubMed] [Google Scholar]
- 27.Yeh AT, Hammer-Wilson MJ, Van Sickle DC, Benton HP, Zoumi A, Tromberg BJ, et al. Nonlinear optical microscopy of articular cartilage. Osteoarthritis Cartilage. 2005;13:345–352. doi: 10.1016/j.joca.2004.12.007. [DOI] [PubMed] [Google Scholar]
- 28.Moretti M, Wendt D, Schaefer D, Jakob M, Hunziker EB, Heberer M, et al. Structural characterization and reliable biomechanical assessment of integrative cartilage repair. J Biomech. 2005;38:1846–1854. doi: 10.1016/j.jbiomech.2004.08.021. [DOI] [PubMed] [Google Scholar]
- 29.Loboa EG, Wren TA, Beaupre GS, Carter DR. Mechanobiology of soft skeletal tissue differentiation--a computational approach of a fiber-reinforced poroelastic model based on homogeneous and isotropic simplifications. Biomech Model Mechanobiol. 2003;2:83–96. doi: 10.1007/s10237-003-0030-7. [DOI] [PubMed] [Google Scholar]
- 30.Honn KV, Singley JA, Chavin W. Fetal bovine serum: a multivariate standard. Proc Soc Exp Biol Med. 1975;149:344–347. doi: 10.3181/00379727-149-38804. [DOI] [PubMed] [Google Scholar]