

Abstract
Studies showing an increase in plasma concentration of high density lipoprotein cholesterol (HDL-C) with moderate exercise have usually rejected the role of body weight change in the HDL-C raising process, ostensibly because the amount of weight lost has been negligible. To investigate HDL-C changes more thoroughly, we followed initially sedentary middle-aged men randomly assigned to either a moderate running (N= 36) or a sedentary control (N = 28) group for one year. Among runners, one-year changes in plasma HDL-C concentrations correlated strongly with their body weight changes (r = - 0.53, P < 0.001). Curve-fitting procedures and regression analysis suggested that processes associated with weight change produce much of the plasma HDL-C changes induced by moderate exercise and that changes in HDL-C concentration predominantly reflect changes in the reputedly anti-atherogenic HDL2 sub-component. Further, the interaction between weight change and plasma HDL-C concentration was significantly different (P < 0.001) in exercisers and controls suggesting that the metabolic consequences of exercise-induced weight change are different from the consequences of weight change in the sedentary state.
Keywords: Body weight, exercise, cholesterol, weight loss, plasma high density lipoprotein
Introduction
Evidence from both cross-sectional and longitudinal studies strongly suggests that running and other endurance activities increase the plasma concentration of high density lipoprotein cholesterol (HDL-C) [1-4]. Moreover, population studies indicate that lean individuals have higher HDL-C levels than those who are more obese [5]. Since weight loss is associated with endurance exercise training [6] it is relevant to inquire to what extent the higher HDL-C concentrations characteristic of physically active people are attributable to their relative leanness.
Previous training studies have usually circumvented this issue. Further, they have focused on total HDL-C change, that is, the change in the total cholesterol content of several species of lipoproteins in the high density region [7]. If it is true that the HDL2 component of HDL is more closely associated with reduced coronary disease risk than is the HDL3 component [8], then summarizing the effects of exercise on high density lipoproteins in terms of HDL-C concentration changes may conceal differential HDL2 and HDL3 responses to training that may be of clinical and metabolic significance.
The Stanford Exercise Training Study evaluated changes in HDL2 and HDL3 mass, as well as HDL-C concentrations, during a one-year running program in initially sedentary men randomly allocated to exercise and control groups. In another paper, we reported that average weekly miles run was found to correlate positively with individual changes in HDL-C and HDL2-mass and negatively with HDL3-mass within the exercise group [9]. Between-group differences for HDL-C, HDL2-mass and HDL3-mass were not significant, probably because many exercisers failed to achieve the minimal training level apparently required to promote changes in these variables [10]. The present report addresses the fundamental issue of whether change in body composition is an antecedent to the increases in plasma concentrations of HDL-C and HDL2 and the decreases of HDL3 acquired by the higher mileage runners in the exercise group.
Materials and Methods
Following baseline evaluations, 81 healthy but sedentary males aged 30-55 were assigned at random to an exercise group of 48 members or to a sedentary control group of 33 members. The exercise participants joined a supervised exercise program based on jogging or running that met 3-5 days per week for one year [9]. Training heart rates were set at 70-85% of the maximal heart rate achieved during the baseline treadmill test and were maintained by pulse rate monitoring. Control subjects were asked to maintain their sedentary lifestyle for one year.
Exercise and control participants were evaluated at 3-month intervals to determine the influence of exercise training on exercise tolerance, food intake, body composition and plasma lipoprotein concentrations. Determinations of plasma concentrations of cholesterol in total HDL were performed following the procedures of the Lipid Research Clinics [11]. The concentrations of HDL2 and HDL3 [7] in serum were measured (as total mass) by computer analysis of the results of analytic ultracentrifugation [12]. The concentration of HDL2 is taken as the sum of two components: HDL2a and HDL2b [7].
Total body mass was measured at each visit. Body density was determined by hydrostatic weighing [13] and was also estimated from an equation that uses chest, abdomen, and thigh skinfold thicknesses [14]. Body composition was estimated from body density according to the equation of Siri [15], yielding percent body fat, fat body mass, and lean (non-fat) body mass.
Although no specific dietary instructions were given to exercisers or controls, both groups completed 3-day dietary inventories at baseline, 6 months, and 1 year, which were reviewed by a dietitian during a personal interview. The inventories were subsequently coded using the Nutrition Coding Center (Minneapolis, MN) code book and rules. Mean total calorie and nutrient intakes were determined using the computerized food composition tables and analysis program of the Nutrition Coding Center.
Participants also maintained diaries of the distance and frequency of runs. The variables “miles per week” are the average number of reported miles run per week from baseline to 6 months, 6 months to 12 months, and baseline to 12 months.
Wilcoxon two-sample tests are used for comparing baseline levels and group changes between exercisers and controls while Spearman's rho correlation coefficients are used for measuring physiologic associations. Six-month and 1-year changes in physiologic variables are also analyzed graphically by applying smoothing procedures to scatterplot data as described by Cleveland [16]. Multiple regression analyses are used to determine the relative effects of miles run and body composition change on plasma HDL concentrations. All significance levels are two-tailed.
The analyses in this paper include only those subjects with complete data for HDL and body composition at baseline, 6 months and 1 year who did not report going on special diets to lose weight (36 exercisers, 28 controls). The baseline values for this subsample did not differ significantly from those of the total group (48 exercisers, 33 controls).
Results
The randomization process produced two comparable groups with respect to body composition and HDL concentration (Table 1). There were no significant differences between the 36 exercisers and 28 controls for the variables at baseline, although the exercisers had slightly higher plasma HDL-C and HDL2 mass levels and were somewhat leaner than controls.
TABLE 1.
Baseline values for HDL and body composition variables in exercisers and controls (mean ± standard deviation)a.
| Exercisers | Controls | |
|---|---|---|
| High density lipoproteins | ||
| HDL-C (mg/100 ml) | 51.4± 8.8 | 46.2± 7.8 |
| HDL2-mass (mg/100 ml) | 98.3±54.1 | 74.5±44.0 |
| HDL3-mass (mg/100 ml) | 189.3±35.5 | 184.1 ±26.0 |
| Body composition | ||
| Total body mass (kg) | 75.2± 8.7 | 78.4± 10.9 |
| Per cent body fat (%) | 20.6± 5.5 | 21.9± 5.4 |
No significant differences (P > 0.05) by Wilcoxon's two-sample test between exercisers and controls.
Percent body fat determined from hydrostatic weighing.
Changes in weight and body composition
During the 1-year running program the exercisers lost significantly more total body mass (mean ± SD, -1.4 ± 3.1 kg) and percent body fat (-1.3 ± 2.9%) than controls (1.1 ± 2.9 kg and 2.8 ± 3.3%, respectively, both P≤ 0.001). Most of the total body mass change in exercisers occurred during the first 6 months (-l.3 ± 2.7 kg). Exercisers lost comparatively little weight between months 6 through 12 (-0.2 ± l.6 kg) suggesting that body mass had largely stabilized at the end of the first 6 months of training.
A plot of the 1-year changes in lean, fat, and total body mass versus reported miles run in exercisers is shown in Fig. 1. Most of the total weight change is due to fat loss; changes in lean body mass are relatively minor and they are not significantly correlated with miles run. It is important to note that the changes toward leaner body compositions tended to occur in the runners who increased their total dietary caloric intake. One-year change in caloric intake was positively correlated with miles run (r = 0.42, P < 0.05) but negatively correlated with total weight change (r = - 0.50, P < 0.005) during this period. These associations are illustrated in Fig. 2.
Figure 1.
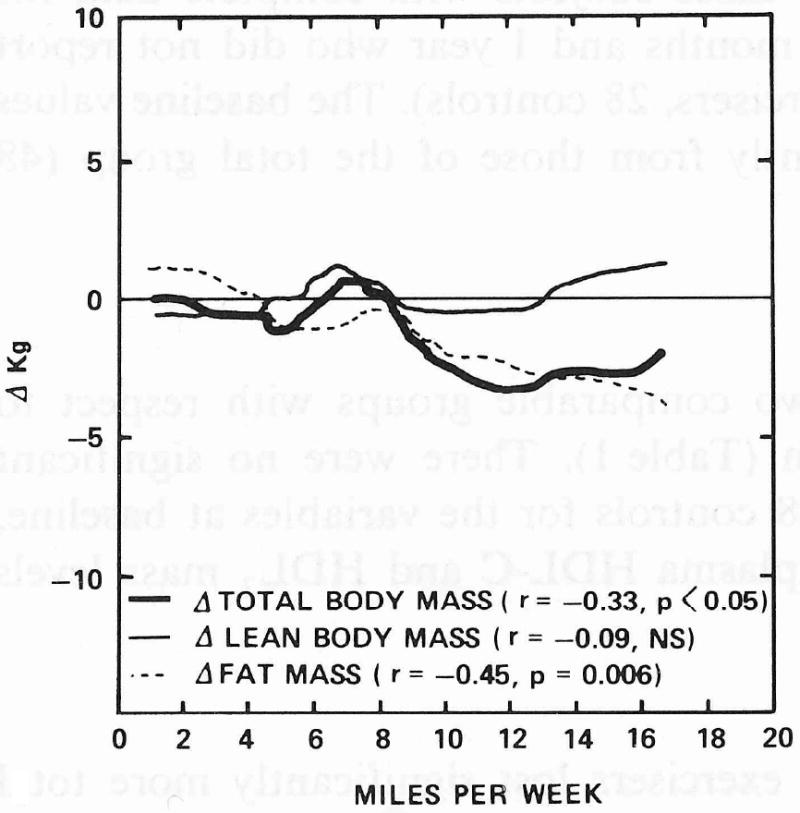
Smoothed scatterplot curves for 1-year changes in lean, fat, and total body mass versus 1-year average reported miles run in exercisers (N = 36).
Figure 2.
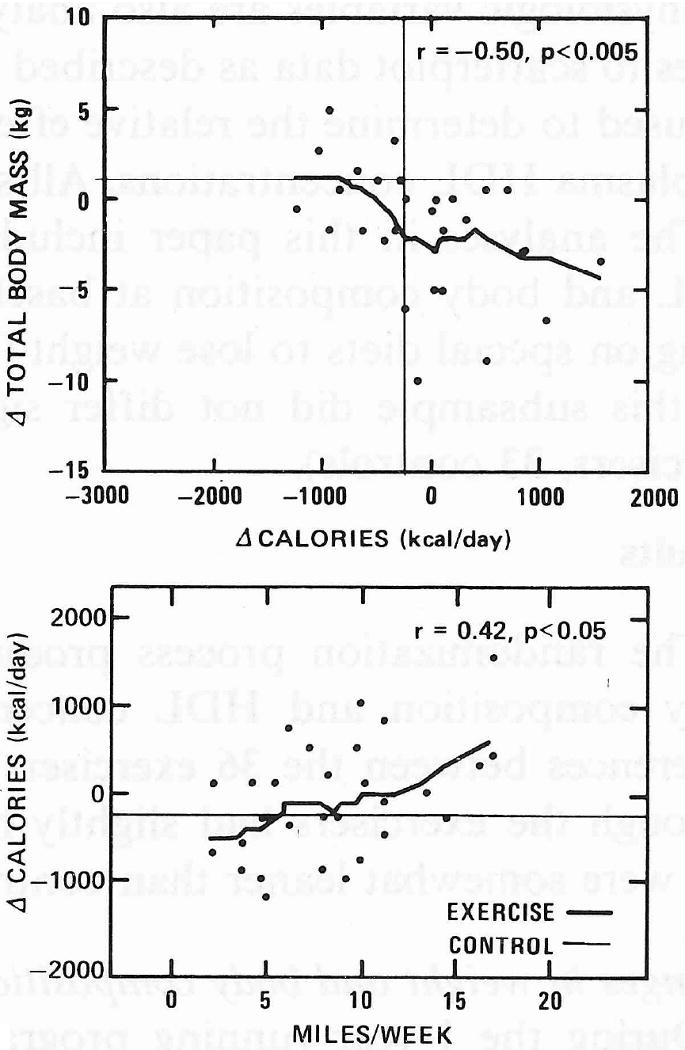
Smoothed scatterplots and Spearman's correlation coefficient (ρ) for 1-year changes in daily total dietary calorie intake versus Δtotal body mass and reported miles run in exercisers. Horizontal and vertical lines display corresponding mean changes for the control group (n = 28).
Changes in high density lipoproteins
(a) Correlational analyses
Although the group mean for plasma HDL-C did not increase significantly more in runners than in controls (1.3 ± 7.2 mg/100 ml vs. 0.l ± 5.8 mg/100 ml) among exercisers, the 1-year HDL-C changes correlate positively with reported miles run (Table 2). ΔPercent body fat has a significant negative correlation with ΔHDL-C for months 0 to 6, but a much weaker correlation for months 6 through 12. (Nearly identical coefficients are obtained for hydrostatic weighing and skinfold estimates of percent body fat.) ΔHDL-C and miles run are strongly correlated only for the 6-12-month period. Surprisingly, ΔHDL-C is more strongly correlated with changes in total body mass than with changes in percent fat, perhaps partially reflecting the greater precision in measuring total weight change.
TABLE 2.
Correlation between changes in high-density lipoprotein (HDL) cholesterol concentrations and changes in body composition during 6-month and 1-year periods of exercise training, exercise group only (N=36).a
| Miles run per week | ΔTotal body mass | Δ Percent body fat | ||
|---|---|---|---|---|
| Hydrostatic weighing | Skinfold measurement | |||
| ΔHDL-C | ||||
| Baseline-6 months | 0.01 | -0.65† | -0.44** | -0.44** |
| 6 months-12 months | 0.47** | - 0.49** | -0.22 | -0.20 |
| Baseline-12 months | 0.44** | -0.53*** | - 0.47** | -0.43** |
| ΔHDL2 | ||||
| Baseline-6 months | -0.01 | -0.63† | -0.43** | -0.47** |
| 6 months-12 months | 0.44** | -0.46** | -0.26 | -0.34* |
| Baseline-12 months | 0.44** | -0.53*** | -0.53*** | -0.53*** |
| ΔHDL3 | ||||
| Baseline-6 months | 0.06 | 0.15 | 0.11 | 0.10 |
| 6 months-12 months | -0.29 | -0.01 | -0.04 | 0.07 |
| Baseline-12 months | -0.42** | 0.14 | 0.27 | 0.26 |
Two-tailed significance levels for Spearman's correlation coefficient:
P≤0.05;
P≤0.01;
P ≤ 0.001;
P ≤ 0.0001.
ΔHDL2 closely mirrors ΔHDL-C in its correlations with changes in total body mass, percent body fat, and mileage. Correlation coefficients for ΔHDL-C and ΔHDL2 mass are in fact virtually identical, a remarkable result given that HDL2 mass constitutes only about one-third of total HDL mass, and that HDL-C and HDL2 are measured by different methods in separate facilities. The effects of running on HDL3 are very different from those observed for HDL-C or HDL2. ΔHDL3 mass is negatively correlated with miles run and is apparently independent of changes in body composition.
(b) Multiple regression analyses
Since both body composition change and miles run per week are correlated significantly with ΔHDL-C and with each other, we include both variables in a series of regression analyses (Table 3). The two independently determined measures of Δlean body mass and Δfat body mass, from hydrostatic weighing and from skinfold thickness measurements, are examined in order to validate these traditionally difficult measurements. The multiple linear regression analyses suggest that both Δlean body mass and Δfat body mass account for significant linearly-independent components of the variation in ΔHDL-C during all time periods. A decrease in fat body mass is associated with an increase in HDL-C. ΔLean body mass and ΔHDL-C are also inversely related. Adding the number of miles run per week to the body composition variables in the regression analyses does not reduce the significance of the coefficients for the body composition variables. Number of miles run per week is significant for 6-month to 1-year changes in HDL-C, but not for baseline to 6-month changes.
TABLE 3.
Multiple regression coefficients of 6-month and 1-year changes in HDL-C concentrations during exercise training. a
| Body composition only | Body composition and reported weekly mileage | |||
|---|---|---|---|---|
| Hydrostatic weighing | Skinfold measurement | Hydrostatic weighing | Skinfold measurement | |
| baseline-6 months | ||||
| Intercept | -1.23 | -1.36 | 2.03 | 0.67 |
| Δlean body mass (kg) | -1.36** | -1.86** | -1.28* | -1.92** |
| Δfat body mass (kg) | -1.80† | -1.64† | -1.96† | -1.70† |
| miles run per week | -0.46 | -0.30 | ||
| R2 | 0.39 | 0.38 | 0.42 | 0.39 |
| 6 months-12 months | ||||
| Intercept | 0.51 | 0.23 | -3.83 | -4.22 |
| Δlean body mass (kg) | -2.41* | -3.02** | -1.75 | -2.89** |
| Δfat body mass (kg) | -2.11** | -2.14** | -1.73* | -1.56* |
| miles run per week | 0.44* | 0.50* | ||
| R2 | 0.20 | 0.23 | 0.29 | 0.34 |
| baseline -12 months | ||||
| Intercept | -1.03 | -1.06 | -4.50* | -4.53* |
| Δlean body mass (kg) | -1.04* | -1.51** | -1.03* | -1.45** |
| Δfat body mass (kg) | -1.58† | -1.44† | -1.24** | -1.18*** |
| miles run per week | 0.48 | 0.49 | ||
| R2 | 0.38 | 0.39 | 0.44 | 0.46 |
Two-tailed significance levels:
P≤0.05;
P≤0.01;
P ≤ 0.001;
P ≤ 0.0001.
The regression equations for ΔHDL2 (not displayed) are in qualitative agreement with the regression equations for ΔHDL-C (Table 3) except that the linearly independent effect of Δlean body mass on ΔHDL2 is significant only during the first 6-month period, and not during all time periods, as found with ΔHDL-C.
The regression equations for ΔHDL-C and ΔHDL2 include similar coefficients for Δlean body mass and Δfat body mass, suggesting that together these two variables do as well as (or may be replaced by) their sum, that is, Δtotal body mass. In fact, the regression equations using Δtotal body mass do produce multiple correlation coefficients (R2) similar to those from equations using both Δlean and Δfat body mass.
(c) Graphical analyses
To observe the form of the functional relationship between miles run, Δtotal body mass, and ΔHDL-C, we applied Cleveland's robust curve fitting procedure to the one-year data (Fig. 3). The smoothed curves relating 1-year miles run with ΔHDL-C and Δtotal body mass are basically mirror images: there is no change in ΔHDL-C or Δtotal body mass for 0-8 miles run per week, a sharp increase in ΔHDL-C and a sharp decrease in Δtotal body mass for 8-12 miles per week, and no further change for either variable for 12 or more miles per week. Figure 3 also shows a relatively smooth linear relationship between changes in weight and HDL-C during the 1-year period.
Figure 3.
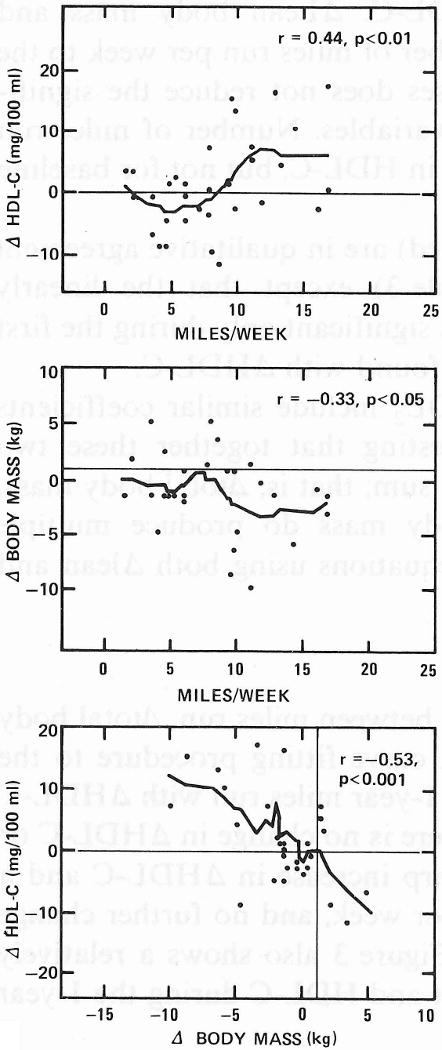
Smoothed scatterplots and Spearman's correlation coefficient (ρ) for the assocations among 1-year changes in plasma HDL-C concentrations, total body mass, and reported miles run in exercisers. Horizontal and vertical lines display corresponding mean changes for the controls.
(d) Exercise versus control group comparison
Smooth scatterplot curves and multiple regression analysis were also used to determine whether the strong inverse association between ΔHDL-C and Δweight in runners applied to the non-exercise-induced weight change observed in controls. The regression slopes relating 0-6-month weight change to HDL-C change were significantly different for exercisers and controls (P < 0.0001). Thus, equivalent amounts of weight change correspond to a significantly greater HDL-C change in exercisers than controls. Significantly different coefficients for exercisers and controls were also obtained when Δlean and Δfat body mass replace Δtotal body mass in these analyses, so that differences between groups in the proportion of lean or fat body mass gained or lost do not explain the differential HDL-C response. Further, the smoothed scatterplot curves of Fig. 4 show that the inverse association between Δweight and ΔHDL-C in exercisers and the slight (non-significant) positive association between these variables for controls each fall fully within a common range of weight change. The associations were not significantly different (P= 0.11) between groups during the 6-12-month period, suggesting that this difference is limited to the period of most substantial weight change in the exercise group.
Figure 4.

Smoothed scatterplots and Spearman's correlation coefficient (ρ) for baseline to 6-month changes in plasma HDL-C concentrations versus Δtotal body mass. Multiple regression analyses suggest the inverse association between ΔHDL-C and Δtotal body mass in exercisers is significantly different (P < 0.0001) from the slightly positive association between these variables in controls.
Discussion
Many exercise training studies have neglected or rejected the role that body composition change may have in the relationship between increased exercise and plasma HDL-C concentration changes, because the total amount of weight loss was small. In a group of 36 sedentary middle-aged men randomly assigned to a 1-year running program we find that 1-year changes in total weight correlate strongly with exercise-induced increases in HDL-C (r = - 0.53), despite the fact that mean weight loss for the group was small (mean = -1.5 kg).
Comments regarding other exercise studies
Other studies reporting an insignificant contribution by body composition change to the HDL-C raising process or significant HDL changes during exercise training without weight loss appear inconclusive to us. For example, an earlier study by our group [1] and another by Adner and Castelli [2] reported significantly higher HDL-C concentrations and lower relative weights in marathon runners compared to an otherwise comparable sedentary control group. On the basis of statistically insignificant correlations between relative weight and HDL-C within exercise or control groups, both groups of investigators argued that differences in weight could not have accounted for all the observed differences in HDL-C. Nonetheless, the absence of a significant correlation in either the exercise or the control group alone does not demonstrate that there would be no correlation between these variables if the groups were combined, which is a necessary, but not a sufficient condition for this argument to hold.
In another study, Keins et al. [3] followed 24 exercisers and 13 control participants during a 12-week training program. They interpreted their results to indicate a significant treatment versus control group increase in HDL-C levels in the absence of weight or percent body fat change in either group, implying an independent effect due to exercise. However, HDL-C values were initially lower for exercisers than for controls and the effect of 12 weeks of training was to increase the average HDL-C value in the exercise group to a level comparable to the baseline average for the controls. Also, mean changes in HDL-C for the exercise and control groups were not directly compared by a two-sample t-test; instead, the significant change in the treatment group was contrasted with the absence of a significant change in the control group. If methodological drift, seasonal variation, or other exogenous factors were responsible for the observed increase in HDL-C, then this increase would be more likely to be detected in the exercise group because of its larger size and consequently greater statistical power.
Huttunen et al. [4] found increases in HDL-C with 4 months of exercise training that cannot be totally ascribed to weight loss. HDL-C increased significantly in the exercise group while HDL-C for the control group remained essentially unchanged. Although a direct two-sample comparison of the 4-month changes in HDL-C between exercisers and controls was not presented in their paper, the average HDL-C concentrations in the exercise and control groups were significantly different from each other at the end of the study. Significant weight loss occurred in both exercise and control groups. The HDL-C increase of the exercise group continued to be significant when subjects who gained or lost one kilogram or more of body mass were excluded from the analysis. This result is offered as evidence of the independent effect of exercise training on HDL-C. Their argument requires acceptance of the premise that any change in weight of less than one kilogram is physiologically insignificant with respect to changes in plasma HDL-C concentrations. Huttunen et al. also found that changes in HDL-C concentrations within the exercise group were positively correlated with changes in weight, an intriguing but perplexing result that is contrary to the observations of most other studies.
Lipson et al. [17] found that HDL-C did not increase during exercise training when they attempted to keep body weight constant by adjusting daily caloric intake. Despite their efforts, a minor but statistically significant weight loss was experienced by the exercise group compared with the control group. The authors argue that weight change was minimal and that the absence of a significant increase in HDL-C is consistent with the hypothesis that the HDL-C increase generally seen during exercise training may be largely the result of concomitant weight loss. They acknowledge that the training may not have been sufficiently long to produce increases in plasma HDL-C concentrations. Our report on the amount of exercise training required to increase HDL-C [10] suggests that this caveat may well apply.
HDL change and body composition
The analyses presented in this paper suggest that a large portion of the observed changes in concentration of plasma HDL-C and HDL2 mass during exercise is directly related to concurrent weight changes. We conclude this result for two reasons.
First, both the 1-year change in HDL-C and the 1-year change in total body mass share the same biphasic functional relationship with the number of miles run per week (Fig. 3). Moreover, there is a very simple linear relationship between Δtotal body mass and ΔHDL-C over the 1-year period. If body mass loss and HDL-C increase are only indirectly related through exercise then exercise must coincidentally affect total body mass and HDL-C in a very similar manner. A more parsimonious explanation of these observations is that exercise produces a decrease in total body mass and processes associated with total body mass change in turn elevate HDL-C. Although there is no basis from these observations for choosing change in total body mass as the antecedent variable, a mechanism linking weight change to exercise is well established (i.e., body fat loss due to negative caloric balance, and lean body mass gain due to muscle build-up [6]). Several theories have been proposed relating decrease in body fat to increase in HDL. For example Schwartz and Brunzell [18] presented evidence suggesting that adipose lipoprotein lipase activity is increased during body fat loss by caloric restriction, and Nikkilä et al. [19] found a significant positive correlation between adipose lipoprotein lipase activity and plasma HDL-C and HDL2 concentrations. Further, a pronounced elevation in adipose lipoprotein lipase activity was found in approximately half of the active runners examined by Nikkilä [20].
Second, the multiple regression analyses suggest that much but not all of the HDL-C and HDL2 change of our exercisers can be attributed to their changes in total body weight. In fact a large portion of the observed correlations between miles run and 1-year change in HDL-C and HDL2 can be explained by changes in body composition or weight. These results require cautious interpretation. The coefficients of the regression analyses may be affected by colinearity among miles run per week, fat body mass change, and lean body mass change. Miles run per week thus may not be significant in the analysis of the 1-year change in HDL-C and HDL2 due to its association with the body composition variable.
Also, the analyses do not show that if the number of miles run per week is held constant, say at zero (as during dieting without exercise), reducing fat body mass would increase plasma HDL-C and HDL2. The reduction in weight is a direct result of the exercise activity itself. In fact it occurred under conditions where reported dietary caloric intake was increased (Fig. 2). These results merely indicate that the changes in HDL-C and HDL2 were more closely associated with weight loss than with reported mileage. Although multiple regression analyses cannot by themselves prove causality among these factors, these results do show that attributing much of the change in HDL-C and HDL2 to change in body weight is a plausible explanation of the observed data.
The smoothed scatterplots of Fig. 4 show that the metabolic consequences of exercise-induced weight change may be different from the consequences of weight change in the sedentary state. During the 0-6-month training period Δweight and ΔHDL-C were inversely associated in exercisers but essentially unrelated in controls. Therefore procedures (e.g., analysis of covariance) for adjusting for weight change when testing for significant exercise versus control group HDL-C differences are inappropriate because the assumption of equal slopes relating weight change to ΔHDL-C for both groups is violated. In this study the most “significant” exercise versus control group comparison concerns the Δweight-ΔHDL-C relationship and not differences in the group mean changes in plasma HDL-C concentrations. In searching for physiologic mechanisms giving rise to the higher HDL-C concentrations of exercisers it may be most revealing to focus on the metabolic processes associated with weight change that are unique to the exercising state.
HDL change and lean body mass
A surprising result from our analyses is that apparent changes in lean body mass are inversely related to changes in HDL-C and HDL2. This result is reinforced by two independent determinations of lean body mass based on hydrostatic weighing and skinfold measurements. However, a similar bias in the two body composition estimates could arise from the equation [15] for estimating lean and fat body mass from body density, since the equation is applied to each of the skinfold and hydrostatic determinations of body density to obtain the two estimates of body composition. Overestimates of fat body mass loss would produce overestimates in lean body mass gain, and vice versa for both skinfold and hydrostatic estimates. If, in fact, all of the weight change during the exercise training was actually a consequence of body fat loss, then the increases or decreases in lean body mass would be merely correction factors for imprecise determinations of fat body mass change. Correspondingly, the coefficients for Δlean body mass and Δfat body mass in predicting ΔHDL-C or ΔHDL2 in a multiple regression analysis should be nearly identical; this was indeed observed (Table 3).
HDL change and miles run
It is of interest to determine whether there are processes other than weight change that contribute to elevating plasma HDL-C and HDL2 during exercise training. That more than one metabolic process is involved is suggested by the temporal difference in the association of reported mileage with changes in plasma HDL-C concentrations (Table 2). The weaker association of mileage with ΔHDL-C and ΔHDL2 concentrations during 0-6 months vis-a-vis their association during 6-12 months is probably not due to less precise reporting of mileage early in the study, since a relatively large and significant correlation between mileage and change in body composition was seen for months 1 through 6 [10]. We also found miles run per week to be a significant, linearly independent variable in the regression analyses of the 6-l2-month HDL changes in exercises. The most probable basis for these observations is that other metabolic processes affecting HDL-C concentrations may become operational after a certain level and duration of exercise training or weight loss is achieved, and that these processes are more closely associated with reported miles run than with body composition change.
Conclusion
Weight loss was found in this study to be strongly associated with increases in HDL-C and HDL2 during exercise training, but the data from the control subjects suggest that weight change that occurs in the absence of exercise conditioning does not necessarily produce change in plasma HDL concentrations. Whereas several studies [18,21,22] have reported significant increases in HDL-C from substantial weight loss by caloric restriction, Wedhold et al. [23] found no change in HDL-C, and Thompson et al. [24] found HDL-C was decreased during dieting. The physiologic processes accompanying weight loss by exercise may be very different from those accompanying modest weight loss by dietary restriction. For example, caloric flux is reduced during caloric restriction whereas it is increased during running due to increased caloric expenditure and intake. For these reasons, the conclusions drawn relating the changes in body composition to changes in plasma concentrations of HDL-C during exercise training are not necessarily applicable to the effects of body fat reduction during dietary restriction.
The post-hoc correlation, regression, and graphical analyses presented in this report are exploratory. Their purpose is to suggest physiologic mechanisms that directly produce or that are closely related to exercise-induced HDL increases. Confirmation of our findings requires cross-validation from a similarly designed experiment or other experimental designs that contrast HDL change during exercise-induced weight loss versus diet-induced weight loss or that contrast exercise training with and without body composition change.
Acknowledgments
We wish to thank Ms. Nora Krantzler, Ph.D., and Mr. Michael Stoud, M.S., for their many helpful suggestions.
This study was supported by grants from the National Heart, Lung and Blood Institute (HL 24462 and HL 18574); and by a gift from Best Foods, a Unit of CPC North America.
References
- 1.Wood PD, Haskell WL. Effects of exercise on plasma high-density lipoproteins. Lipids. 1979;14:415. doi: 10.1007/BF02533428. [DOI] [PubMed] [Google Scholar]
- 2.Adner MM, Castelli WP. Elevated high-density lipoprotein levels in marathon runners. J Amer Med Ass. 1980;243:534. [PubMed] [Google Scholar]
- 3.Keins B, Jorgensen I, Lewis S, et al. Increased plasma HDL-cholesterol and apo A-I in sedentary middle-aged men after physical conditioning. Europ J Clin Invest. 1980;10:203. doi: 10.1111/j.1365-2362.1980.tb00021.x. [DOI] [PubMed] [Google Scholar]
- 4.Huttunen JK, Lansimies E, Voutilainen E. Effects of moderate physical exercise on serum lipoproteins. Circulation. 1979;60:1220. doi: 10.1161/01.cir.60.6.1220. [DOI] [PubMed] [Google Scholar]
- 5.Kannel WB, Gordon T, Castelli WP. Obesity, lipids and glucose intolerance The Framingham Study. Amer J Ciin Nutr. 1979;32:1238. doi: 10.1093/ajcn/32.6.1238. [DOI] [PubMed] [Google Scholar]
- 6.Thompson JK, Jarvie GJ, Lahey BB, et al. Exercise and obesity - Etiology, physiology and intervention. Psychol J. 1982;91:55. [PubMed] [Google Scholar]
- 7.Anderson DW, Nichols AV, Pan SS, et al. High-density lipoprotein distribution Resolution and determination of three major components in a normal population sample. Atherosclerosis. 1978;15:129. doi: 10.1016/0021-9150(78)90005-9. [DOI] [PubMed] [Google Scholar]
- 8.Miller NE, Hammett F, Saltissi S, et al. Relation of angiographically defined coronary artery disease to plasma lipoprotein subfractions and apolipoproteins. Brit Med J. 1981;282:1741. doi: 10.1136/bmj.282.6278.1741. [DOI] [PMC free article] [PubMed] [Google Scholar]
- 9.Wood PD, Haskell WL, Blair SN, et al. Increased exercise level and plasma lipoprotein concentrations - A one-year, randomized, controlled study in sedentary middle-aged men. Metabolism. 1983;32:31. doi: 10.1016/0026-0495(83)90152-x. [DOI] [PubMed] [Google Scholar]
- 10.Williams PT, Wood PD, Haskell WL, et al. The effects of dose and duration of exercise training on plasma lipoprotein cholesterol concentrations. J Amer Med Ass. 1982;247:2674. [Google Scholar]
- 11.Lipid Research Clinics, Manual of Laboratory Operations, Vol I (Lipid and Lipoprotein Analysis) U.S. Government Printing Office; Washington, DC: 1974. HEW Publication No. NIH 75-628. [Google Scholar]
- 12.Ewing AM, Freeman NK, Lindgren FT. The analysis of human lipoprotein distributions. In: Paoletti R, Kritchevsky D, editors. Advances in Lipid Research. Vol. 3. Academic Press; New York: 1965. pp. 25–61. [PubMed] [Google Scholar]
- 13.Katch FI, Michael ED, Horvath SM. Estimation of body volume by underwater weighing - Description of a simple method. J Appl Physiol. 1967;23:81. doi: 10.1152/jappl.1967.23.5.811. [DOI] [PubMed] [Google Scholar]
- 14.Jackson AS, Pollock ML. Generalized equations for predicting body density of men. Brit J Nutr. 1978;40:497. doi: 10.1079/bjn19780152. [DOI] [PubMed] [Google Scholar]
- 15.Siri WE. Body composition from fluid spaces and density - Analysis of methods. In: Brozek J, Henschel A, editors. Techniques for Measuring Body Composition. Nat Acad Sci; Wash.: 1961. p. 223. [Google Scholar]
- 16.Cleveland WS. Robust locally weighted regression and smoothing scatterplots. J Amer Stat Ass. 1979;74:829. [Google Scholar]
- 17.Lipson CL, Bonow RO, Schaefer EJ, et al. Effect of exercise conditioning on plasma high density lipoproteins and other lipoproteins. Atherosclerosis. 1980;37:529. doi: 10.1016/0021-9150(80)90060-x. [DOI] [PubMed] [Google Scholar]
- 18.Schwartz RS, Brunzell JD. Increase of adipose tissue lipoprotein lipase activity with weight loss. J Clin Invest. 1981;67:1425. doi: 10.1172/JCI110171. [DOI] [PMC free article] [PubMed] [Google Scholar]
- 19.Nikkilä EA, Taskinen MR, Kekki M. Relation of plasma high-density lipoprotein cholesterol to lipoprotein-lipase activity in adipose tissue and skeletal muscle of man. Atherosclerosis. 1978;29:497. doi: 10.1016/0021-9150(78)90178-8. [DOI] [PubMed] [Google Scholar]
- 20.Nikkilä EA, Taskinen UR, Rehunen S, et al. Lipoprotein lipase activity in adipose tissue and skeletal muscle of runners - Relation to serum lipoprotein metabolism. Metabolism. 1978;27:1661. doi: 10.1016/0026-0495(78)90288-3. [DOI] [PubMed] [Google Scholar]
- 21.Contaldo F, Strazzullo P, Postiglione A, et al. Plasma high density lipoprotein in severe obesity after stable weight loss. Atherosclerosis. 1980;37:163. doi: 10.1016/0021-9150(80)90001-5. [DOI] [PubMed] [Google Scholar]
- 22.Brownell KD, Stunkard AJ. Differential changes in plasma high density lipoprotein cholesterol in obese men and women during weight reduction. Arch Int Med. 1981;141:1142. [PubMed] [Google Scholar]
- 23.Widhalm K, Maxa E, Zyman H. Effects of diet and exercise upon the cholesterol and triglyceride content of plasma lipoproteins in overweight children. Europ J Pediat. 1978;127:121. doi: 10.1007/BF00445767. [DOI] [PubMed] [Google Scholar]
- 24.Thompson PD, Jeffery RW, Wing RR, et al. Unexpected decrease in plasma high density lipoprotein cholesterol with weight loss. Amer J Clin Nutr. 1979;32:2016. doi: 10.1093/ajcn/32.10.2016. [DOI] [PubMed] [Google Scholar]