Abstract
Permeability of the mineralized bone tissue is a critical element in understanding fluid flow occurring in the lacunar-canalicular porosity (PLC) compartment of bone and its role in bone nutrition and mechanotransduction. However, the estimation of bone permeability at the tissue level is affected by the influence of the vascular porosity (PV) in macroscopic samples containing several osteons. In this communication, both analytical and experimental approaches are proposed to estimate the lacunar-canalicular permeability in a single osteon. Data from an experimental stress-relaxation test in a single osteon is used to derive the PLC permeability by curve fitting to theoretical results from a compressible transverse isotropic poroelastic model of a porous annular disk under a ramp loading history (Cowin and Mehrabadi 2007; Gailani and Cowin 2008). The PLC tissue intrinsic permeability in the radial direction of the osteon was found to be dependent on the strain rate used and within the range of O(10−24)−O(10−25). The reported values of PLC permeability are in reasonable agreement with previously reported values derived using FEA and nanoindentation approaches.
Keywords: osteon properties, osteon permeability, osteon compression test, unconfined compression
1. INTRODUCTION
Fluid flow in tissues occurs at different scales including the main circulation, microcirculation and interstitium. Blood flow from the circulatory system provides tissues with oxygen, nutrients and appropriate conditions (temperature, pH) for cellular metabolism, as well as a mechanism for removal of carbon dioxide and other cellular waste products via the venous and lymphatic systems. Amino acids, sugars, fatty acids, coenzymes, hormones, neurotransmitters, salts and many other substances pass from the capillary blood vessels into the tissue’s interstitium. In bone, these substances travel across the capillary walls into the interstitial fluid in the vascular porosity (PV). The vascular porosity is the space inside the osteonal and Volkmann canals and exterior to the soft tissue structures, blood vessels and nerves, within these channels. The interstitial fluid in the PV also travels via canaliculi across lacunae, the matrix pores of the bone tissue where the osteocytes are encased. The fluid space composed of lacunae and canaliculi, excluding the volume occupied by osteocytes and their dendritic processes, is designated as the lacunar-canalicular porosity (PLC).
Time varying mechanical loads applied to bone generate fluid pressure gradients in the PLC that contribute to the interstitial fluid flow and the transport in the PLC. The interstitial fluid flow is important for cellular nutrition and waste removal, and it is a critical factor in osteocyte mechanotransduction (Weinbaum et al., 1994; and Cowin et al., 1995). Strain levels produced in the bone tissue by normal physiological activity are generally less than 0.2%; however, it is well known that osteocytes only respond to mechanical strains higher than 0.5%. While strains in the mineralized matrix are not sufficient to stimulate osteocytes, it has been proposed that the fluid flow in the lacunar-canalicular system generated by physical activity produces a strain amplification effect in the dendritic osteocyte cytoplasmic process within the range of stimulus an osteocyte can sense. Bone fluid flow in the PLC exerts a drag force on the osteocyte process that is large enough for the cell to sense (Weinbaum et al., 1994). Membrane channels, integrins, focal adhesion protein complexes, etc are among the structures located in the osteocyte process involved in the transduction of interstitial fluid flow into synthesis and release of biochemical factors implicated in the regulation of bone growth and development. Hence, the study of interstitial fluid flow is critical to better understand the mechanosensory system in bone and related bone diseases.
In this study the permeability of the PLC compartment is determined by curve fitting of a compressible transverse isotropic poroelastic model of a porous annular disk under a ramp loading history (Cowin and Mehrabadi 2007; Gailani and Cowin 2008) and experimental stress-relaxation test data for single osteons. The PLC tissue intrinsic permeability in the radial direction of the osteonal test specimen is the only free parameter in the curve fitting procedure.
2. THEORETICAL MODEL
2.1 Analytical Solution
A single osteon, idealized in this study as a fully saturated porous annular cylinder, is subjected to unconfined compression in stress relaxation mode. The experimental technique of subjecting circular disks of soft tissue to unconfined compression in order to determine the soft tissue’s permeability, and some of its elastic constants, has become widely used in the last few decades (Armstrong et al., 1984; Cohen et al., 1998; Wu and Herzog 2006; Yin and Elliot, 2004, and many others). The original study of unconfined compression appeared in a paper by Mandel (1953). The analysis of the experimental data from such a test is based on an analytical solution to an infinitesimally deformed saturated poroelastic disk loaded in a similar manner. For the analysis of soft tissues the assumption that the fluid and solid constituents of the poroelastic medium are both incompressible is reasonable. However in the case of hard tissues the constituent incompressibility assumption is not appropriate because the effective bulk modulus of the poroelastic solid constituent is almost an order of magnitude stiffer than that of the poroelastic fluid constituent, thus the solid constituent shields the fluid constituent from stress.
Following Mandel (1953), Armstrong et al., (1984) developed a theoretical poroelastic solution for a uniaxial unconfined compression test of a disk-shaped porous material representing articular cartilage, assuming infinitesimal deformation, frictionless platen interface, isotropic material properties and incompressible constituents. Later on, Cohen et al. (1998) proposed an incompressible transverse isotropic model and compared their theoretical solution to the unconfined experimental tests of the growth plate and the chondroepiphysis. They have shown that unlike the isotropic model proposed by Armstrong, the unconfined compression model with incompressible constituents and transverse isotropy provided a good curve fit between theory and experimental data.
Cowin and Mehrabadi (2007) extended the previous solutions to include the compressibility assumption of the fluid and solid phases and applied this approach to bone. In Gailani and Cowin (2008) a theoretical solution for the unconfined compression of a porous annular cylindrical disk was developed. The solution assumed three draining conditions. The first condition (BC1) considered flow through the outer boundaries only, the second condition (BC2) assumed flow through the inner boundaries only, and the third condition (BC3) takes into account flow through both boundaries. A ramp loading that is characterized by a constant strain rate ε̇o preceded by a period of duration to during which the applied strain is rising linearly from a value of 0 to toε̇o, is applied to obtain each of these solutions. After time to the value of ε(t) is constant at toε̇o. The expression of this strain loading function in terms of the Heaviside step function H(t) is
| (1) |
The boundary condition of interest here is the second condition (BC2) in which it was assumed that flow occurred across the inner boundaries only. In this case Gailani and Cowin (2008) obtained the following formulas for the force P(t) on the annular disk due to the applied strain loading:
| (2) |
for 0 ≤ t ≤ to, and
| (3) |
for t ≥ to. There is a significant amount of notation that appears in these two equations and we now identify the significance of each symbol. The inner and outer radii of the annular disk are denoted by b and c, a is the non dimensional inner radius (a = c / b), the constants C, D, F, M, N, and Y are defined in Table 1, and , components of the drained transversely isotropic elasticity matrix, are defined in Table 2. The diffusivity of the pore fluid pressure is characterized by m,
| (4) |
where Krr is the permeability in the radial direction, μ = 1 centipoise (cP) is the viscosity of the water, J is defined in Table 2. Table 1 and Table 2 summarize the expressions for a compressible transverse isotropic material model. The three functions
| (5) |
are combinations of different types of Bessel functions and αn are the simple poles obtained by setting the denominator of the Laplace transform of P(t) equal to zero for BC2 as shown in Galiani & Cowin (2008).
Table 1.
Expressions for various constants employed in the analytical solution as shown in Gailani and Cowin (2008)
| B | ||
| C |
|
|
| D |
|
|
| M |
|
|
| N |
|
|
| F |
|
|
| Y |
|
Table 2.
Expressions for different constants employed in the analytical solution, where , from Cowin and Mehrabadi (2007)
|
|
|
||
|
|
|
||
|
|
|
||
|
|
|
||
|
|
|||
| Λ |
|
||
|
|
|||
|
|
|
||
| Âz |
|
||
| J |
|
||
| Âr |
|
3. MATERIALS AND METHODS
3.1 Preparation of specimens
The osteon is composed of a central Haversian canal housing a blood vessel and is surrounded by alternating mineralized collagen lamellae. The mean Haversian canal and osteon diameters in femoral bone are estimated to be 40 – 60 µm and 200 – 250 µm respectively (Cooper et al., 2003; Cowin 2001). Their small size and stiffness make osteons challenging to isolate, nonetheless several approaches have been described in the literature since 1959. Ascenzi and coworkers (Ascenzi and Fabri 1959; Ascenzi and Bonucci 1967 Ascenzi et al., 1985; Ascenzi et al., 1994) developed a method for extraction of osteons from a thin cross section of bone using a sharp steel needle eccentrically inserted in a dentist’s drill or using a custom made micro lathe. Osteons have also been isolated by propagating a fracture through the natural boundary of the osteon (Frasca et al., 1976) and using a precision and computer controlled osteon pushout micro-testing system (Dong et al., 2005).
Most osteons in cortical bone do not have a perfectly cylindrical shape; however, for their testing and analysis in this study, osteon samples were prepared into cylindrical shaped specimens. Fresh femoral bovine bone samples were obtained from a local slaughterhouse, kept in Phosphate-buffered Saline Solution (PBS) and processed the same day. Gross bone slides 10 mm thick were cut perpendicular to the main axis of the whole bone using a belt diamond saw DL3000 XL (Diamond Tech. Intern. USA). A second gross cut was performed perpendicular to the annular slides to obtain parallelepiped shaped pieces of about 7 to 10 mm in length. A low speed circular diamond saw was then used to correct uneven cut surfaces (Isomet, Buehler Corp.) resulting in smooth flat surfaces. Top and bottom surfaces were then polished with progressive 400-, 800- and 1200-grit SiC sand paper and alumina slurry (0.1µm particle size). The parallelism between both surfaces was tested at different locations using a digital caliper, and the polishing was continued until the flatness error was smaller than 1 µm. Dehydration was avoided during the sample preparation and testing procedures by permanent irrigation with phosphate buffered saline solution (PBS).
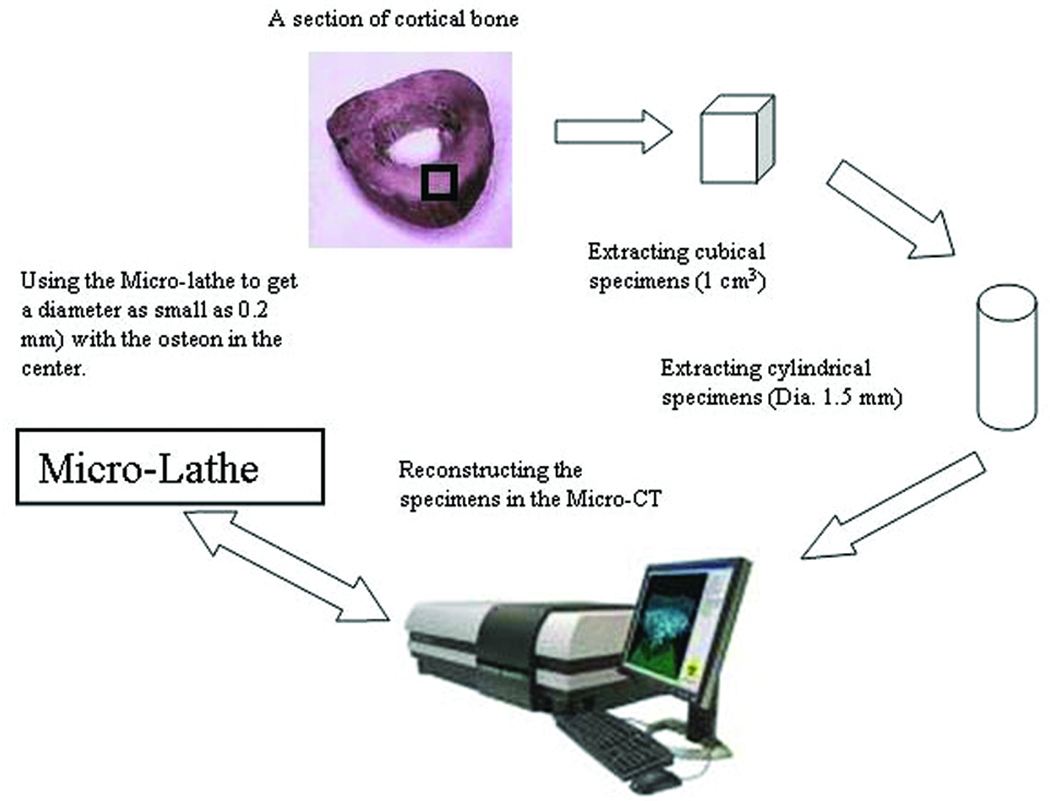
Several cylindrical rods of approximately 1.5mm diameter were obtained from the bone cube using a variable speed Mill/Drill machine (G0463, Grizzly Industrial, Inc.) with a 1/18” diamond plated core drill bit (3.3 mm/0.13”, Technology LK Inc.). These cylindrical bone samples were imaged using a high resolution Micro-CT system (SkyScan Corp., Belgium). Images from Micro-CT were used to identify the location and inclination angle of the Haversian canals relative to the central axis of the sample. A schematic diagram for the osteon isolation process is shown in Figure 1. Samples exhibiting a mean Haversian canal orientation parallel and concentric to the axis of the sample were retained for the osteon isolation process as shown in Figure 2. The diameter of selected bone samples was reduced up to 200–300 µm using a 4”×5” Mini Micro-lathe (Central Machinery Inc., USA), corresponding approximately to the average diameter of osteons. This cutting operation was accomplished at very low speed, with extra care as the diameter of the specimen was made thinner and thinner. Water was used as a coolant during the milling and lathe operations to prevent heating and dehydration of the sample (Currey, 1988). A 400–500µm height segment was cut from the cylindrical specimen, resulting in an isolated osteon (n=12) suitable for the unconfined compression stress relaxation test.
Figure 1.
Osteon isolation process. A thick section was cut from the mid-diaphysis of the bone, and a cubical sample was prepared. Cylindrical rods of about 1.5 mm diameter were extracted from this bone cube and analyzed using a Micro-CT to identify the samples with Haversian canals approximately concentrical and parallel to the axis of the cylindrical rod. Selected samples were processed in a Micro-Lathe to reduce the diameter of the sample to 300 mm, resulting in samples containing a single osteon. All cutting procedures are performed under continuous irrigation and low speed.
Figure 2.
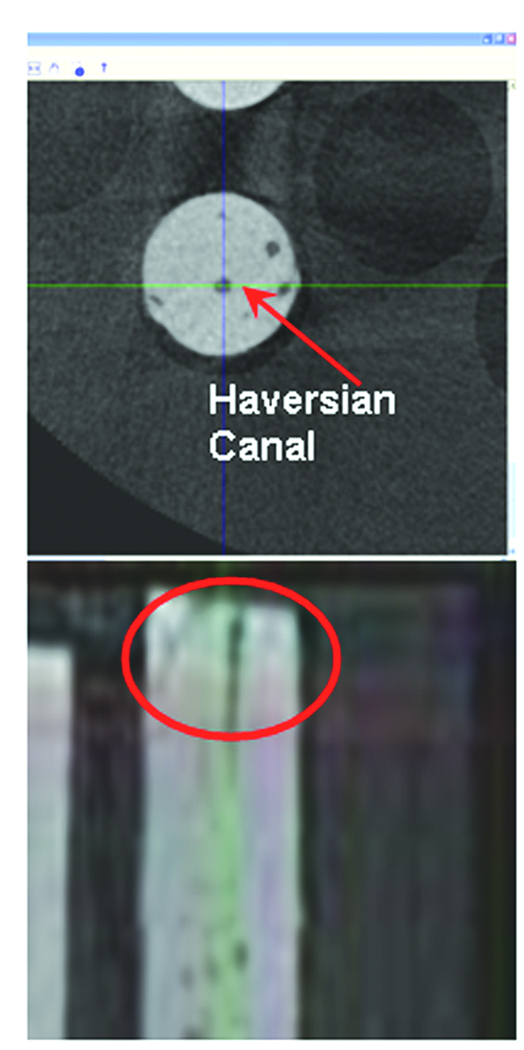
Micro-CT image of a bone sample (Diameter is 1.5 mm approximately) prior osteon isolation. The figure showing few Haversian canals with one that is approximately in the center. The diameters of the Haversian canals can be measured from these images.
3.2 Micro-CT scanning and images post treatment
The bone samples were scanned using a high resolution 1172 SkyScan Micro-CT system. For image acquisition, X-ray projections were generated from the sample each 0.3 degrees, obtaining 600 consecutive views with 0.9 µm pixel size. Five exposures by projection were used to produce high contrast low noise images. The raw images were corrected for possible pixel defects in the digital detector using bright and dark fields, and a standard reconstruction algorithm (Feldkamp) included in the acquisition system was applied to generate 3-D volumes from the planar X-ray projections. Identification of the solid tissue and the Haversian pore cavity was developed based on a global thresholding method. 3-D volume reconstruction for each sample was performed using a computer workstation. A commercially available software package (Mimics, Materialise, Ann Arbor, MI) was used to generate the 3-D bone geometry from each micro-CT scan. High resolution images were calibrated for densities within the volumes using a phantom containing hydroxyapatite (the main component of bone’s mineralized phase), air, and water. An image generated in the Micro-CT is shown in Figure 2.
3.3 Micromechanical testing
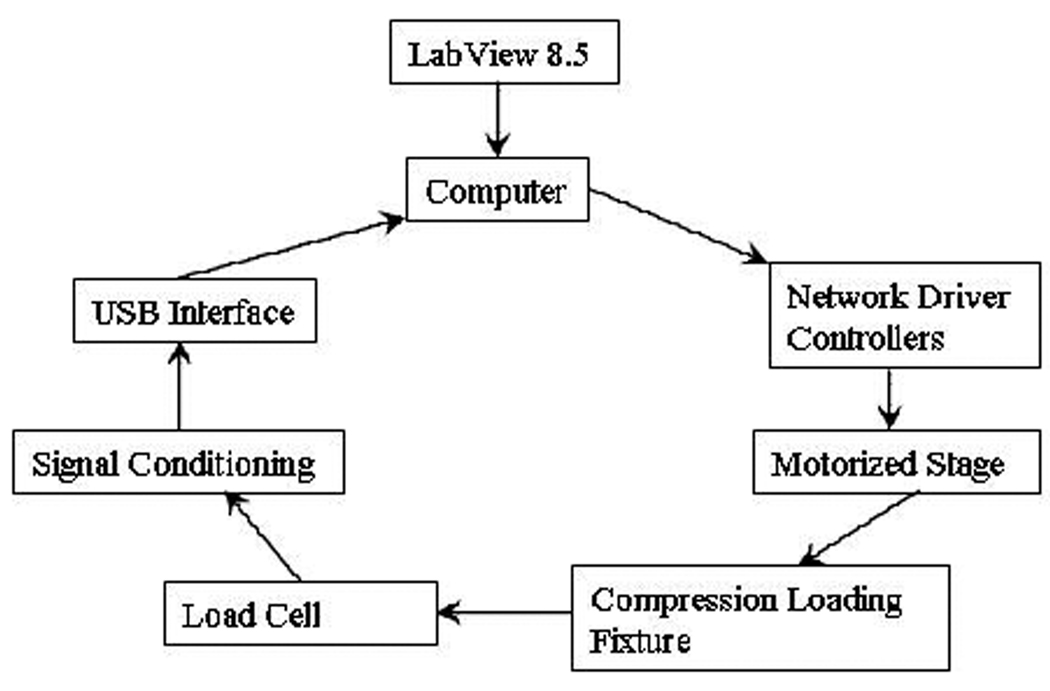
A miniature uniaxial material testing stage was developed by our group for the assessment of mechanical properties in small bone samples. The computer controlled stage comprises an Intelligent Picomotor control module (8753 driver, New Focus Inc.) and an Ethernet controller (8752 Ethernet controller, New Focus Inc.). The driver was connected to a small piezoelectric motor (Picomotor, New Focus Inc.) which has a displacement resolution of 30 nm. The Z-stage held a stainless steel platen vertically aligned to a second platen in a loading chamber filled with water, and connected to a load cell (GS series gram force −10 grams- sensor, Transducer Technique Inc.). The resolution of the measurement was 0.05% (5 mg) of the load cell’s full scale. Load cell output signal was amplified using an instrumentation amplifier (INA 122, Texas Instruments) and then calibrated using standard weights to display the measured force in grams. Voltages were converted into digital signals using a data acquisition interface (USB6810, National Instruments) and visualized in real time using LabView (V8.5, National Instruments). A schematic diagram for the loading system is shown in Figure 3. In order to perform a stress relaxation test in the sample, the loading stage was used under displacement control. The user inputs the desired strain rate in LabView, along with the type of test (compression or tension), then sends the commands to the Ethernet controller and the picomotor stage.
Figure 3.
A uniaxial micro-mechanical testing device was constructed based on a small piezoelectric motor. The motor was integrated to a custom compression loading stage, and axially aligned to a load cell. The position, speed and acceleration of the motor was controlled from a computer via a network driver controller using a custom LabView application. Load cell measurements were amplified and digitized using a USB interface, and displayed in real time during the test and recorded for offline data analysis.
The loading system performance was validated using a cylindrical steel sample in stress relaxation test (Goto et al. 1999). The specimen was pre-stressed with 0.2g and then loaded using a constant strain rate ε̇0 for a period of time t0 during which the applied force was rising linearly from a value of 0 to 2 g of force approximately. After time t0 the value of ε(t) was held constant. The loading system is shown in Figure 4. The sample was left to freely undergo relaxation until the change in measured force was no longer significant. The load vs. time curve was displayed in real time on the screen and stored in the hard drive for post-processing. Figure 5 shows the stress relaxation curve for a sample made of steel and a typical stress relaxation time history of the load intensity recorded for one of the isolated osteons in response to a ramp displacement with constant strain rate (ε̇ ≈ 10 με s−1). The load intensity in both curves is normalized by their respective peak load intensity. The stress relaxation of steel was found to be practically zero. However, when the bone sample underwent the same test, the response for bone clearly exhibits an exponential decrease in the recorded load magnitude. This implies that the stress relaxation response observed in the bone sample is neither a consequence of an artifact nor the compliance of the developed loading system.
Figure 4.
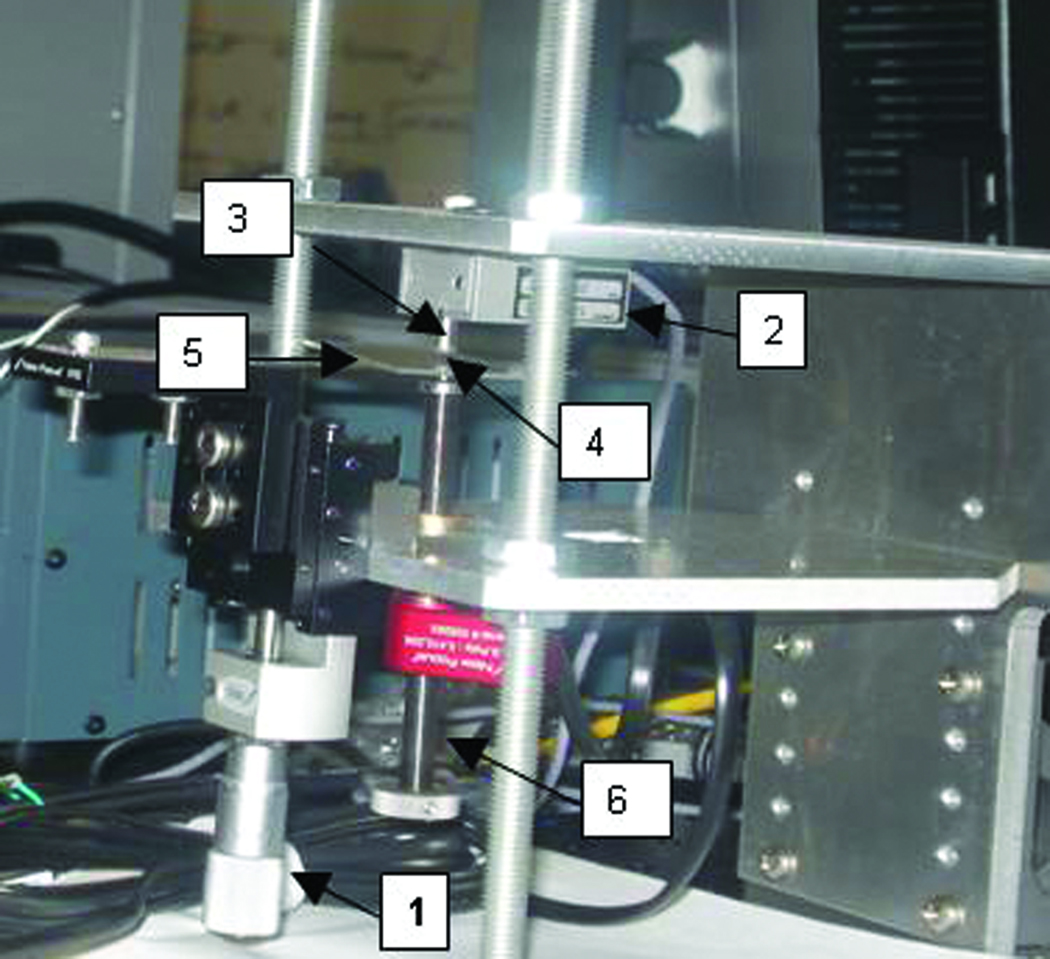
Photograph of the material testing stage which consists of: (1) micrometer, (2) load cell (10 grams, 0.05% FOM), (3) steel platens, (4) osteon sample, (5) sample stage, (6) picomotor linear actuator (30 nm displacement/step)
Figure 5.
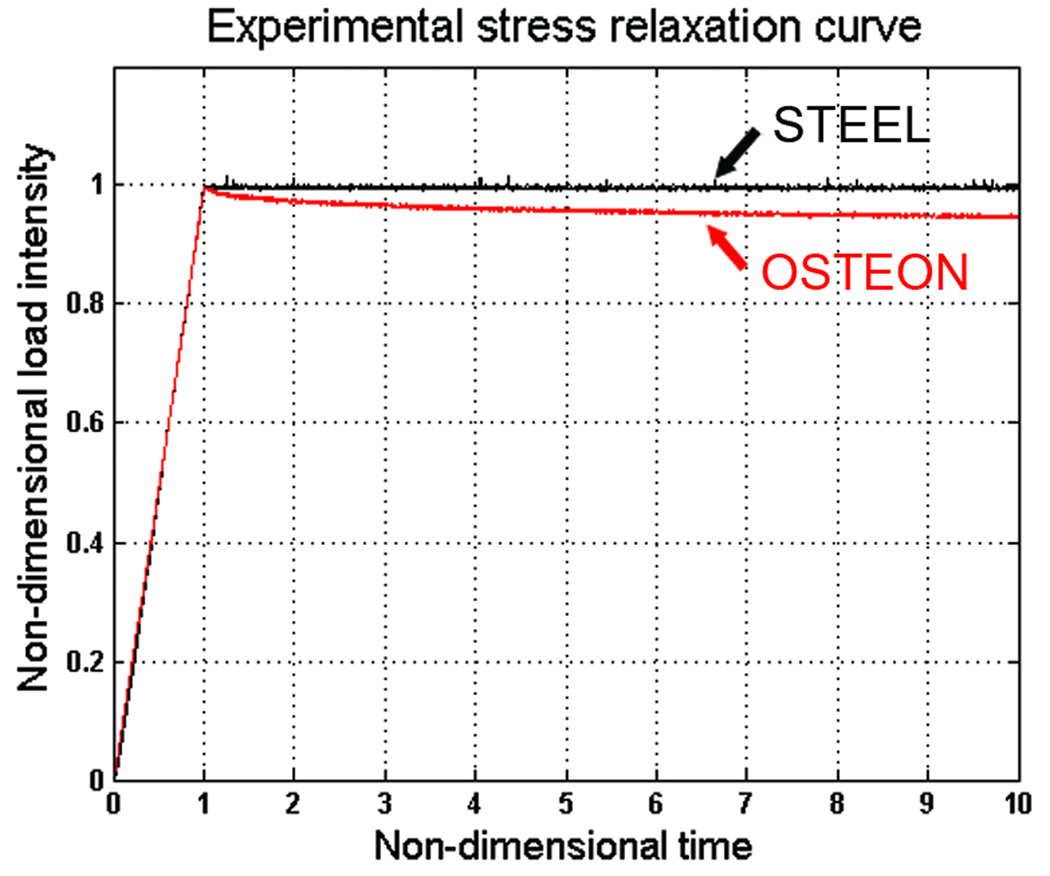
Stress relaxation curve for a sample made of steel and for one of the isolated osteons in response to a ramp displacement with constant strain rate (ε̇ ≈ 100 με s−1). The load intensity and loading time in both curves were normalized by the peak load intensity and t0 respectively.
The stress relaxation test was performed in each sample at three different strain rates, ε̇ ≈ 10 με s−1, 100 με s−1, and 1000 με s−1. Figure 6 shows a typical stress relaxation curves for a representative osteon, where the axes display the non-dimensional load intensity versus the non-dimensional time t/t0. This figure shows that the relaxation of the sample is sensitive to changes within the range of strain rate tested. The most intense relaxation process occurs at the highest strain rates. However, the load intensity at equilibrium is practically the same for a sample tested with the three employed strain rates.
Figure 6.
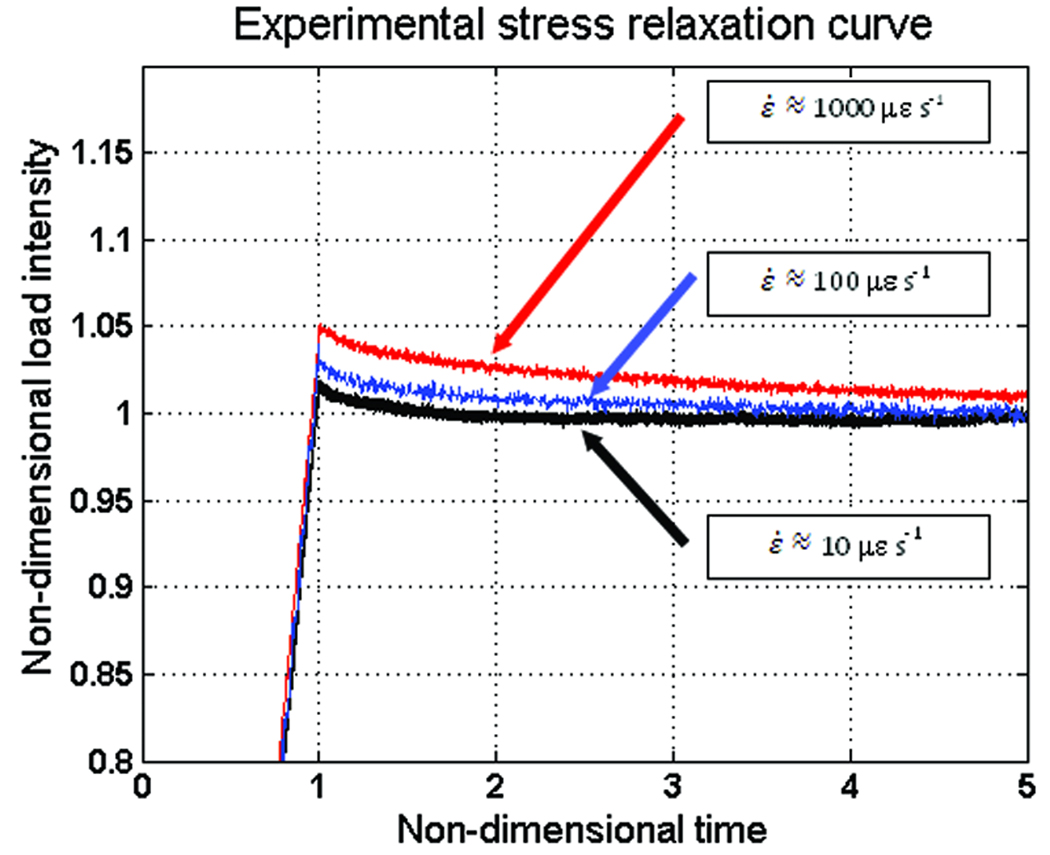
Stress relaxation response of a representative osteon loaded at three different strain rates, ε̇ ≈ 10 με s−1, 100 με s−1, and 1000 με s−1. The axes display the non-dimensional load intensity versus the non-dimensional time t/t0.
3.4 Estimation of the permeability
The pore sizes in cortical bone are of approximately three discrete magnitudes; the largest pore size (approximately 50 µm diameter) is associated with the vascular porosity (PV), the second largest pore size (approximately 0.3 µm diameter) with the canaliculi in the lacunar-canalicular porosity (PLC) and the smallest pore size (approximately 10 nm diameter) is in collagen-apatite porosity (PCA) (Cowin, 1999). In human cortical bone the cement line separates osteons from the interstitial bone tissue, which consists of remnants of primary lamellar bone or fragments of remodeled osteons. Estimates of the intrinsic permeability of the lacunar-canalicular porosity were provided by Zhang et al. (1998), Smit et al. (2002) and Oyen (2008) who employed a nanoindentation technique with a poroelastic analysis to provide an estimate of the permeability of the osteon. Lei and Szeri (2006) described a procedure for estimating the material parameters of biological soft tissue by fitting model prediction to experimental load–deformation data.
In this study, the PLC permeability is determined from the curve fitting of experimental vs. theoretical stress relaxation curves in which the permeability is the only unknown parameter. The code to compute the stress relaxation response of the annular bone sample was implemented in MatLab (MathWorks, MA). Equations 2 and 3 describe the ramp loading and relaxation period of the sample, which are functions of the relationships in table 1 and table 2. Two sets of bone tissue elastic properties are required in the model for the estimation of the permeability. The first set involves the osteonal matrix material properties, characterized by the superscript m; they include . The second set involves the measured elastic constants in a poroelastic material in the drained condition, with superscript d, . The transverse isotropic poroelastic constants considered in the model are summarized in Table 3. The curve fitting toolbox in MatLab was used to import the raw data and create a custom function based on the theoretical model that exclusively depends on the permeability. This custom equation is then fitted to the experimental data using a least-squares algorithm built in the toolbox. The only parameter that has not been assigned a value in the curve fitting process is the permeability in the radial direction of the sample Krr.
Table 3.
| Material Parameters | PLC | |
|---|---|---|
|
|
15.17 GPa | |
| 15.96 GPa | ||
|
|
0.27 | |
|
|
0.285 | |
|
|
0.27 | |
|
|
18.6 GPa | |
| 22.32 GPa | ||
|
|
0.322 | |
|
|
0.312 | |
|
|
0.255 | |
| Kf (Compressibility of water) | 2.3 GPa | |
| μ (Viscosity of water) | 1cP | |
| The Porosity ϕ | 0.05 |
4. RESULTS
The intrinsic permeability was obtained by curve fitting the theoretical model characterized by equation (3) to the experimental stress relaxation time history (Figure 7) and using a least-squared algorithm. The permeability was the only free parameter in the fitting algorithm. The procedure was performed using 30 poles in the summation term in equations (2) and (3) with the material properties reported in Table 3. The permeability was found to be 3×10⁻²⁴ – 6×10⁻²⁵ for the group loaded at ε̇ ≈ 10 με s−1, 5×10⁻²⁴ – 7×10⁻²⁵ for the group loaded at ε̇ ≈ 100 με s−1, and 8×10⁻²⁴ – 5×10⁻²⁵ for the group loaded at ε̇ ≈ 1000 με s−1.
Figure 7.
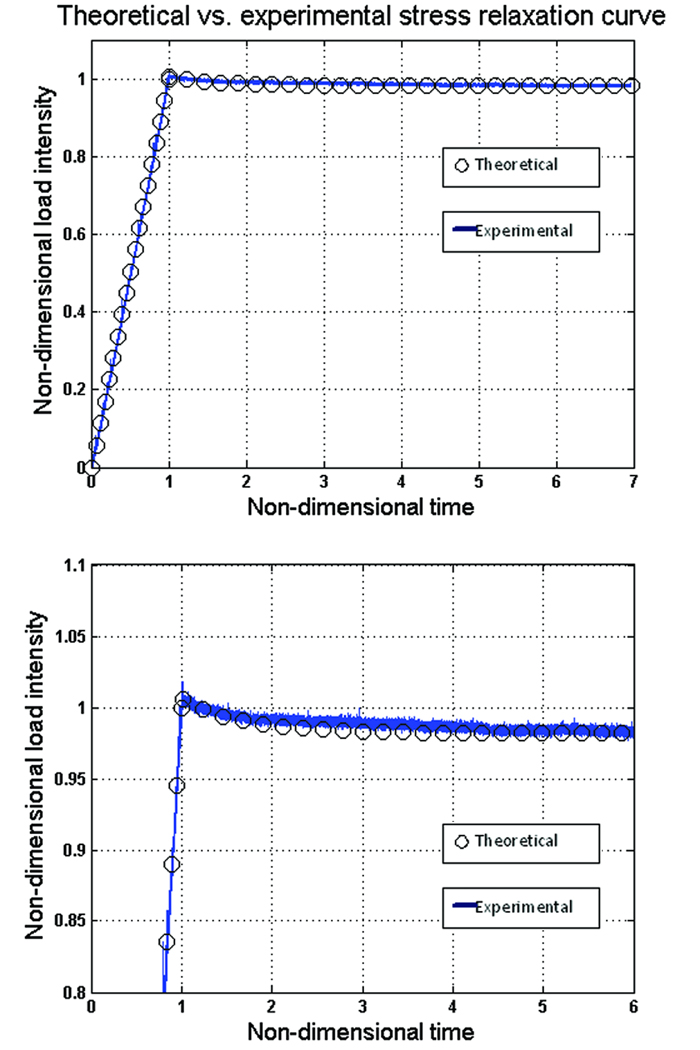
Curve fitting of the theoretical and experimental results of stress relaxation tests to estimate the intrinsic permeability Krr. The curve fitting results have shown a good agreement in the loading period and some deviations in the relaxation period.
Another approach that we examined was to determine all the drained elastic properties and the permeability by curve fitting the analytical results to the experimental data. However, this approach requires assigning some initial values to the drained elastic properties in order to determine the first pole and then using the least square method to estimate the permeability. This approach shows good agreement between the experimental and analytical results in the loading period and less agreement in the relaxation period. The estimated permeability was in the range of O(10−24) − O(10−25). During loading time (ε̇ ≈ 1000 με s−1) the best curve fit was obtained with a permeability value in the range of 2 × 10⁻²⁴ – 3×10⁻²⁴. The five drained elastic properties were estimated to be: Gpa, Gpa, , , and . These values can be compared with the values previously reported in Table 3.
5. DISCUSSION
The presented analysis shows clearly the complexity associated with the determination of the permeability of the PLC porosity. Part of the complexity arises from the size of the osteons and the inherent difficulty to their isolation. The methodology proposed in this paper seems to be less time consuming and as effective as the previous attempts by Ascenzi et al., (1959), (1967), (1985), (1994), Frasca et al., (1976), and Dong et al., (2005). Another component of the problem stems from the complexity of the analytical solution which requires the determination of both the matrix material properties and the drained elastic constants. While the matrix material properties can be determined by acoustic microscopy or nanoindentation (Ashman et al., 1984; Lang, 1970; Huja et al., 2006), the drained elastic properties require recording the deformation in the radial and longitudinal directions on a very small scale. However, in this analysis we used the values for both sets of elastic properties that were reported in Cowin and Mehrabadi (2007). Another approach that we examined was to determine the drained properties by curve fitting the analytical results to the experimental data. Since determination of the poles in Eq. (2) and (3) requires the knowledge a priori of the drained elastic properties, the simultaneous curve fitting of elastic constants and poles was not possible; therefore some of the drained elastic properties are determined by inspection. The permeability value using the same values that are reported in the literature, Table 3, is in the range of O(10−24 m2) when using a large number of poles, and O(10−25 m2) when using only one pole and determining the drained elastic properties by inspection. The second term in Eq. (2) and (3) which contain the poles, has little effect on the curve fitting results and as the poles increase in ascending order the terms keeps decreasing, thus its influence on the results keeps decreasing as well. The reported value for the intrinsic permeability is in a reasonable agreement with some of the previously reported values. Zhang et al., reported a value of 1.47×10⁻²⁰ m2 based on their theoretical work. Smit et al. (2002) have determined the permeability of the osteons by inspection using a comparison of their numerical solution (FEA) to the experimental data reported by Otter et al. (1992); they reported a permeability value of 2.2×10⁻²² m2. More recently Oyen (2008) employed a nanoindentation technique combined with a poroelastic analysis to provide an estimate of the PLC permeability that ranged from 4.1×10⁻²⁴ m2 in water to O(10−26 m2) in polar solvents (methanol, ethanol, acetone). However Oyen employed an incompressible rather than a compressible poroelastic model to obtain the permeability, raising the possibility that her estimate may be smaller than the real value.
The deviation of the experimental results from the analytical predictions in this study arises from the fact that the experimental approach may not fully satisfy all the requirements of the analytical model. The Haversian canal may not be centered in the middle of the osteon as assumed by the analytical solution and may not be fully straight throughout the osteon either. In addition to that, it is extremely difficult to ensure that the top and bottom surfaces of the loaded specimens are completely flat; therefore some shear and bending may occur. The assumption of no friction between the plates and the osteon is a simplification that may not be easy to satisfy at this scale. In the unconfined compression test of articular cartilage, Cohen et al. (1998) reported that a good agreement between the theoretical response and the experimental data could not be obtained in the relaxation stage. They attributed this to confinement effects due to surface adhesion at the tissue-platen interface. The porosity could not be determined in the present analysis by curve fitting, so we adopted the value reported in the literature. The adopted values have an effect on the results. A limitation of the current approach is that the curve fitting was performed for only one parameter (the intrinsic permeability). A more sophisticated approach would consider the drained elastic parameters in the curve fitting algorithm.
ACKNOWLEDGMENT
This work was supported by grants from NSF (NSF/CUNY AGEP # 0450360 and NSF-MRI 0723027). The authors also acknowledge the support from PSC-CUNY Research Award Program (PSC-CUNY-60014-38-39; 69486-00 38 and PSCREG-39-1103), CUNY-LSAMP and NIH 1SC2AG34198-1A1.
References
- Armstrong CG, Lai WM, Mow VC. An Analysis of the Unconfined Compression of Articular Cartilage. ASME J. of Biomech. Engr. 1984;106(2):165–173. doi: 10.1115/1.3138475. [DOI] [PubMed] [Google Scholar]
- Ascenzi A, Bonucci E. The Compressive Properties of Single Osteons. Anat. Rec. 1968;161:377–391. doi: 10.1002/ar.1091610309. [DOI] [PubMed] [Google Scholar]
- Ascenzi A, Fabry C. Technique for Dissection and Measurement of Refractive Index of Osteons. J. Biophy. Biochem. Cytol. 1959;6:139–143. doi: 10.1083/jcb.6.1.139. [DOI] [PMC free article] [PubMed] [Google Scholar]
- Ascenzi A, Baschieri P, Benvenuti A. The Torsional Properties of Single Selected Osteons. ASME J. of Biomech. 1994;27(7):875–884. doi: 10.1016/0021-9290(94)90260-7. [DOI] [PubMed] [Google Scholar]
- Ascenzi M, Benvenuti A, Mango F, Similia R. Mechanical Hysteresis Loops From Single Osteons: Technical Devices and Preliminary Results. ASME J. of Biomech. 1985;18(5):391–398. doi: 10.1016/0021-9290(85)90294-5. [DOI] [PubMed] [Google Scholar]
- Ashman B, Cowin SC, Van Buskirk WC, Rice JC. A Continuous Wave Technique for the Measurement of the Elastic Properties of Cortical Bone. J. of Biomech. 1984;17(5):349–361. doi: 10.1016/0021-9290(84)90029-0. [DOI] [PubMed] [Google Scholar]
- Cohen B, Lai WM, Mow VC. A Transversely Isotropic Biphasic Model for Unconfined Compression of Growth Plate and Chondroepiphysis. ASME J. of Biomech. Engr. 1998;120(4):491–496. doi: 10.1115/1.2798019. [DOI] [PubMed] [Google Scholar]
- Cooper DM, Turinsky AL, Sensen CW, Hallgrímsson B. Quantitative 3D analysis of the canal network in cortical bone by micro-computed tomography. Anat Rec B New Anat. 2003;274(1):169–179. doi: 10.1002/ar.b.10024. [DOI] [PubMed] [Google Scholar]
- Cowin SC, Weinbaum S, Yu Z. A case for bone canaliculi as the anatomical site of strain-generated potentials. J. Biomech. 1995;28:1281–1296. doi: 10.1016/0021-9290(95)00058-p. [DOI] [PubMed] [Google Scholar]
- Cowin SC. Bone Poroelasticity. J. Biomechanics. 1999;32:218–238. doi: 10.1016/s0021-9290(98)00161-4. [DOI] [PubMed] [Google Scholar]
- Cowin SC. Bone Mechanics Handbook. 2nd Edition. CRC Press; 2001. pp. 1–10. [Google Scholar]
- Cowin SC, Mehrabadi MM. Compressible And Incompressible Constituents In Anisotropic Poroelasticity: The Problem of Unconfined Compression of a Disk. J. of the Mechanics and Physics of Solids. 2007;55:161–193. [Google Scholar]
- Currey JD. The Effect of Drying and Re-Wetting on Some Mechanical Properties of Cortical Bone. J. of Biomech. 1988;21(5):439–441. doi: 10.1016/0021-9290(88)90150-9. [DOI] [PubMed] [Google Scholar]
- Dong XN, Zhang X, Guo XE. Interfacial Strength of Cement Lines in Human Cortical Bone. MCB. 2005;2(2):63–68. [PubMed] [Google Scholar]
- Frasca P, Harper RA, JLKatz JL. Isolation of Single Osteons and Osteon Lamellae. Acta Anat. 1976;95:122–129. doi: 10.1159/000144608. [DOI] [PubMed] [Google Scholar]
- Gailani G, Cowin SC. The Unconfined Compression of a Poroelastic Annular Cylindrical Disk. J. of Mech. of Materials. 2008;40(6):507–523. [Google Scholar]
- Goto T, Sasaki N, Hikichi K. Early Stage-Stress Relaxation in Compact Bone. ASME J. of Biomech. 1999;32(1):93–97. doi: 10.1016/s0021-9290(98)00138-9. [DOI] [PubMed] [Google Scholar]
- Hofmann T, Heyroth F, Meinhard H, Franzel W, Raum K. Assessment of Composition and Anisotropic Elastic Properties of Secondary Osteon Lamellae. ASME J. of Biomech. 2006;39(12):2282–2294. doi: 10.1016/j.jbiomech.2005.07.009. [DOI] [PubMed] [Google Scholar]
- Huja SS, Beck FM, Thurman DT. Indentation Properties of Young and Old Osteons. Calcif Tissue Int. 2006;78(6):392–397. doi: 10.1007/s00223-006-0025-3. [DOI] [PubMed] [Google Scholar]
- Lang SB. Ultrasonic Method for Measuring Elastic Coefficients of Bone and Results on Fresh and Dried Bovine Bones. IEEE Trans. Biomed. Eng. 1970;17:101. doi: 10.1109/tbme.1970.4502706. [DOI] [PubMed] [Google Scholar]
- Lei F, Szeri AZ. Inverse Analysis of Constitutive Models: Biological of Soft Tissues. ASME J. of Biomech. 2007;40(4):936–940. doi: 10.1016/j.jbiomech.2006.03.014. [DOI] [PubMed] [Google Scholar]
- Mandel J. Consolidation des sols (étude mathématique) Géotechnique. 1953;3:287–299. [Google Scholar]
- Otter WM, Palemieri VR, Wu DD, Seiz KG, MacGinitie LA, Cochran GVB. A Comparative Analysis of Streaming Potentials in Vivo and in Vitro. J. of Orthopaedic Research. 1992;10:710–719. doi: 10.1002/jor.1100100513. [DOI] [PubMed] [Google Scholar]
- Oyen ML. Poroelastic nanoindentation Responses of Hydrated Bone. J. Mater. Res. 2008;23:1307–1314. [Google Scholar]
- Smit TH, Huyghe JM, Cowin SC. Estimation of the Poroelastic Parameters of Bone. J. Biomechanics. 2002;35:829–836. doi: 10.1016/s0021-9290(02)00021-0. [DOI] [PubMed] [Google Scholar]
- Weinbaum S, Cowin SC, Yu Z. A model for the excitation of osteocytes by mechanical loading-induced bone fluid shear stresses. J. of Biomech. 1994;27:339–360. doi: 10.1016/0021-9290(94)90010-8. [DOI] [PubMed] [Google Scholar]
- Wu JZ, Herzog W. Analysis of the Mechanical Behavior of Chondrocytes in Unconfined Compression Tests for Cyclic Loading. ASME J. of Biomech. 2006;39(4):603–616. doi: 10.1016/j.jbiomech.2005.01.007. [DOI] [PubMed] [Google Scholar]
- Yin L, Elliott DM. A Biphasic and Transversely Isotropic Mechanical Model for Tendon: Application to Mouse Tail Fascicles in Uniaxial Tension. ASME J. of Biomech. 2004;37(6):907–916. doi: 10.1016/j.jbiomech.2003.10.007. [DOI] [PubMed] [Google Scholar]
- Zhang D, Weinbaum S, Cowin SC. Estimates of The Peak Pressures in the Bone Pore Water. J. Biomech. Eng. 1998;120:697–703. doi: 10.1115/1.2834881. [DOI] [PubMed] [Google Scholar]


