

Abstract
Background
Expression cassettes can be inserted at several positions into recombinant adenoviral genomes but the implications of this choice for transgene expression level have not been determined. Knowledge of the relative expression levels of transgenes inserted at different sites in the adenoviral genome is of particular significance for transgene expression monitoring approaches that rely on the concordant expression of a marker transgene inserted elsewhere in the viral genome.
Methods
Three expression cassettes, each comprising a cytomegalovirus promoter driving one of three marker peptides [serum carcinoembryonic antigen (sCEA), beta subunit of human chorionic gonadotropin (βhCG) or human sodium iodide symporter (hNIS)], were inserted into E1, E3 or E4 cloning sites in a recombinant adenoviral vector backbone. High titer stocks of bicistronic adenoviral vectors coding for combinations of marker peptides were prepared. A panel of human cells of various lineages was infected with the vectors and expression ratios of the transgene-encoded proteins were analysed. Serum levels of the soluble proteins and hepatic uptake of radioactive iodine were also compared in vivo in nude rats after intravenous vector infusion.
Results
High concordance of expression between the inserted transgenes was observed in all of the bicistronic vectors irrespective of whether the expression cassettes were placed in the E1, E3 or E4 regions. Concordance was maintained across multiple cell lineages. In vivo, in athymic rats, blood and urine levels of βhCG were highly concordant with serum levels of sCEA at all timepoints after intravenous infusion of the bicistronic vectors encoding both of these soluble markers. Hepatic radioiodine uptake was concordant with serum CEA concentration in mice infused with a bicistronic vector expressing CEA and NIS.
Conclusions
The expression level of a given transgene in an adenoviral vector genome can be accurately and quantitatively inferred from the expression of a marker protein encoded by a second transgene inserted elsewhere in the vector genome.
Keywords: adenoviral vector, βhCG, CEA, gene expression concordance, sodium iodide symporter
Introduction
The profile of therapeutic transgene expression is key to the success of gene therapy. Despite the central importance of the information, direct in vivo measurement of the expression profiles of therapeutic transgenes is rarely accomplished in human studies. This is because the products of most therapeutic transgenes are not amenable to non-invasive monitoring strategies. One approach to this problem is to introduce a second (marker) transgene, whose expression can be accurately and non-invasively monitored, into the gene therapy vector. This approach depends upon the maintenance of a fixed stoichiometric relationship between the levels of expression of the marker polypeptide and the therapeutic protein. This relationship should be reliably maintained in different tissues and cell lineages. Expression profiles vary greatly depending on the nature of the vector, the dose and route of administration, the biology of the target cells, and the specific characteristics of the transgene product. Expression is also impacted by the specific architectural features of each vector, such as the choice of promoter, the use of internal ribosome entry sites and the inclusion of noncoding sequences that signal mRNA destruction. Adenoviruses are extremely popular gene delivery vehicles that are being used extensively in human gene therapy trials. Transgenes can be inserted at several different sites in the adenoviral genome but the concordance of gene expression levels between transgenes inserted at different sites has not been quantitiatively studied. We therefore undertook a comprehensive analysis to explore the relationship between transgene insertion sites and relative expression levels in bicistronic adenoviral vectors.
To facilitate these studies, we made bicistronic adenoviral vectors coding for the soluble extracellular domain of human serum carcinoembryonic antigen (sCEA), the beta subunit of human chorionic gonadotropin (βhCG) and/or the human sodium ioidide symporter (hNIS). Soluble CEA is a 677 amino acid glycoprotein with molecular weight of approximately 180 kDa, has a circulating half life of approximately 36 h in humans or 2–5 h in mice [1,2]. CEA is a cell-associated adhesion molecule, and circulating levels of the soluble form are frequently elevated in a variety of malignancies in which CEA provides an important tumour marker [3]. The normal serum concentration of CEA is less than 5 ng/ml (approximately 25 pmol) and the soluble form of the molecule has no known adverse biological activity and is non-immunogenic. hCG is a placenta-derived glycoprotein hormone composed of an alpha and a beta subunit. The beta subunit comprises 145 amino acids and has a molecular weight of approximately 28 kDa and a circulating half-life of 30 h in humans or 11 h in mice [4,5]. βhCG provides a convenient quantifiable urine or serum marker for diagnosis of pregnancy and for monitoring the growth and regression of trophoblastic tumours [4]. Biological function is lacking when βhCG is expressed without the alpha chain. Most clinical laboratories in hospitals have routine assays that measure CEA or βhCG levels in body fluids. NIS, a cell associated protein, is expressed primarily in the thyroid gland, stomach and salivary tissue [6]. Expression of NIS allows cells to actively transport iodide ions into the cell. The NIS protein has been inserted as a transgene in a number of vector systems, including oncolytic measles virus, conditionally replicating adenoviruses and non-replicating adenoviral and lentivectors [7–11]. Uptake of radioiodine by transduced cells allows precise dosimetric measurements of the levels of NIS protein expression using gamma camera or single-photon emission computed tomography (SPECT)/CT imaging [12].
In the present study, bicistronic Ad5 vectors were constructed by inserting cytomegalovirus (CMV) promoter-driven expression cassettes coding for sCEA, βhCG or hNIS into the E1, E3 or E4 cloning sites of a previously described adenoviral vector platform [13]. The expression levels of these marker transgenes were then investigated in vitro using a panel of human cell lines of different lineages and in vivo in mice and rats after intravenous vector infusion. The conclusion of this study is that the relative level of expression of a given transgene inserted in a recombinant adenovirus can be accurately and quantitatively inferred from the expression of a marker protein encoded by a second transgene inserted elsewhere in the vector genome.
Materials and methods
Cell lines
TE671 human rhabdomyosarcoma (ECACC 89 071 904), A431 human epithelial carcinoma (ATCC CRL-1555), Hela human cervical carcinoma (CCL-2), U87 human glioblastoma (HTB-14), A375 human melanoma (CRL1619), A549 human lung carcinoma (CCL-185), MDA MB 231 human breast carcinoma (HTB-26) and HT1080 human fibrosarcoma (CCL-121) cell lines were grown in Dulbecco’s modified Eagle’s medium supplemented with 10% fetal bovine serum, 100 units/ml penicillin and 1 mg/ml streptomycin in an atmosphere of 5% CO2. All tissue culture reagents were purchased from Invitrogen (Carlsbad, CA, USA).
Plasmids and vectors
For details of construction, see Figure 1. The template DNA was polymerase chain reaction (PCR)-amplified from previously described sCEA, βhCG and hNIS expression constructs [10,14] using Platinum Taq (Invitrogen) as per the manufacturer’s instructions with the pairs of primers: XbahCEA for 5′-TCTAGA ATG GAG TCT CCC TCG GCC-3′ and NotICEArev 5′-GCGGCCGC TTA TCC CTA TGC AGA GAC TG-3′; XbaIhCG for 5′-TCTAGA ATG GAG ATG TTC CAG GGG CTG-3′ and NotIhCGrev 5′-GCGGCCGC TTA TTG CGG GAG GAA CGG GG-3′; and XbaIhNIS for 5′-TCTAGA ATG GAG GCC GTG GAG ACC GGG GAA CG-3′ and NotIhNISrev 5′-GCGGCCGC TTA TCA GAG GTT TGT CTC CTG CTG G-3′;
Figure 1.

Adenoviral vector constructs: (a) Schematic representation of the type 5 adenoviral (Ad5) vector encoding soluble marker peptides, the extracellular N-terminal domain of human CEA or βhCG, or the cell associated NIS. The cDNAs are driven by identical CMV promoters at positions E1, E3 or E4 in the Ad5 vector. (b) Strategy for construction of recombinant adenoviral vectors shown in (a). For narrative, see Materials and methods
The resulting PCR products were cloned into the pCR2.1 vector (Invitrogen) using a TOPO TA cloning kit. The plasmids pCR2.1-sCEA, pCR2.1-βhCG and pCR2.1-hNIS were verified by sequencing, digested with XbaI and NotI, then gel purified and the respective coding fragments were ligated into the XbaI/NotI site of the pHMCMV5R shuttle vector. The plasmids pHMCMV5R-sCEA, pHMCMV5R-βhCG and pHMCMV5R-hNIS were then digested with BglII and their inserts were ligated into the BamHI sitse of the pHM11 and pHM15 shuttle vectors. All the aforementioned shuttle plasmids (pHM48, pHMCMV5, pHM11, pHM15), were kindly provided by Mizuguchi Hiroyuki (Core facility for Therapeutic Vector, Institute of Medical Science, The University of Japan) [12].
For cloning into the E4 and E1 positions of an adenoviral vector construct, XbaI digested pAdHM48 was ligated with AvrII digested pHM15 containing sCEA or βhCG coding sequences. The resulting plasmids pAdHM48-sCEA/βhCG (E4) were digested with I-CeuI and PI-SceI and ligated with ICeuI and PI-SceI digested pHCMV5R containing βhCG/sCEA or hNIS coding sequences.
For cloning into the E3 and E1 positions of an adenoviral vector constructs, Csp451 digested pAdHM48 was ligated with ClaI digested pHM11 containing sCEA/βhCG coding sequences. Next, the resulting plasmid pAdHM48-sCEA/βhCG (E3) was digested with I-CeuIand PI-SceI and ligated with I-CeuI and PI-SceI pHCMV5R containing βhCG/sCEA or hNIS coding sequences.
To rescue recombinant adenoviral vectors, all adenoviral vector constructs were linearized with PacI and purified by phenol–chloroform extraction before transfection into 293 producer cells (Qiagen Polyfect transfection kit; Qiagen, Valencia, CA, USA). After well-developed plaques formed, the cells were harvested and were subjected to three freeze/thaw cycles. The inoculum was subsequently added to 293 cells and the cycle was repeated three times to amplify the virus. The resulting recombinant Adenoviral vectors were propagated in 293 cells, and purified by centrifugation through a CsCl gradient as previously described [15]. The vector stocks were then dialysed against 10% glycerol-phosphate-buffered saline and frozen at −80 °C until use. The adenoviral particle number was determined by measuring optical density at 260 nm [16]. Infectious titer (plaque-forming units per milliliter) was determined by plaque assay using 293 cells. Final titers and particle: infectivity ratios are:
Infectivity assays
The panel of human cell lines was used for the adenoviral vector transduction assays. Cells were infected with viral vector [multiplicity of infection (MOI) = 10] for 3 h in Opti-MEM, washed and regular media replaced. The cells were incubated 48 h and the supernatants were harvested and analysed for CEA or βhCG levels by the Mayo Clinic Central Clinical Laboratories using their routine clinical assay (Bayer Centaur Immunoassay Systems).
Radioiodine uptake assays
Human pancreatic Bx-PC3 cells were transduced with vectors Ad5-NIS1-CEA3 or Ad5-NIS1-βhCG3 at varying MOIs (1, 3, 10, 30 and 100 particles per cell) and, 48 h later, conditioned media were harvested and CEA or βhCG levels were measured. To measure 125I uptake, cells were washed once in warm (37 °C) HBSS (Invitrogen), incubated with 800 μl of warm 10 mm HEPES-HBSS buffer and 100 μl of 125I (approximately 100 000 counts per minute/100 μl). The cells were incubated at 37 °C for 45 min after which medium was aspirated and cells washed in 1 ml of cold HEPES-HBSS. The cells were lysed with 1 ml of 1m NaOH for 15 min and the amount of radioactive uptake by cells was quantified using a Packard Isodata-10 gamma counter [17].
In vivo experiments
All procedures involving research animals were reviewed and approved by the Mayo Clinic Institutional Animal Care and Use Committee. Female athymic rats (5 weeks of age; Taconic Farms, n = 3 per group), were injected intravenously via the tail vein with 500 μl of Ad5 vector (3 × 10¹⁰ vector particles) and, 7 days later, were bled via the tail vein to obtain plasma for measurement of CEA and βhCG levels. Analysis of the soluble marker peptides was performed by the Mayo Central Clinical Laboratory. Urine samples from rats housed in metabolic cages were collected, centrifuged and urine βhCG and creatinine levels were analysed by the Mayo Central Clinical Laboratory. For the imaging studies, mice were injected intravenously with saline (n = 3 mice), or 108 (n = 2 mice), 109 (n = 3 mice) or 1010 (n = 3 mice) vector particles of Ad5-NIS1-CEA3. Three days later, mice were injected with 100 μCi of 125I and imaged 1 h later using micro-SPECT/CT on the X-SPECT Small Animal Imaging System (Gamma Medica-Ideas, Inc., Northridge, CA, USA). Images were analysed using PMOD Biomedical Image Quantification and Kinetic Modelling software (PMOD Technologies, Zurich, Switzerland) and the amount of activity in the region of interest (liver) was calculated as previously described [12]. Briefly, all fused micro-SPECT/CT images were adjusted for equal image intensity and multiple regions of interest were drawn around the liver margin on every CT image in which it was visualized, resulting in a volume of interest. Pixel counts within the liver regions were measured from the coregistered micro-SPECT images. Corresponding total liver pixel counts were converted to activity by using the equation derived from scanning an 125I standard containing a known amount of radioactivity (data not shown). Counts were corrected for radioisotope decay, differences in image acquisition time, and background activity. Mice were euthanized and blood was harvested for analysis of CEA levels. Major organs were harvested and the amount of radioactivity in the organs was measured using a well type dosimeter.
Results
Preparation and characterization of recombinant adenoviral vectors
Three expression cassettes, each comprising a CMV promoter driving one of two marker peptides (sCEA, βhCG), were inserted into E1, E3 or E4 cloning sites in a recombinant Ad5 vector backbone (Figure 1). Additional vector constructs were generated by inserting a CMV promoter-driven hNIS expression cassette into the E1 cloning site with sCEA or βhCG expression cassettes in the E3 region. High titer stocks (>1011 vector particles/ml) of the corresponding bicistronic adenoviral vectors were prepared (Figure 1). Titers and particle to infectivity ratios for the respective vectors are reported in the Materials and methods. Expression of each of the transgenes encoded by each of the bicistronic vectors was confirmed after infection of 293 cells (data not shown).
Ex vivo studies of CEA and βhCG transgene expression from bicistronic adenoviral vectors
A panel of human cells of various lineages (A431 epithelial carcinoma, HeLa cervical carcinoma, U87 glioblastoma, TE671 rhabdomyosarcoma, A375 melanoma, A549 lung carcinoma, MDA MB 231 breast carcinoma and HT1080 fibrosarcoma) was infected with each of the four bicistronic vectors coding for sCEA and βhCG, Ad5-βhCG1-CEA3, Ad5-CEA1-βhCG3, Ad5-βhCG1-CEA4 and Ad5-CEA1-βhCG4 and the concentrations of CEA and βhCG in tissue culture supernatant were measured 48 h later.
For a given cell type, the sCEA and βhCG expression levels were similar from all of the vectors regardless of whether the respective expression cassettes were placed in the E1, E3 or E4 regions (data not shown). However, as expected from the known behaviour of the CMV promoter, the absolute transgene expression levels were found to vary considerably between cells of different lineages. Comparing the concentrations of sCEA and βhCG in each infected cell supernatant, it can be seen that there is a relatively fixed stoichiometric relationship between them (Figure 2). Thus, for all of the vectors tested, expression of the two marker proteins is remarkably concordant. The ratios of the concentrations of the two transgene products remained constant in all cell lineages tested and at different levels of expression (Figures 2a to 2d). The Pearson correlation coefficients (R) ranged between 0.65–0.92. It is also apparent from Figure 2e that the ratio between the marker protein levels was reasonably well maintained irrespective of the placement of the marker transgenes in E1, E3 or E4. Overall, a high concordance of expression between the inserted transgenes was observed in all of the bicistronic vectors for different insertion sites and across multiple cell lineages.
Figure 2.

Concordance between CEA and βhCG expression levels from the corresponding transgenes expressed from CMV promoter driven transcription units, inserted either at the E1 and E3 or at the E1 and E4 positions. A panel of cell lines was transduced with the respective adenoviral vectors and levels of CEA and βhCG in the conditioned media were determined 48 h later using three replicates of each virus/cell line combination. CEA levels are plotted against corresponding βhCG levels, expressed in ng/ml (a) Ad5-CEA1-βhCG3, (b) Ad5-βhCG1-CEA3, (c) Ad5-CEA1-βhCG4, (d) Ad5-βhCG1-CEA4 and (e) composite plot of all data shown in (a) to (d)
Ex vivo analysis of bicistronic adenovirus vectors coding for hNIS and a soluble marker peptide
Human pancreatic cancer cells, Bx-PC3, were infected with bicistronic adenoviral vectors Ad5-NIS1-CEA3 or Ad5-NIS1-βhCG3 at varying MOIs (1, 3, 10, 30 and 100 particles per cell). Radioactive iodine uptake (Figure 3a) and supernatant concentrations of sCEA (Figure 3b) and βhCG (Figure 3c) were measured 48 h later. Specific NIS-mediated radioiodine uptake was calculated by subtracting the background uptake measured in uninfected Bx-PC3 cells (Figure 3a). There is a high concordance between marker peptide levels with the numbers of transduced cells (increasing MOI). 125Iuptake by NIS expressing cells also increased with increasing MOI but reached a plateau at MOI 10, likely due to maximal expression of the NIS transgene at and above this MOI.
Figure 3.
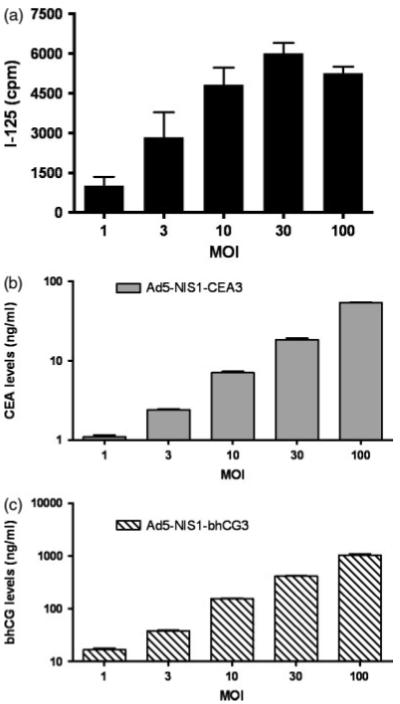
Concordance between marker peptide levels and NIS gene expression levels in Ad5-NIS1-CEA3 or Ad5-NIS1-βhCG3 infected BX-PC3 cells. Bx-PC3 cells were transduced by the respective vectors at different MOI. Forty-eight hours later, (a) radioiodine uptake by the NIS expressing Bx-PC3 cells (mean ± SD, n = 6) and (b) CEA (n = 3, ng/ml) or (c) βhCG (n = 3, ng/ml) marker peptide levels in the culture media were analysed. cpm, counts per minute
In vivo concordance of sCEA and βhCG expression from bicistronic adenoviral vectors
Athymic rats (three per group) were each injected intravenously via the tail vein with 3 × 10¹⁰ particles of Ad5-CEA1-βhCG3, Ad5-βhCG1-CEA3, Ad5-CEA1-βhCG4 or Ad5-βhCG1-CEA4. Blood and urine were collected at baseline prior to vector infusion and weekly thereafter for 5 weeks. Analysis was performed on the plasma for CEA and βhCG and on the urine for βhCG and creatinine. βhCG levels were normalized against creatinine levels to compensate for the difference in urine output [5].
Blood and urine levels of βhCG were highly concordant with serum levels of sCEA at all timepoints after infusion of the sCEA plus βhCG bicistronic vectors in living rats over a very wide range (3 log) of peptide concentrations (Figure 4). In addition, the urine concentrations of βhCG were found to closely parallel the plasma values (Figure 4c) and could be used with some reliability to predict the serum concentrations of CEA expressed from a separate transcription unit in the same vector.
Figure 4.
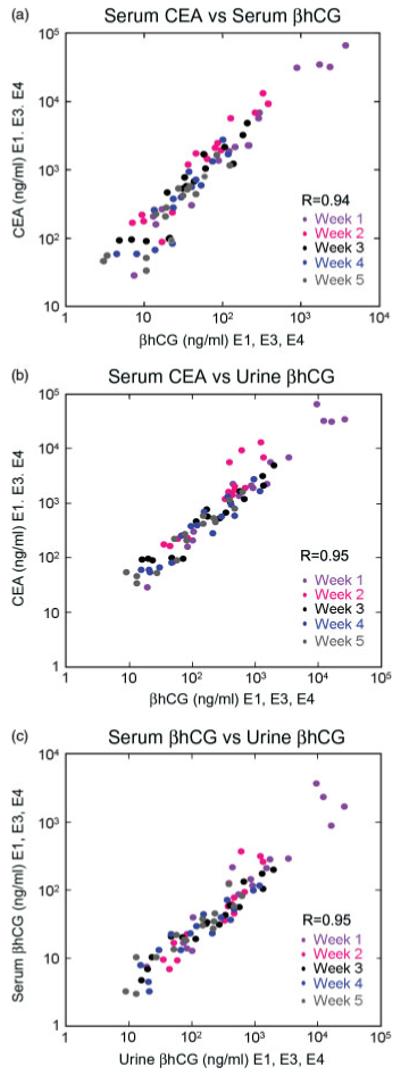
Non-invasive monitoring of relative expression levels of marker peptides expressed from adenoviral vectors given intravenously to athymic rats. Rats (three per group) received 3 × 10¹⁰ particles of Ad5-CEA1-βhCG3, Ad5-βhCG1-CEA3, Ad5-CEA1-βhCG4 or Ad5 βhCG1-CEA4. Levels of marker peptide in the serum (CEA, βhCG) or urine (βhCG) were measured at weekly intervals. (a) serum CEA versus serum βhCG, (b) serum CEA versus urine βhCG or (c) serum βhCG versus urine βhCG
In vivo concordance of hNIS and sCEA expression from a bicistronic adenoviral vector
Athymic mice (three per group) were each injected intravenously via the tail vein with saline or different doses of Ad5-NIS1-CEA3 (108, 109 or 1010 vp per mouse). Three days later, animals were given 100 μCi 125I intraperitoneally and imaged non-invasively 1 h later using micro-SPECT/CT. The animals were also bled for analysis of serum CEA levels. Radioactive uptake in the liver was quantified from the fused micro-SPECT/CT images (Figure 5a) using PMOD software and plotted against the serum CEA levels (Figure 5b). The mice were then euthanized and their livers harvested for direct measurement of radioiodine content by scintillation counting in a well type dosimeter. Serum CEA levels were plotted against the corresponding scintillation counts for each animal (Figure 5c). These data indicate that there is a good correlation and concordance between serum CEA concentration and NIS gene expression, whether determined by image analysis (Pearson correlation coefficient R = 0.97, p < 0.0004; Figure 5b) or actual scintillation counts (R = 0.98, p < 0.0004; Figure 5c).
Figure 5.

Concordant gene expression in the Ad5 vector allows non-invasive monitoring of secreted and cell-associated transgene expression. (a) Representative micro-SPECT/CT images of mice given saline or different doses of Ad5-NIS1-CEA3 at 3 days post vector administration (three mice per group). Note increase in liver signal with increasing vector dose (white arrow). Other organs with high 125I uptake are the thyroid and stomach, which endogenously express NIS, and the bladder via secretion by the kidneys. (b) Plot of corresponding serum CEA levels with the amount of radioactivity in the liver quantified using the PMOD software from the micro-SPECT/CT images or (c) from actual scintillation measurements of the harvested liver in a dose calibrator
Discussion
In the present study, we have shown that the performance of an expression cassette inserted into the adenoviral vector genome is minimally affected by the choice of insertion site. The vector platform employed for these studies is a recombinant adenovirus, serotype 5 that carries three convenient cloning sites for the insertion of foreign transgenes: one at the site of an E1 deletion, one at the site of an E3 deletion and one between E4 and the 3′ inverted terminal repeats (13). Expression levels were almost identical for CMV promoter/enhancer-driven sCEA and βhCG marker transgenes, irrespective of whether they were inserted at the E1, E3 and/or E4 positions. As would be predicted from these findings, there was a fixed stoichiometric relationship between the expression levels of distinct CMV promoter-driven transgenes inserted at different sites in this adenoviral vector genome. These data held true across a panel of human cell lines derived from various different human tissues and the stoichiometric relationship was maintained in vivo after the vectors were administered intravenously to athymic rats. All three of the transgenes that were investigated are amenable to non-invasive in vivo expression monitoring, either by measuring blood and urine levels of their encoded polypeptides (sCEA and βhCG) or by gamma camera and SPECT imaging of radioiodine uptake by cells expressing the hNIS transgene. Each of the three transgenes that were investigated was selected because of its potential suitability for human clinical studies (i.e. inertness and lack of immunogenicity in humans). Overall, the data confirm that the expression level of a therapeutic transgene inserted in an adenoviral vector can be accurately and quantitatively inferred from the expression of a marker gene inserted elsewhere in the vector genome.
The clinical advancement of gene therapy will be greatly facilitated if pharmacokinetic data on the profiles of transgene expression can be obtained in human subjects [14,18]. Ideally, it should be possible to determine the number, distribution and fate of the genetically modified cells in each treated patient and the profile of transgene expression over time. The dose of vector administered is not a reliable indicator of the numbers of cells that will be transduced, nor of the level at which the therapeutic gene will be expressed because vector biodistribution, gene transfer efficiency, gene expression level and the fate of the genetically modified cells have proven to be highly variable between individuals and with repeat dosing [19–21]. Mapping the distribution of genetically modified cells for most therapeutic transgenes requires euthanasia and thorough post-mortem analysis of all tissues using in situ hybridization, immunohistochemical analysis, or determination of enzymatic activity in tissue extracts. Although the expression of cell-associated transgenes can be monitored by immunohistochemical or other analysis of tissue biopsies obtained from the site of gene transfer [22–25], this method is far from satisfactory because the biopsy that is subjected to analysis is essentially a random sample from an area of non-uniform gene delivery. Also, there is a limit to the number of times that a given tissue can be biopsied, particularly for essential tissues such as the heart. In a few examples where the transgene product (e.g. thymidine kinase, sodium iodide symporter) is able to uptake or metabolize radionuclide-conjugated substrates, non-invasive SPECT or PET imaging has been used to map the distribution of transgene expression [26–29]. However, for most transgenes, this approach is not possible.
Even the issue of monitoring for secreted transgenes is not necessarily straightforward. In some cases, the secreted protein is retained in the tissues through a heparin binding or matrix attachment region or through its interaction with its naturally occurring receptor. Thus, human cardiovascular gene therapy studies, employing vectors encoding for vascular endothelial growth factor or fibroblast growth factor-4, were associated with transient or undetectable circulating levels of the protein [30–32]. In addition, the soluble protein encoded by the transgene may be indistinguishable from its naturally occurring counterpart. This is a problem in cancer gene therapy studies where immunostimulatory cytokines, such as interleukin (IL)-2, granulocyte-macrophage-colony-stimulatng factor and IL-12 expressed from a transgene delivered in the tumour microenvironment cannot be distinguished from the same cytokines expressed from activated macrophages and lymphocytes that are part of an inflammatory response against the vector. An additional problem is that the soluble transgene encoded protein may be the target of a humoral immune response that causes a precipitous fall in its circulating level giving the misleading impression that its production is attenuated [33]. Occasionally, however, the expression profile of a secreted transgene product can be conveniently monitored by serial measurements of the protein concentration in peripheral blood. For example, circulating levels of factor VIII [34] or factor IX [33] have been monitored in studies of gene therapy for haemophilia, and circulating levels of erythropoietin have been monitored in studies of gene therapy for certain types of anemia [35]. Provided that the half-life of the secreted polypeptide in the circulation remains constant throughout the course of the experiment, then changes in its concentration can be plotted against time to provide an accurate profile of the expression kinetics of the therapeutic transgene.
Many excellent studies have described how the expression of an otherwise unmeasurable transgene product can be monitored indirectly by tracking a marker protein expressed from the same vector backbone [14,36–42]. Several soluble marker peptides have proven their worth in this regard, such as secreted alkaline phosphatase, alphafetoprotein, βhCG and sCEA [14,37–39]. In choosing a suitable marker polypeptide, the key parameters to consider are its antigenic potential, biological activity, ease of detection in body fluids, baseline circulating levels and kinetics of elimination from the body.
Non-invasive imaging methods of transgene expression monitoring may be less sensitive compared to the detection of soluble marker peptides but they do offer the considerable advantage of providing information on the anatomical location of the gene-modified cells [40,42]. Several transgenes have been used to date for transgene expression mapping. Bioluminescence imaging of luciferase expression (firefly or Gaussia) and biofluorescence imaging of green fluorescence protein or its derivative proteins has proven to be a very convenient ‘high throughput’ approach for expression mapping in laboratory mice but is unsuitable for larger animals because of the limited path length and poor tissue penetration of photons in these species. Planar gamma camera and three-dimensional SPECT or positron emission tomography imaging have been used to track the expression of dopamine and somatostatin receptors (using gamma-radiolabeled ligands), the iodide symporter NIS (using radioiodine isotopes) and the expression of HSV thymidine kinase (using a positron emitting substrate for this enzyme). Unlike optical imaging, these radioisotopic imaging modalities are not limited by inadequate tissue penetration and are therefore applicable in human gene therapy studies.
In summary, the data obtained in the present study demonstrate that the expression level of a therapeutic transgene in an adenoviral vector genome can be accurately and quantitatively inferred from the expression of a marker protein encoded by a second transgene inserted elsewhere in the vector genome.
Acknowledgements
This work was supported by an NIH-NHLBI grant to S.J.R. (P01 HL669258).
References
- 1.Yoshimasu T, Maebeya S, Suzuma T, et al. Disappearance curves for tumor markers after resection of intrathoracic malignancies. Int J Biol Markers. 1999;14:99–105. doi: 10.1177/172460089901400207. [DOI] [PubMed] [Google Scholar]
- 2.Martin K, Halpern S. Carcinoembryonic antigen production, secretion, and kinetics in BALB/c mice and a nude mouse-human tumor model. Cancer Res. 1984;44:5475–5481. [PubMed] [Google Scholar]
- 3.Go V. Carcinoembryonic antigen: clinical application. Cancer. 1976;37:562–566. doi: 10.1002/1097-0142(197601)37:1+<562::aid-cncr2820370721>3.0.co;2-0. [DOI] [PubMed] [Google Scholar]
- 4.Bidart J-M, Thuillier F, Augereau C, et al. Kinetics of serum tumor marker concentrations and usefulness in clinical monitoring. Clin Chem. 1999;45:1695–1707. [PubMed] [Google Scholar]
- 5.Shih I-M, Torrance C, Sokoll L, et al. Assessing tumors in living animals through measurement of urinary β-human chorionic gonadotropin. Nat Med. 2000;6:711–714. doi: 10.1038/76299. [DOI] [PubMed] [Google Scholar]
- 6.Dadachova E, Carrasco N. The Na/I symporter (NIS): imaging and therapeutic applications. Semin Nucl Med. 2004;34:23–31. doi: 10.1053/j.semnuclmed.2003.09.004. [DOI] [PubMed] [Google Scholar]
- 7.Dwyer RM, Bergert ER, O’Connor MK, et al. Adenovirus-mediated and targeted expression of the sodium-iodide symporter permits in vivo radioiodide imaging and therapy of pancreatic tumors. Hum Gene Ther. 2006;17:661–668. doi: 10.1089/hum.2006.17.661. [DOI] [PubMed] [Google Scholar]
- 8.Spitzweg C, Morris JC. Gene therapy for thyroid cancer: current status and future prospects. Thyroid. 2004;14:424–434. doi: 10.1089/105072504323150732. [DOI] [PubMed] [Google Scholar]
- 9.Dingli D, Diaz RM, Bergert ER, et al. Genetically targeted radiotherapy for multiple myeloma. Blood. 2003;102:489–496. doi: 10.1182/blood-2002-11-3390. [DOI] [PubMed] [Google Scholar]
- 10.Dingli D, Peng KW, Harvey ME, et al. Image-guided radiovirotherapy for multiple myeloma using a recombinant measles virus expressing the thyroidal sodium iodide symporter. Blood. 2004;103:1641–1646. doi: 10.1182/blood-2003-07-2233. [DOI] [PubMed] [Google Scholar]
- 11.Siddiqui F, Barton KN, Stricker HJ, et al. Design considerations for incorporating sodium iodide symporter reporter gene imaging into prostate cancer gene therapy trials. Hum Gene Ther. 2007;18:312–322. doi: 10.1089/hum.2006.131. [DOI] [PubMed] [Google Scholar]
- 12.Carlson SK, Classic KL, Hadac EM, et al. In vivo quantitation of intratumoral radioisotope uptake using micro-single photon emission computed tomography/computed tomography. Mol Imaging Biol. 2006;8:324–332. doi: 10.1007/s11307-006-0058-z. [DOI] [PubMed] [Google Scholar]
- 13.Mizuguchi H, Xu ZL, Sakurai F, et al. Tight positive regulation of transgene expression by a single adenovirus vector containing the rtTA and tTS expression cassettes in separate genome regions. Hum Gene Ther. 2003;14:1265–1277. doi: 10.1089/104303403767740803. [DOI] [PubMed] [Google Scholar]
- 14.Peng KW, Facteau S, Wegman T, et al. Non-invasive in vivo monitoring of trackable viruses expressing soluble marker peptides. Nat Med. 2002;8:527–531. doi: 10.1038/nm0502-527. [DOI] [PubMed] [Google Scholar]
- 15.Kanegae Y, Makimura M, Saito I. A simple and efficient method for purification of infectious recombinant adenovirus. Jpn J Med Sci Biol. 1994;47:157–166. doi: 10.7883/yoken1952.47.157. [DOI] [PubMed] [Google Scholar]
- 16.Nyberg-Hoffman C, Shabram P, Li W, et al. Sensitivity and reproducibility in adenoviral infectious titer determination. Nat Med. 1997;3:808–811. doi: 10.1038/nm0797-808. [DOI] [PubMed] [Google Scholar]
- 17.Hasegawa K, Pham L, O’Connor MK, et al. Dual therapy of ovarian cancer using measles viruses expressing carcinoembryonic antigen and sodium iodide symporter. Clin Cancer Res. 2006;12:1868–1875. doi: 10.1158/1078-0432.CCR-05-1803. [DOI] [PubMed] [Google Scholar]
- 18.Serganova I, Ponomarev V, Blasberg R. Human reporter genes: potential use in clinical studies. Nucl Med Biol. 2007;34:791–807. doi: 10.1016/j.nucmedbio.2007.05.009. [DOI] [PubMed] [Google Scholar]
- 19.Harvey B, Hackett N, El-Sawy T, et al. Variability of human systemic humoral immune responses to adenovirus gene transfer vectors administered to different organs. J Virol. 1999;73:6729–6742. doi: 10.1128/jvi.73.8.6729-6742.1999. [DOI] [PMC free article] [PubMed] [Google Scholar]
- 20.Li D, Duan L, Freimuth P, et al. Variability of adenvovirus receptor density influences gene transfer efficiency and therapeutic response in head and neck cancer. Clin Cancer Res. 1999;5:4175–4181. [PubMed] [Google Scholar]
- 21.Zabner J, Ramsey B, Meeker D, et al. Repeat administration of an adenovirus vector encoding cystic fibrosis transmembrane conductance regulator to the nasal epithelium of patients with cystic fibrosis. JClin Invest. 1996;97:1504–1511. doi: 10.1172/JCI118573. [DOI] [PMC free article] [PubMed] [Google Scholar]
- 22.Fairman J, Roche L, Pieslak I, et al. Quantitative RT-PCR to evaluate in vivo expression of multiple transgenes using a common intron. Biotechniques. 1999;27:572–574. doi: 10.2144/99273rr04. [DOI] [PubMed] [Google Scholar]
- 23.Gambhir S, Barrio J, Herschman H, et al. Assays for noninvasive imaging of reporter gene expression. Nuclear Med Biol. 1999;26:481–490. doi: 10.1016/s0969-8051(99)00021-9. [DOI] [PubMed] [Google Scholar]
- 24.Gussoni E, Wang Y, Fraefel C, et al. A method to codetect introduced genes and their products in gene therapy protocols. Nat Biotechnol. 1996;14:1012–1016. doi: 10.1038/nbt0896-1012. [DOI] [PubMed] [Google Scholar]
- 25.Tada M, Sakuma S, Iggo R, et al. Monitoring adenviral p53 tansduction efficiency by yeast functional assay. Gene Therapy. 1998;5:339–344. doi: 10.1038/sj.gt.3300605. [DOI] [PubMed] [Google Scholar]
- 26.Gambhir S, Bauer E, Black M, et al. A mutant herpes simplex virus type 1 thymidine kinase reporter gene shows improved sensitivity for imaging reporter gene expression with positron emission tomography. Proc Natl Acad Sci USA. 2000;14:2785–2790. doi: 10.1073/pnas.97.6.2785. [DOI] [PMC free article] [PubMed] [Google Scholar]
- 27.Jacobs A, Tjuvajev JG, Dubrovin M, et al. Positron emission tomography-based imaging of transgene expression mediated by replication-conditional, oncolytic herpes simplex virus type 1 mutant vectors in vivo. Cancer Res. 2001;61:2983–2995. [PubMed] [Google Scholar]
- 28.Dingli D, Kemp BJ, O’Connor MK, et al. Combined I-124 positron emission tomography/computed tomography imaging of NIS gene expression in animal models of stably transfected and intravenously transfected tumor. Mol Imaging Biol. 2006;8:16–23. doi: 10.1007/s11307-005-0025-0. [DOI] [PubMed] [Google Scholar]
- 29.Groot-Wassink T, Aboagye EO, Glaser M, et al. Adenovirus biodistribution and noninvasive imaging of gene expression in vivo by positron emission tomography using human sodium/iodide symporter as reporter gene. Hum Gene Ther. 2002;13:1723–1735. doi: 10.1089/104303402760293565. [DOI] [PubMed] [Google Scholar]
- 30.Baumgartner I, Pieczek A, Manor O, et al. Constitutive expression of phVEGF165 after intramuscular gene transfer promotes collateral vessel development in patients with critical limb ischemia. Circulation. 1998;97:1114–1123. doi: 10.1161/01.cir.97.12.1114. [DOI] [PubMed] [Google Scholar]
- 31.Rosengart T, Lee L, Patel S, et al. Angiogenesis gene therapy: phase I assessment of direct intramyocardial administration of an adenovirus vector expressing VEGF121 cDNA to individuals with clinically significant severe coronary artery disease. Circulation. 1999;100:468–474. doi: 10.1161/01.cir.100.5.468. [DOI] [PubMed] [Google Scholar]
- 32.Laitinen M, Hartikainen J, Hiltunen M, et al. Catheter-mediated vascular endothelial growth factor gene transfer to human coronary arteries after angioplasty. Human Gene Ther. 2000;11:263–270. doi: 10.1089/10430340050016003. [DOI] [PubMed] [Google Scholar]
- 33.Lozier J, Metzger M, Donahue R, et al. Adenovirus-mediated expression of human coagulation factor IX in the rhesus macaque is associated with dose-limiting toxicity. Blood. 1999;94:3968–3975. [PubMed] [Google Scholar]
- 34.VandenDriessche T, Vanslembrouck V, Goovaerts I, et al. Long-term expression of human coagulation factor VIII and correction of hemophilia A after in vivo retroviral gene transfer in factor VIII-deficient mice. Proc Natl Acad Sci USA. 1999;96:10379–10384. doi: 10.1073/pnas.96.18.10379. [DOI] [PMC free article] [PubMed] [Google Scholar]
- 35.Ye X, Rivera V, Zoltick P, et al. Regulated delivery of therapeutic proteins after in vivo somatic cell gene transfer. Science. 1999;283:88–91. doi: 10.1126/science.283.5398.88. [DOI] [PubMed] [Google Scholar]
- 36.Ray S, Paulmurugan R, Patel MR, et al. Noninvasive imaging of therapeutic gene expression using a bidirectional transcriptional amplification strategy. Mol Ther. 2008;16:1848–1856. doi: 10.1038/mt.2008.180. [DOI] [PMC free article] [PubMed] [Google Scholar]
- 37.Bartoli M, Poupiot J, Goyenvall A, et al. Noninvasive monitoring of therapeutic gene transfer in animal models of muscular dystrophies. Gene Ther. 2006;13:20–28. doi: 10.1038/sj.gt.3302594. [DOI] [PubMed] [Google Scholar]
- 38.Maelandsmo GM, Ross PJ, Pavliv M, et al. Use of a murine secreted alkaline phosphatase as a non-immunogenic reporter gene in mice. J Gene Med. 2005;7:307–315. doi: 10.1002/jgm.666. [DOI] [PubMed] [Google Scholar]
- 39.Zoltick P, Wilson J. A quantitative nonimmunogenic transgene product for evaluating vectors in nonhuman primates. Mol Ther. 2000;2:657–659. doi: 10.1006/mthe.2000.0204. [DOI] [PubMed] [Google Scholar]
- 40.Hwang do W, Kang JH, Chang YS, et al. Development of a dual membrane protein reporter system using sodium iodide symporter and mutant dopamine D2 receptor transgenes. JNucl Med. 2007;48:588–595. doi: 10.2967/jnumed.106.036533. [DOI] [PubMed] [Google Scholar]
- 41.Dingli D, Bergert ER, Bajzer Z, et al. Dynamic iodide trapping by tumor cells expressing the thyroidal sodium iodide symporter. Biochem Biophys Res Commun. 2004;325:157–166. doi: 10.1016/j.bbrc.2004.09.219. [DOI] [PubMed] [Google Scholar]
- 42.Herschman HR. PET reporter genes for noninvasive imaging of gene therapy, cell tracking and transgenic analysis. Crit Rev Oncol Hematol. 2004;51:191–204. doi: 10.1016/j.critrevonc.2004.04.006. [DOI] [PubMed] [Google Scholar]