Abstract
Objective:
To investigate the added value of hippocampal atrophy rates over whole brain volume measurements on MRI in patients with Alzheimer disease (AD), patients with mild cognitive impairment (MCI), and controls.
Methods:
We included 64 patients with AD (67 ± 9 years; F/M 38/26), 44 patients with MCI (71 ± 6 years; 21/23), and 34 controls (67 ± 9 years; 16/18). Two MR scans were performed (scan interval: 1.8 ± 0.7 years; 1.0 T), using a coronal three-dimensional T1-weighted gradient echo sequence. At follow-up, 3 controls and 23 patients with MCI had progressed to AD. Hippocampi were manually delineated at baseline. Hippocampal atrophy rates were calculated using regional, nonlinear fluid registration. Whole brain baseline volumes and atrophy rates were determined using automated segmentation and registration tools.
Results:
All MRI measures differed between groups (p < 0.005). For the distinction of MCI from controls, larger effect sizes of hippocampal measures were found compared to whole brain measures. Between MCI and AD, only whole brain atrophy rate differed significantly. Cox proportional hazards models (variables dichotomized by median) showed that within all patients without dementia, hippocampal baseline volume (hazard ratio [HR]: 5.7 [95% confidence interval: 1.5–22.2]), hippocampal atrophy rate (5.2 [1.9–14.3]), and whole brain atrophy rate (2.8 [1.1–7.2]) independently predicted progression to AD; the combination of low hippocampal volume and high atrophy rate yielded a HR of 61.1 (6.1–606.8). Within patients with MCI, only hippocampal baseline volume and atrophy rate predicted progression.
Conclusion:
Hippocampal measures, especially hippocampal atrophy rate, best discriminate mild cognitive impairment (MCI) from controls. Whole brain atrophy rate discriminates Alzheimer disease (AD) from MCI. Regional measures of hippocampal atrophy are the strongest predictors of progression to AD.
GLOSSARY
- AD
= Alzheimer disease;
- BET
= brain extraction tool;
- CI
= confidence interval;
- df
= degrees of freedom;
- FTLD
= frontotemporal lobar degeneration;
- HR
= hazard ratio;
- MCI
= mild cognitive impairment;
- MMSE
= Mini-Mental State Examination;
- NBV
= normalized brain volume;
- PBVC
= percentage brain volume change;
- ROI
= region of interest;
- VaD
= vascular dementia;
- VAT
= visual association test.
Underlying clinical progression in Alzheimer disease (AD) are neuropathologic changes that follow a pattern of regional spread throughout the brain, starting at the medial temporal lobe and gradually affecting other parts of the cerebral cortex in later stages.1 Especially with the prospect of disease-modifying therapies, early detection and monitoring of progression are important research goals in AD. Two frequently studied in vivo markers for diagnosis and disease progression in AD are whole brain atrophy and hippocampal atrophy on MRI. Both whole brain atrophy2–4 and hippocampal atrophy4 distinguish patients with AD from controls and correlate with cognitive decline.5,6 Within patients with mild cognitive impairment (MCI), hippocampal atrophy predicts future progression to AD,7,8 and in a recent study, we showed that whole brain atrophy rate distinguished groups and predicted progression to dementia in a cohort of patients with AD, patients with MCI, and controls.9 Former studies mostly focused on either hippocampal or whole brain measurements in isolation. There are few studies that directly compared the predictive value of hippocampal and whole brain measures, and they yield inconsistent results.3,10 The discrepancy between studies may in part reflect technical difficulties in measuring change, especially for the hippocampal region, which is often determined using manual outlining. In the present study, we applied a novel, semiautomated regional registration method to measure hippocampal atrophy rate that was shown to be superior to manual segmentation.11 We directly compare the hippocampal atrophy rates with whole brain volume measurements and hippocampal baseline volume in the same sample.
METHODS
Patients and clinical assessment.
We studied a cohort of 154 subjects attending our memory clinic with a diagnosis of probable AD or MCI as well as controls from whom we had obtained serial MRI scans. Patients with evidence of other (concomitant) disease on MRI (n = 7) or with insufficient scan quality (n = 5) were excluded. In total, 142 patients were available for the present study: 64 patients with AD, 44 patients with MCI, and 34 controls; this control group consisted of 26 patients with subjective complaints and 8 healthy volunteers. The study was approved by the institutional ethical committee and all subjects or their caregivers gave written informed consent for their clinical and MRI data to be used for research purposes.
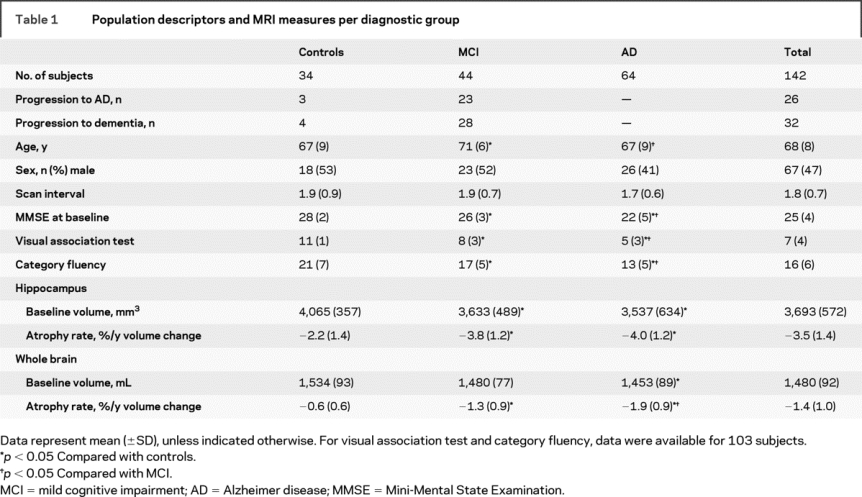
All patients underwent a standardized clinical assessment, including medical history taking, neurologic examination, neuropsychological examination, and MRI. Diagnoses were made in a multidisciplinary consensus meeting. National Institute of Neurological and Communicative Disorders and Stroke–Alzheimer’s Disease and Related Disorders Association criteria12 were used for the diagnosis of AD. Subjects with MCI met the Petersen criteria,13 based on subjective and objective cognitive impairment, predominantly affecting memory, in the absence of dementia or significant functional loss, with a Clinical Dementia Rating14 of 0.5. Visual association test (VAT)15 was used to assess memory. Language and executive functioning were tested using the category fluency test, where patients had to produce the names of as many animals as possible within 1 minute. Activities of daily living were assessed by an interview, structured by the Instrumental Activities of Daily Living Scale.16 The group of controls contained patients presenting with cognitive complaints in the absence of cognitive deficits on neuropsychological examination. We additionally included volunteers without memory complaints, mostly caregivers of patients visiting our memory clinic. Because there were no differences in age, sex, baseline Mini-Mental State Examination (MMSE), or scan interval between patients with subjective complaints and volunteers, these two groups were pooled into one group (controls). Baseline demographic and clinical data by diagnostic group are shown in table 1. Patients with MCI were slightly older than patients with AD and controls. There were no differences between groups in the distribution of sex or the length of the scan interval.
Table 1 Population descriptors and MRI measures per diagnostic group
Participants without dementia (MCI and controls) visited the memory clinic annually. At follow-up visit, diagnostic classification was reevaluated according to published consensus criteria. Within the group of patients with MCI, 23 progressed to AD during follow-up, and 5 were diagnosed with another type of dementia: 2 with vascular dementia (VaD),17 two with frontotemporal lobar degeneration (FTLD),18 and 1 with dementia with Lewy bodies.19 Of the controls, 3 subjects progressed to AD during follow-up and 1 progressed to FTLD.
MRI scan acquisition and image processing.
MRI scans were acquired at 1.0 Tesla (Siemens Magnetom Impact Expert System, Siemens AG, Erlangen, Germany). All patients were actively invited for a follow-up MRI scan, using the same scanner and exactly the same scan protocol. Mean ± SD scan interval was 1.8 ± 0.7 years. Scan protocol included a coronal, three-dimensional, heavily T1-weighted single slab volume sequence (magnetization-prepared, rapid acquisition gradient echo sequence); rectangular 250 mm field of view with a 256 × 256 matrix; 1.5 mm slice thickness; 168 slices; 1 × 1 mm in plane resolution; repetition time = 15 msec; echo time = 7 msec; inversion time = 300 msec; flip angle 15º.
Baseline three-dimensional T1-weighted volume scans were reformatted in 2 mm slices (in plane resolution 1 × 1 mm) perpendicular to the long axis of the left hippocampus. Hippocampi on both sides were manually delineated using the software package Show_Images 3.7.0 (in-house developed at VU University Medical Center, 2003), by three trained technicians (coefficients of variation: interrater <8%, intrarater <5%). The technicians were blinded to diagnosis. Previously described criteria were used for the segmentation of the hippocampus.20,21 The region of interest (ROI) includes the dentate gyrus, cornu ammonis, subiculum, fimbriae, and alveus. Baseline hippocampal volume was calculated by multiplying the total area of all ROIs of each hippocampus by slice thickness. Baseline hippocampal volumes were adjusted for intracranial volume, using the scaling factor derived from SIENAX (see below).
For the measurement of hippocampal atrophy rate, regional nonlinear fluid registration was used.22–24 First, a global, linear brain to brain registration (6 degrees of freedom [df]) was performed using visual register, the in-house developed registration tool. Subsequently, the software package MIDAS25 was used to perform two consecutive regional registration steps. A local 6-df registration was performed to further align the hippocampal region on baseline and repeat scans. Subsequently, a cuboid extending 16 voxels in all three perpendicular directions from the extreme margins of the baseline hippocampal ROI was applied to the baseline and locally registered follow-up scan. A linear intensity drop-off was created in the outer 8 voxels of this cuboid to facilitate the nonlinear registration. Finally, nonlinear fluid registration was performed within the same region, as described previously.11 The volume change was calculated by quantification of the Jacobian values, derived from the deformation matrix. This quantification was restricted to voxels within the baseline hippocampal region that showed contraction at follow-up.11 Atrophy rate was expressed as percentage change from baseline volume.
Normalized brain volume (NBV) and percentage brain volume change (PBVC) over time were calculated from the three-dimensional T1-weighted images, as previously described,9 using SIENAX (structural image evaluation, using normalization, of atrophy, cross-sectional) and SIENA (structural image evaluation, using normalization, of atrophy), both part of FMRIB’s Software Library (http://www.fmrib.ox.ac.uk/analysis/research/siena/).26 In short, brain extraction tool (BET) was used to create brain and skull masks for the baseline and follow-up images. A scaling factor was derived from an affine (12 df) registration of the baseline brain to a reference image (MNI-15227), using the skull to constrain the scaling and skew. NBV was derived from a tissue-type segmentation of brain tissue, using the scaling factor to normalize the baseline brain volume. For PBVC, baseline and follow-up images were registered halfway to each other. Tissue-type segmentation was performed, and the brain surface was estimated on both scans based on the border between brain and CSF. The displacement of follow-up brain surface compared with baseline was calculated as the edge-point displacement perpendicular to the surface. Subsequently, the mean edge-point displacement was converted into a global estimate of PBVC.
Statistical analyses.
Statistical analyses were performed using SPSS 15.0 for Windows. Atrophy rates were divided by scan interval to obtain annualized atrophy rates. For hippocampal measures, we used the mean of left and right values. Differences between groups for categorical variables were assessed using χ2 tests. Analysis of variance, corrected for age and sex, was used to assess differences between groups for continuous variables. Post hoc analysis of between-group differences was performed using t tests with Bonferroni correction. To compare sensitivity to the contrasts between controls and MCI and between MCI and AD, effect sizes were calculated using the difference of the means, divided by root of the mean square error of the difference (adapted from Cohen d, to adjust for group differences in variance). Partial correlations, controlling for age and sex, were performed between MRI measures and baseline scores on cognitive tests. Subsequently, we estimated the risk of progression, related to the four measures, using Cox proportional hazards models. The MRI measures were dichotomized, based on their median value (hippocampal baseline volume 3,652 mm3, atrophy rate −3.3%/year; whole brain baseline volume 1,487 mL, atrophy rate −0.3%/year). Primary outcome was progression to AD, excluding six patients who progressed to another type of dementia. Each MRI measure was entered separately, unadjusted for covariates (model 1), adjusted for age, sex, and MMSE (model 2), and together with age, sex, MMSE, and the other MRI variables (model 3). We repeated the Cox regression analysis with progression to dementia as outcome, including all patients. Finally, to explore the combined effect of baseline volume and atrophy rates within the subjects without dementia, we constructed four groups by median values of each variable: 1) high baseline volume and low atrophy rate, 2) high baseline volume and high atrophy rate, 3) low baseline volume and low atrophy rate, and 4) low baseline volume and high atrophy rate. These were entered as categorical variables into the analysis, together with the covariates age, sex, and MMSE. All Cox regression analyses were performed within all patients without dementia and within patients with MCI separately.
RESULTS
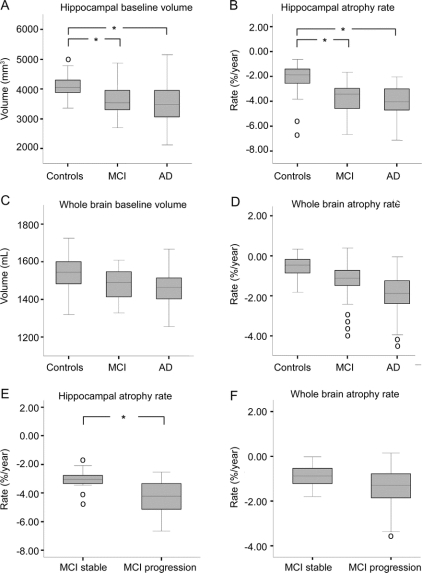
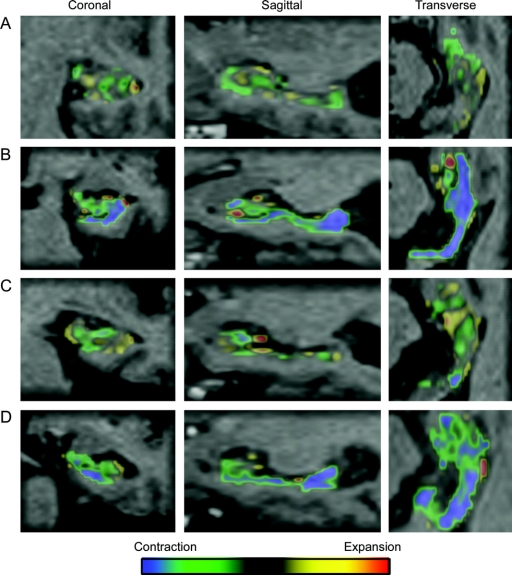
Baseline volumes and atrophy rates for each diagnostic group are presented in table 1. Figure 1 represents box plots of the four MRI markers per diagnostic group and atrophy rates in patients with MCI who remained stable and had progressed to AD at follow-up. Adjusted for age and sex, all four MRI markers differed between groups (p < 0.005). Post hoc analyses with Bonferroni correction (adjusted for age and sex) showed that all four MRI markers differed between controls and patients with AD (p < 0.005). Patients with MCI had lower hippocampal baseline volumes and higher hippocampal atrophy rates than controls (p < 0.005), but hippocampal baseline volumes and atrophy rates did not distinguish patients with AD from patients with MCI. Figure 2 shows individual examples of the regional fluid registration. The two outliers with the highest hippocampal atrophy rate in controls (figure 1B) represent two subjects who had progressed to AD at follow-up. Baseline whole brain volume did not differ between controls and patients with MCI or between patients with MCI and patients with AD. In contrast, whole brain atrophy rates were higher in patients with MCI than in controls (p < 0.005), and were again higher in patients with AD (p < 0.005). The four outliers with highest whole brain atrophy rate within MCI (figure 1D) had progressed to either AD (n = 3) or FTLD (n = 1) at follow-up. Patients with MCI who had progressed to AD at follow-up showed higher hippocampal atrophy rates than patients with MCI who remained stable (figure 1E), and there was no difference for whole brain atrophy rate (figure 1F).
Figure 1 Mean volumes and atrophy rates
Box plots of (A) baseline hippocampal volume, (B) hippocampal atrophy rate, (C) baseline whole brain volume, and (D) whole brain atrophy rate per diagnostic group (controls, mild cognitive impairment [MCI], and Alzheimer disease [AD]), and box plots of patients with MCI who remained stable and those who progressed to AD for (E) hippocampal atrophy rate and (F) whole brain atrophy rate. Lines represent median; boxes, interquartile range; and whiskers, range; o = outliers. *p < 0.005.
Figure 2 Regional fluid registration
Individual examples of color overlay, representing contraction (green and blue) and expansion (yellow and red) within the right hippocampal regions of interest of (A) a control who remained stable, (B) a control who had progressed to Alzheimer disease (AD) at follow-up, (C) a patient with mild cognitive impairment (MCI) who remained stable, and (D) a patient with MCI who progressed to AD during follow-up.
For the difference between controls and MCI, effect size (95% confidence interval [CI]) of baseline hippocampal volume (0.73 [0.17–1.30]) was higher than that of baseline whole brain volume (0.49 [−0.08–1.06]). Likewise, the effect size of hippocampal atrophy rate (1.17 [0.60–1.73]) was higher than that of whole brain atrophy rate (0.86 [0.30–1.43]). These results suggest a greater value of regional hippocampal measures, especially atrophy rates, in discriminating MCI from controls. In contrast, when looking at the difference between MCI and AD, effect sizes for both whole brain measures (baseline volume: 0.47 [−0.02–0.96]; atrophy rate: 0.67 [0.17–0.1.16]) were larger than for hippocampal measures (baseline volume: 0.33 [−0.16–0.82]; atrophy rate: 0.25 [−0.24–0.74]), implying that whole brain measures provide more discriminatory value when comparing patients with AD and MCI.
Within the total population, we found correlations of hippocampal volume with baseline scores on VAT (r = 0.35; p < 0.05), of hippocampal atrophy rate with baseline MMSE, VAT, and category fluency (r = 0.25, 0.38, and 0.26; p < 0.05), of baseline whole brain volume with baseline MMSE and VAT (r = 0.26 and 0.29; p < 0.05), and of whole brain atrophy rate with baseline MMSE, VAT, and category fluency (r = 0.41, 0.32, and 0.36; p < 0.05).
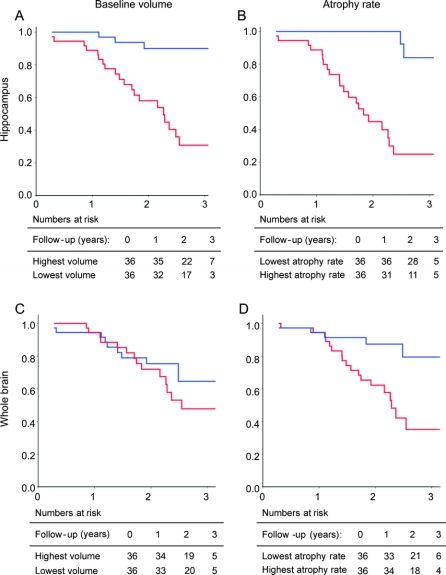
Cox proportional hazard models (table 2) show that within patients without dementia (MCI and controls), lower baseline hippocampal volume and higher hippocampal atrophy rate, as well as higher whole brain atrophy rate, independently predicted progression to AD. Baseline brain volume did not predict clinical progression. Hippocampal markers seemed to be stronger predictors than whole brain markers, with a roughly twofold higher risk. Kaplan-Meier curves for the MRI markers are shown in figure 3. When the analysis was restricted to patients with MCI, hippocampal baseline volume had the highest predictive value. Hippocampal atrophy rate was an independent, additional predictor. However, neither whole brain volume measure predicted progression to AD. Using progression to dementia as an outcome instead of progression to AD, hippocampal baseline volume (HR [95% CI]: 2.3 [1.1–6.2]), hippocampal atrophy rate (3.8 [1.7–8.6]), and whole brain atrophy rate (2.4 [1.1–5.3]) predicted progression to dementia in model 2, and only hippocampal atrophy rate (3.0 [1.3–7.0]) was an independent predictor of progression in model 3. Within patients with MCI, hippocampal baseline volume (model 2: 5.0 [2.0–12.6], model 3: 4.9 [1.8–13.2]) and hippocampal atrophy rate (model 2: 2.7 [1.2–6.3], model 3: 2.1 [0.9–5.0]) predicted progression to dementia.
Table 2 Risk of progression to Alzheimer disease (AD)
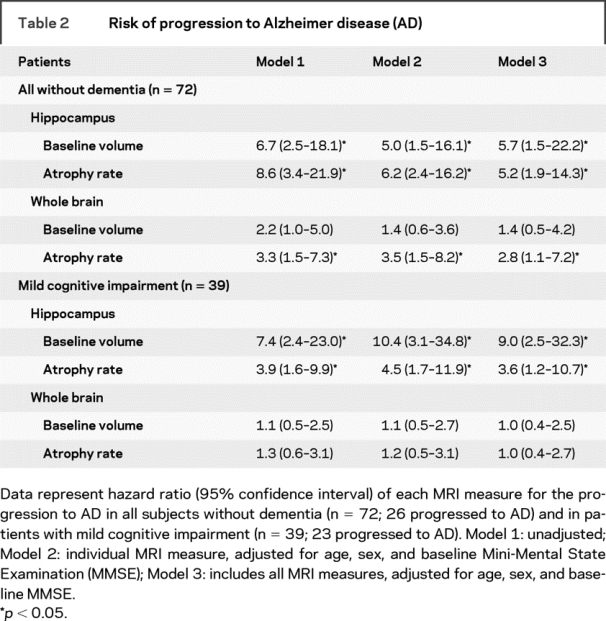
Figure 3 Kaplan-Meier curves of time to conversion within all subjects without dementia at baseline
MRI markers were dichotomized based on the median value: (A) baseline hippocampal volume, (B) hippocampal atrophy rate, (C) baseline whole brain volume, and (D) whole brain atrophy rate. On the X-axis: follow-up duration (years); on the Y-axis: proportion of subjects who remained stable. Blue line: highest baseline volume (A; C) or lowest atrophy rate (B; D). Red line: lowest baseline volume (A; C) or highest atrophy rate (B; D). Tables represent the number of patients exposed to risk at the intervals of 0, 1, 2, and 3 years.
Finally, we addressed the combined effect of baseline volume and atrophy rate on the prediction of progression to AD. Within all subjects without dementia, patients with a combination of both low baseline hippocampal volume and high hippocampal atrophy rate (median split) had a far more increased risk of progression to AD (HR 61.1 [95% CI: 6.1–606.8]) compared with patients with either a low baseline volume (11.2 [1.1–111.1]) or a high atrophy rate (12.8 [1.4–112.9]). Within patients with MCI, we observed a comparable, yet less pronounced effect; HR (95% CI) 20.4 (3.9–107.2) for the combination of low hippocampal baseline volume and high atrophy rate vs 11.3 (2.0–62.8; only low baseline volume) and 5.6 (1.0–30.9; only high atrophy rate). For whole brain measures, we did not observe this increased risk for the combination of low baseline volume and high atrophy rate.
DISCUSSION
Hippocampal baseline volume, and in particular hippocampal atrophy rate, were better able to discriminate patients with MCI from controls than whole brain measures. Whole brain volume measures better discriminated AD from MCI. Within subjects without dementia, regional hippocampal measures were the strongest predictors of progression to AD, but whole brain atrophy rate had an additional independent predictive effect. Within patients with MCI, baseline hippocampal atrophy was the strongest predictor of progression to AD.
The atrophy rates we report are consistent with atrophy rates reported by other studies.2,28–30 One previous study that directly compared the sensitivity of hippocampal and whole brain atrophy rates reported that both hippocampal and whole brain measures discriminated patients with AD from controls and cognitively impaired subjects, but neither measure distinguished controls from the cognitively impaired.10 The apparent difference with our findings can be explained by the fact that their group of cognitively impaired subjects did not meet MCI criteria,13 and contained no subjects who progressed to dementia at follow-up. We found stronger correlations with baseline scores on cognitive tests for whole brain measures than for hippocampal measures, which is congruent with findings by other studies.31
Whereas hippocampal measurements are more sensitive markers early in the disease, we observe a shift toward an advantage of the use of whole brain volume measurements at a later stage. Moreover, we show that both hippocampal baseline volume and atrophy rate can be used to distinguish controls from patients with MCI and predict progression, whereas of the whole brain measurements, only atrophy rate is able to do this. This finding seems to reflect that at the stage of MCI, considerable hippocampal atrophy has already taken place. Within patients with MCI, baseline hippocampal volume was an even stronger predictor than hippocampal atrophy rate, and whole brain volume did not predict progression at all in this group. We showed that combining hippocampal baseline volume and atrophy rate leads to a much higher risk on progression than when either one is present. The predictive value of whole brain and hippocampal atrophy rates was lower in patients with MCI than in the group of all subjects without dementia. This implies that the predictive effects of these longitudinal measures are strongly driven by those patients who were at a very early stage (controls) at baseline, and showed fast progression from control to AD at follow-up, with concomitant high atrophy rates.
The fact that our controls included patients with subjective cognitive complaints might be seen as a limitation of our study. Indeed, with 3 of the 34 controls progressing to AD, our group contained a relatively high number of patients with presymptomatic pathology. Although the proportion of subjects who progress to AD or dementia in our MCI and control groups are higher than reported in community-based studies,32 they are comparable with other studies within memory clinic populations.33 Furthermore, it is a strength that our groups represent a typical memory clinic population, covering the complete cognitive continuum of AD and its preceding stages.
Our findings extend on previous studies focusing on the progressive regional distribution of atrophy in AD and its preceding stages. Between patients with MCI and controls, differences in atrophy (rates) have been described in medial temporal lobe structures.4,34,35 Increased hippocampal atrophy rates have even been found in patients with familial AD before clinical symptoms occur.34,36 In patients with AD, more widespread atrophy in other cortical areas occurs.4,34,35 This pattern of widespread atrophy is already evident in patients with MCI later progressing to AD.37 We show that hippocampal atrophy (rate) does not differentiate patients with AD from patients with MCI, as has also been reported by others.8 This supports earlier findings that AD-like hippocampal atrophy rate is already established in a transitional stage (MCI).8,34 After this stage, because whole brain atrophy rates still increase with progressing disease severity,38,39 whole brain atrophy rate becomes a better marker of disease progression than hippocampal volume measurements.
AUTHOR CONTRIBUTIONS
W.J.P.H. conducted the statistical analysis.
Disclosure: The authors report no disclosures.
Address correspondence and reprint requests to Dr. W.J.P. Henneman, Department of Radiology and Alzheimer Center, VU University Medical Center, PO Box 7057, 1007 MB Amsterdam, The Netherlands w.henneman@vumc.nl
Received September 10, 2008. Accepted in final form December 16, 2008.
REFERENCES
- 1.Braak H, Braak E. Neuropathological staging of Alzheimer-related changes. Acta Neuropathol 1991;82:239–259. [DOI] [PubMed] [Google Scholar]
- 2.Fotenos AF, Snyder AZ, Girton LE, Morris JC, Buckner RL. Normative estimates of cross-sectional and longitudinal brain volume decline in aging and AD. Neurology 2005;64:1032–1039. [DOI] [PubMed] [Google Scholar]
- 3.Jack CR, Shiung MM, Weigand SD, et al. Brain atrophy rates predict subsequent clinical conversion in normal elderly and amnestic MCI. Neurology 2005;65:1227–1231. [DOI] [PMC free article] [PubMed] [Google Scholar]
- 4.Karas GB, Scheltens P, Rombouts SA, et al. Global and local gray matter loss in mild cognitive impairment and Alzheimer’s disease. Neuroimage 2004;23:708–716. [DOI] [PubMed] [Google Scholar]
- 5.Mungas D, Reed BR, Jagust WJ, et al. Volumetric MRI predicts rate of cognitive decline related to AD and cerebrovascular disease. Neurology 2002;59:867–873. [DOI] [PMC free article] [PubMed] [Google Scholar]
- 6.Rusinek H, De SS, Frid D, et al. Regional brain atrophy rate predicts future cognitive decline: 6-year longitudinal MR imaging study of normal aging. Radiology 2003;229:691–696. [DOI] [PubMed] [Google Scholar]
- 7.Devanand DP, Pradhaban G, Liu X, et al. Hippocampal and entorhinal atrophy in mild cognitive impairment: prediction of Alzheimer disease. Neurology 2007;68:828–836. [DOI] [PubMed] [Google Scholar]
- 8.Jack CR Jr, Petersen RC, Xu Y, et al. Rates of hippocampal atrophy correlate with change in clinical status in aging and AD. Neurology 2000;55:484–489. [DOI] [PMC free article] [PubMed] [Google Scholar]
- 9.Sluimer JD, van der Flier WM, Karas GB, et al. Whole-brain atrophy rate and cognitive decline: longitudinal MR study of memory clinic patients. Radiology 2008;248:590–598. [DOI] [PubMed] [Google Scholar]
- 10.Cardenas VA, Du AT, Hardin D, et al. Comparison of methods for measuring longitudinal brain change in cognitive impairment and dementia. Neurobiol Aging 2003;24:537–544. [DOI] [PubMed] [Google Scholar]
- 11.van de Pol LA, Scahill RI, Frost C, et al. Improved reliability of hippocampal atrophy rate measurement in mild cognitive impairment using fluid registration. Neuroimage 2007;34:1036–1041. [DOI] [PubMed] [Google Scholar]
- 12.McKhann G, Drachman D, Folstein M, et al. Clinical diagnosis of Alzheimer’s disease: report of the NINCDS-ADRDA Work Group under the auspices of Department of Health and Human Services Task Force on Alzheimer’s Disease. Neurology 1984;34:939–944. [DOI] [PubMed] [Google Scholar]
- 13.Petersen RC, Doody R, Kurz A, et al. Current concepts in mild cognitive impairment. Arch Neurol 2001;58:1985–1992. [DOI] [PubMed] [Google Scholar]
- 14.Morris JC. The Clinical Dementia Rating (CDR): current version and scoring rules. Neurology 1993;43:2412–2414. [DOI] [PubMed] [Google Scholar]
- 15.Lindeboom J, Schmand B, Tulner L, Walstra G, Jonker C. Visual association test to detect early dementia of the Alzheimer type. J Neurol Neurosurg Psychiatry 2002;73:126–133. [DOI] [PMC free article] [PubMed] [Google Scholar]
- 16.Lawton MP, Brody EM. Assessment of older people: self-maintaining and instrumental activities of daily living. Gerontologist 1969;9:179–186. [PubMed] [Google Scholar]
- 17.Roman GC, Tatemichi TK, Erkinjuntti T, et al. Vascular dementia: diagnostic criteria for research studies: report of the NINDS-AIREN International Workshop. Neurology 1993;43:250–260. [DOI] [PubMed] [Google Scholar]
- 18.Neary D, Snowden JS, Gustafson L, et al. Frontotemporal lobar degeneration: a consensus on clinical diagnostic criteria. Neurology 1998;51:1546–1554. [DOI] [PubMed] [Google Scholar]
- 19.McKeith IG, Galasko D, Kosaka K, et al. Consensus guidelines for the clinical and pathologic diagnosis of dementia with Lewy bodies (DLB): report of the consortium on DLB international workshop. Neurology 1996;47:1113–1124. [DOI] [PubMed] [Google Scholar]
- 20.Jack CR Jr. MRI-based hippocampal volume measurements in epilepsy. Epilepsia 1994;35 suppl 6:S21–S9. [DOI] [PubMed] [Google Scholar]
- 21.van de Pol LA, van der Flier WM, Korf ES, et al. Baseline predictors of rates of hippocampal atrophy in mild cognitive impairment. Neurology 2007;69:1491–1497. [DOI] [PubMed] [Google Scholar]
- 22.Barnes J, Lewis EB, Scahill RI, et al. Automated measurement of hippocampal atrophy using fluid-registered serial MRI in AD and controls. J Comput Assist Tomogr 2007;31:581–587. [DOI] [PubMed] [Google Scholar]
- 23.Crum WR, Scahill RI, Fox NC. Automated hippocampal segmentation by regional fluid registration of serial MRI: validation and application in Alzheimer’s disease. Neuroimage 2001;13:847–855. [DOI] [PubMed] [Google Scholar]
- 24.Freeborough PA, Fox NC. Modeling brain deformations in Alzheimer disease by fluid registration of serial 3D MR images. J Comput Assist Tomogr 1998;22:838–843. [DOI] [PubMed] [Google Scholar]
- 25.Freeborough PA, Fox NC, Kitney RI. Interactive algorithms for the segmentation and quantitation of 3-D MRI brain scans. Comput Methods Programs Biomed 1997;53:15–25. [DOI] [PubMed] [Google Scholar]
- 26.Smith SM, Zhang Y, Jenkinson M, et al. Accurate, robust, and automated longitudinal and cross-sectional brain change analysis. Neuroimage 2002;17:479–489. [DOI] [PubMed] [Google Scholar]
- 27.Mazziotta J, Toga A, Evans A, et al. A probabilistic atlas and reference system for the human brain: International Consortium for Brain Mapping (ICBM). Philos Trans R Soc Lond B Biol Sci 2001;356:1293–1322. [DOI] [PMC free article] [PubMed] [Google Scholar]
- 28.Barnes J, Bartlett JW, van de Pol LA, et al. A meta-analysis of hippocampal atrophy rates in Alzheimer’s disease. Neurobiol Aging Epub 2008 Mar 15. [DOI] [PMC free article] [PubMed]
- 29.O’Brien JT, Paling S, Barber R, et al. Progressive brain atrophy on serial MRI in dementia with Lewy bodies, AD, and vascular dementia. Neurology 2001;56:1386–1388. [DOI] [PubMed] [Google Scholar]
- 30.Fox NC, Freeborough PA. Brain atrophy progression measured from registered serial MRI: validation and application to Alzheimer’s disease. J Magn Reson Imaging 1997;7:1069–1075. [DOI] [PubMed] [Google Scholar]
- 31.Ridha BH, Anderson VM, Barnes J, et al. Volumetric MRI and cognitive measures in Alzheimer disease: comparison of markers of progression. J Neurol 2008;255:567–574. [DOI] [PubMed] [Google Scholar]
- 32.Petersen RC. Mild cognitive impairment as a diagnostic entity. J Intern Med 2004;256:183–194. [DOI] [PubMed] [Google Scholar]
- 33.Zetterberg H, Wahlund LO, Blennow K. Cerebrospinal fluid markers for prediction of Alzheimer’s disease. Neurosci Lett 2003;352:67–69. [DOI] [PubMed] [Google Scholar]
- 34.Scahill RI, Schott JM, Stevens JM, Rossor MN, Fox NC. Mapping the evolution of regional atrophy in Alzheimer’s disease: unbiased analysis of fluid-registered serial MRI. Proc Natl Acad Sci USA 2002;99:4703–4707. [DOI] [PMC free article] [PubMed] [Google Scholar]
- 35.Whitwell JL, Przybelski SA, Weigand SD, et al. 3D maps from multiple MRI illustrate changing atrophy patterns as subjects progress from mild cognitive impairment to Alzheimer’s disease. Brain 2007;130:1777–1786. [DOI] [PMC free article] [PubMed] [Google Scholar]
- 36.Schott JM, Fox NC, Frost C, et al. Assessing the onset of structural change in familial Alzheimer’s disease. Ann Neurol 2003;53:181–188. [DOI] [PubMed] [Google Scholar]
- 37.Whitwell JL, Shiung MM, Przybelski SA, et al. MRI patterns of atrophy associated with progression to AD in amnestic mild cognitive impairment. Neurology 2008;70:512–520. [DOI] [PMC free article] [PubMed] [Google Scholar]
- 38.Chan D, Janssen JC, Whitwell JL, et al. Change in rates of cerebral atrophy over time in early-onset Alzheimer’s disease: longitudinal MRI study. Lancet 2003;362:1121–1122. [DOI] [PubMed] [Google Scholar]
- 39.Jack CR, Weigand SD, Shiung MM, et al. Atrophy rates accelerate in amnestic mild cognitive impairment. Neurology 2008;70:1740–1752. [DOI] [PMC free article] [PubMed] [Google Scholar]


