SYNOPSIS
Objectives
Newborn hearing screening programs have been implemented by all 50 states and most U.S. territories to detect hearing loss in infants and prevent delays in speech, language, and social and emotional development. To monitor progress toward national goals, the Centers for Disease Control and Prevention (CDC) collects data from state and territorial programs. This article summarizes findings from the CDC Early Hearing Detection and Intervention (EHDI) Hearing Screening and Follow-up Survey (HSFS) and provides a summary of recent efforts to identify infants with hearing loss in the U.S.
Methods
The HSFS was sent to representatives of U.S. EHDI programs to gather aggregate screening, diagnostic, intervention, and demographic data for 2005 and 2006. We analyzed these data to evaluate progress toward national goals.
Results
In 2005 and 2006, more than 90% of infants were screened for hearing loss. Of these infants, 2% in both years did not pass their final screening. Out of those not passing the final screening, approximately two-thirds were not documented as having a diagnostic finding. In both years, the reason reported for the majority of infants was loss to follow-up/loss to documentation (LFU/LTD). Although the majority of infants with permanent hearing loss were receiving intervention, more than 30% were classified as LFU/LTD and could not be documented as receiving intervention services.
Conclusions
The HSFS enables the collection of more complete data that highlight the progress in screening infants for hearing loss. However, data indicate improvements are needed to reduce LFU/LTD and meet the national benchmarks.
Given the potential for developmental delays1,2 among children with unidentified hearing loss, jurisdictions within the United States have implemented Early Hearing Detection and Intervention (EHDI) programs to identify infants with hearing loss as early as possible. To monitor the progress of identifying infants with hearing loss, EHDI programs routinely collect and report data related to Healthy People 2010 goal 28-11.3 This goal focuses on increasing the proportion of newborns who are screened for hearing loss by 1 month of age, have a diagnostic audiologic evaluation by 3 months of age, and are enrolled in appropriate early intervention services by 6 months of age. These benchmarks are commonly referred to as the 1-3-6 Plan.
With the widespread implementation of EHDI programs, more than 92% of infants born in the U.S. are now documented as having been screened for hearing loss.4 While this figure represents great progress, screening is only the first step. Diagnostic follow-up testing for infants not passing the final screening is essential to confirm if an infant has a hearing loss and is a key EHDI performance measure.
Unfortunately, not all infants receive recommended follow-up testing. According to one study, the majority of children who fail a hearing screen in a pediatrician's office do not receive a follow-up evaluation.5 Infants referred for testing who do not receive it and cannot be contacted by the EHDI program are commonly categorized as loss to follow-up (LFU). Documenting how many infants receive follow-up testing and how many are LFU is challenging because (1) jurisdictions define LFU differently and (2) some infants probably receive follow-up testing, but the results are not reported to the jurisdictional EHDI program. Cases in which infants receive the recommended follow-up services but the results are never reported to the EHDI program are referred to as loss to documentation (LTD).6 Given the importance of determining how many infants receive follow-up testing and intervention services, it is important that complete data related to the EHDI process are collected in a standardized manner.
EHDI data related to the 1-3-6 Plan for the years 1999–2004 were gathered by the Directors of Speech and Hearing Programs in State Health and Welfare Agencies (DSHPSHWA) through a survey that was sent annually to jurisdictions.7 This voluntary survey was retired after collecting data for year 2004 due to limitations with the LFU/LTD and other data that were being captured. To help meet the need for more complete and comparable EHDI data, a comprehensive new survey tool was designed. This article summarizes the recent data that have been collected, discusses what these data indicate about the status of efforts to identify infants with all degrees and types of hearing loss, and identifies areas within the EHDI process that may benefit from continued efforts.
METHODS
This new Web-based survey tool was designed by the CDC EHDI program, in collaboration with partners that included DSHPSHWA, jurisdictional EHDI programs, the Health Resources and Services Administration, and other stakeholders. The voluntary response survey, which is referred to as the CDC Hearing Screening and Follow-up Survey (HSFS), has been designed to gather standardized data about the screening, diagnostic, and intervention status of all occurrent births in a jurisdiction. This survey was designed to gather aggregate-level data for 2005 and beyond and will serve as the primary national source of EHDI-related data.8
CDC EHDI used the Web-based HSFS to collect aggregate data for 2005 and 2006. The survey consists of three separate parts. Part 1 requests information on screening, diagnosis, and intervention. Part 2 requests type and severity data for all cases of diagnosed hearing loss. Part 3 requests aggregate demographic data for selected items reported in Part 1.
The HSFS requires respondents to account for the screening, diagnostic, and intervention status of all infants reported on the survey. In addition, error checks have been incorporated to help avoid over- and underreporting. Respondents could not submit the survey until accounting for the status of all births. For example, if the number of births reported was 1,000, the screening status (e.g., screened, not screened, unknown) of all of these 1,000 newborns has to be accounted for before a respondent can submit the online survey. An explanation document with various examples was sent along with the invitation to complete this survey.9
Part of the reason the HSFS was created was to assess how many infants not passing the final hearing screening were actually documented to receive follow-up services (e.g., diagnostic evaluation and intervention services) and the number LFU/LTD. As it would be virtually impossible for EHDI programs to differentiate between those infants that were LFU and those that were LTD, both terms are used together. The percent LFU/LTD for diagnosis was calculated by dividing the number reported as not receiving a diagnosis for the reason “unable to contact/unresponsive/unknown” by the number reported as not passing the final hearing screening. Similarly, the percent LFU/LTD for intervention was calculated by dividing the number reported as not receiving intervention services for the reason “unable to contact/unresponsive/unknown” by the number reported with a permanent hearing loss. The HSFS was sent to representatives of EHDI programs in all 50 states, the District of Columbia, the Federated States of Micronesia, Guam, the Northern Mariana Islands, Palau, Puerto Rico, and the U.S. Virgin Islands and requested information for calendar years 2005 and 2006. Minor changes were made to the 2006 version of the HSFS to further improve and simplify the survey. These changes included additional error checks to Parts 1 and 3, and requesting type and severity data for bilateral losses (i.e., a loss in both ears) by better and worse ear instead of by right and left ear. In addition, demographic data were requested for the total number of babies that were screened, diagnosed, and received follow-up services, instead of only for the aggregate of those that received these services before 1, 3, and 6 months of age. Plans call for the HSFS to continue to be used to collect data for the next several years.
Results from the Web-based survey for years 2005 and 2006 were captured in a Microsoft® Access database. The data were then exported from this database into Microsoft® Excel and reviewed by staff from the CDC EHDI program to ensure it was complete. Any questions about the reported data were sent via e-mail to the person who submitted the survey. Descriptive statistics for each year of data collected were generated using Microsoft Excel. Data for each year were then compared on a national and individual respondent level. Given the small number of maximum respondents to the survey (50 states and seven territories), efforts were not made to determine the statistical significance of responses. Analyses to determine the role of potential factors (e.g., state legislation related to newborn hearing screening, funding levels, and program staffing) that may contribute to differences in rates of screening and LFU/LTD among respondents were considered beyond the scope of this article and may be addressed in a separate article. In addition, an in-depth analysis of the impact of state legislation on newborn hearing screening can be found in a 2007 article by Green et al.10
For Part 1 of the HSFS, 49 EHDI jurisdictions reported data for 2005 and 50 jurisdictions reported data for 2006. In both 2005 and 2006, some respondents could not answer all the questions on the survey and reported only partial data (e.g., hearing screening data only) using a paper version of the survey. Because the number of respondents differed among some questions, the denominators used to calculate key indicators (e.g., LFU/LTD) varied based on how many jurisdictions reported data for some items. Screening rates were determined using the number of occurrent births reported by the CDC National Center for Health Statistics as the denominator.11,12
RESULTS
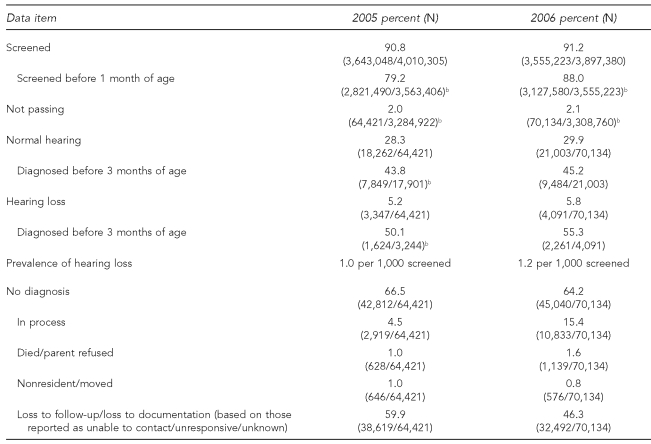
Reports indicated an estimated 90.8% (2005) and 91.2% (2006) of infants were documented as having been screened for hearing loss. Of all infants screened, 2.0% (2005) and 2.1% (2006) did not pass their final or most recent hearing screening. Regarding progress to the 1-3-6 Plan benchmarks, 79.2% (2005) and 88.0% (2006) of infants who were screened for hearing loss were screened before 1 month of age.
Permanent hearing loss was diagnosed among 5.2% (2005) and 5.8% (2006) of infants who did not pass the final hearing screening, with 45 jurisdictions reporting in 2005 and 48 in 2006. More than half (50.1% in 2005 and 55.3% in 2006) of those infants with permanent hearing loss were diagnosed before the national benchmark of 3 months of age. Based on the number of infants with a documented diagnosis, the prevalence rates of hearing loss were 1.0 per 1,000 infants screened in 2005 and 1.2 per 1,000 infants screened in 2006 (Table 1). These lower-bound estimates of prevalence did not include any cases of hearing loss that might have been diagnosed but not reported to the EHDI program.
Table 1.
Comparison between 2005 and 2006 EHDI key indicators related to the receipt of hearing screening and diagnosis of hearing loss in infantsa
aData source: 2005 and 2006 Centers for Disease Control and Prevention Hearing Screening and Follow-up Survey
bThe number of states and territories responding differed by data item.
EHDI = Early Hearing Detection and Intervention
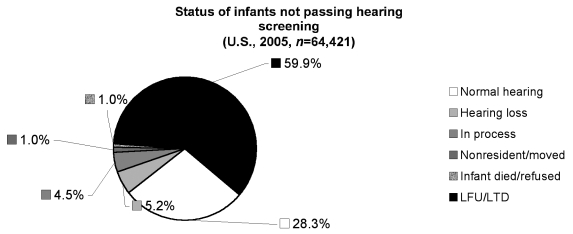
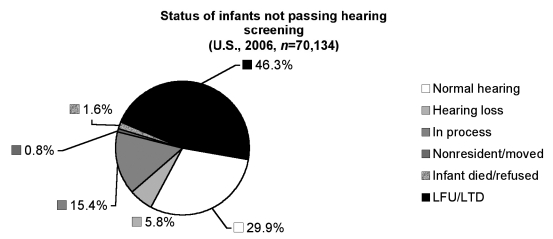
EHDI jurisdictions were unable to document a diagnostic finding for 66.5% (2005) and 64.2% (2006) of those infants who were reported as not passing their final hearing screening. The reason reported for most infants not having a documented diagnostic finding in 2005 and 2006 was “unable to contact/unresponsive/unknown.” The rate of LFU/LTD for diagnosis for those infants reported as not having passed the final hearing screening was 59.9% in 2005 and 46.3% in 2006. This rate was determined by dividing the number reported with no diagnosis due to the reason “unable to contact/unresponsive/unknown” by the total number reported as not passing the final screening. A breakdown of LFU/LTD by individual state and territory for 2006 is available on the CDC EHDI website.4 The reasons for the remaining infants not receiving a diagnosis out of those that did not pass the final screening included: diagnosis still in process (4.5% in 2005 and 15.4% in 2006), infant died or parents refused follow-up testing (1.0% in 2005 and 1.6% in 2006), and infant was not a resident of the state or moved out of state (1.0% in 2005 and 0.8% in 2006) (Figures 1 and 2).
Figure 1.
Summary of diagnosis and reasons for not receiving follow-up among infants that did not pass the hearing screening: 2005a
aData source: 2005 Centers for Disease Control and Prevention Hearing Screening and Follow-up Survey
LFU/LTD = loss to follow-up/loss to documentation
Figure 2.
Summary of diagnosis and reasons for not receiving follow-up among infants that did not pass the hearing screening: 2006a
aData source: 2006 Centers for Disease Control and Prevention Hearing Screening and Follow-up Survey
LFU/LTD = loss to follow-up/loss to documentation
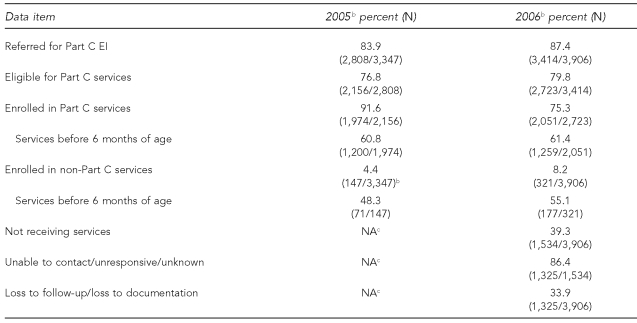
Of the infants diagnosed with a permanent hearing loss, 45 programs in 2005 and 46 programs in 2006 reported that 83.9% (2005) and 87.4% (2006) of infants were documented as being referred to Part C Early Intervention (EI) services. Part C refers to intervention services provided by a jurisdiction for infants and toddlers from birth through 36 months of age. Of the infants referred to Part C who were reported to be eligible, 91.6% (2005) and 75.3% (2006) were documented as being enrolled in Part C services. Each jurisdiction had different eligibility rules for infants and children with hearing loss, which often related to the type and severity of the loss. A total of 60.8% (2005) and 61.4% (2006) of these infants were enrolled in Part C EI services before 6 months of age. Another 4.4% (2005) and 8.2% (2006) of those identified with a hearing loss were reported to be receiving intervention services from only non-Part C programs (e.g., private services). A total of 48.3% (2005) and 55.1% (2006) of those infants receiving non-Part C services started receiving these services before 6 months of age (Table 2).
Table 2.
Comparison of 2005 and 2006 EHDI key indicators related to referral, eligibility, and enrollment in EI services for infants with a permanent hearing lossa
aData source: 2005 and 2006 CDC Hearing Screening and Follow-up Survey
bThe number of states and territories reporting intervention data is less than the number of states and territories that reported data about hearing screening and diagnosis of hearing loss. Also, the number of respondents for the data items in 2006 differed from the number of respondents for the data items in 2005.
cThese data were not requested by the 2005 CDC Hearing Screening and Follow-up Survey.
EHDI = Early Hearing Detection and Intervention
EI = early intervention
NA = not available
CDC = Centers for Disease Control and Prevention
In 2006, 39.3% of infants with hearing loss were reported as not receiving any documented intervention services. The reason for 86.4% of these infants not receiving intervention services was reported as “unable to contact/unresponsive/unknown.” Using the number reported as receiving no intervention services because of being “unable to contact/unresponsive/unknown” divided by the total number with hearing loss, the rate of LFU/LTD for intervention was estimated to be 33.9% in 2006 (Table 2).
Part 2—type and severity
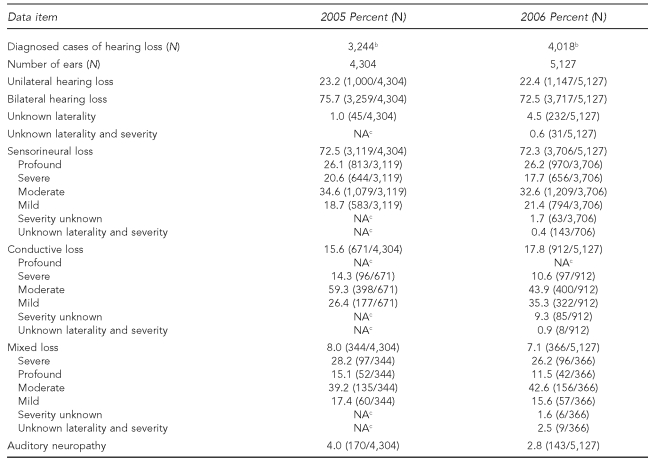
A total of 44 (2005) and 47 (2006) jurisdictions responded to Part 2 of the HSFS, which requested information about the laterality, type, and severity of the identified hearing losses in each ear (Table 3). All these data were reported by individual ear rather than by child, which resulted in type and severity data being reported for 4,304 ears in 2005 and 5,127 ears in 2006. Unilateral losses (i.e., a hearing loss in only one ear) accounted for 23.2% (2005) and 22.4% (2006) of all hearing loss. Bilateral losses accounted for 75.7% (2005) and 72.5% (2006) of losses. Regarding type, sensorineural accounted for 72.5% (2005) and 72.3% (2006), conductive for 15.6% (2005) and 17.8% (2006), and mixed for 8.0% (2005) and 7.1% (2006) of diagnosed losses. Auditory neuropathy accounted for the remaining 4.0% (2005) and 2.8% (2006) of diagnosed losses. The type and severity of the remaining hearing losses are summarized in Table 3.
Table 3.
Laterality, type, and severity data for permanent cases of hearing loss reported for 2005 and 2006a
aData source: 2005 and 2006 CDC Hearing Screening and Follow-up Survey
bNot all respondents reported type and severity data for all cases of hearing loss that were identified.
cThese data were not requested by the 2005 and 2006 CDC Hearing Screening and Follow-up Survey.
NA = not available
CDC = Centers for Disease Control and Prevention
Part 3—demographics
Part 3 of the HSFS collects demographic data regarding infant gender, and maternal age, education, and race/ethnicity for selected items reported on Part 1. In 2005, a total of 37 jurisdictions responded to Part 3; however, some of those respondents reported little or no information. As a result, only a small percentage of respondents were able to provide accurate demographic data that also did not contradict the data reported in Part 1 of the survey. In 2006, a total of 39 jurisdictions responded to Part 3. However, as in 2005, many respondents provided little or no information. In total, only 13 (33%) jurisdictions were able to report complete demographic data for hearing screening. Only 10 (25%) jurisdictions reported complete demographic data for diagnosis and nine (23%) reported complete demographic data for intervention. A more complete summary of the demographic information for 2005 and 2006 is not included in this article due to limitations with the reported data.
DISCUSSION
Data from the 2005 and 2006 CDC HSFS made it possible to assess more accurately national progress toward achieving the 1-3-6 Plan benchmarks outlined in goal 28-11 of Healthy People 2010. In the case of hearing screening, clear progress continued to be made toward the “1” benchmark of screening infants before 1 month of age. This was reflected by data that showed 88% of infants screened in 2006 were documented to have been screened before 1 month of age, which was nearly a 9% increase from 2005. However, additional efforts are needed regarding the “3” benchmark of diagnosis before 3 months of age. This notion is supported by data from 2005 and 2006 indicating that, of those infants with a hearing loss, only slightly more than half were documented as having been diagnosed before 3 months of age. Regarding the “6” benchmark of enrollment in intervention before 6 months of age, limited progress had been made, which is shown by an additional 6% of infants with hearing loss in 2006 receiving non-Part C intervention services before 6 months of age compared with 2005. It should be noted that it is possible that some of the infants reported as receiving only non-Part C services might have been eligible for Part C but decided not to receive jurisdictional services. However, additional efforts are needed, which is reflected by nearly 40% of infants enrolled in Part C in 2005 and 2006 not receiving intervention services until after 6 months of age.
Another area in which the CDC HSFS has provided more complete and representative data is LFU/LTD. Part of the reason for this achievement is that the 2005 and 2006 rates of LFU/LTD for diagnosis did not include infants who were in process, died, or moved out of the jurisdiction. Also, the previous DSHPSHWA survey respondents were not required to report the diagnostic findings of all the infants who were reported as not passing the final screening examination. This caused the status for a large group of infants to be unaccounted for and might have resulted in an underestimate of the number LFU/LTD in previous years.
LFU/LTD data from 2005 and 2006 indicated that a majority of infants reported as not passing the final or most recent hearing screening did not have a documented diagnostic finding (i.e., a diagnosis of hearing loss or confirmation of no hearing loss). While some respondents reported LFU/LTD rates of less than 10% and the overall LFU/LTD number decreased by nearly 14% in 2006, 46% of all infants not passing the screening in 2006 were still not documented as having a diagnostic finding. In addition, the LFU/LTD number for diagnosis might have been even higher because it could not be confirmed independently whether infants reported as having “no diagnosis” due to the reason “audiologic diagnosis in process (awaiting diagnosis)” in 2005 and 2006 were ever seen by an audiologist. This raises the possibility that some of these infants reported as being “in process” actually might have been LFU/LTD or could have had a hearing loss, or both. As discussed in a 2008 article by Mason et al., a lack of standardization in how data are classified and then reported can result in unreliable LFU/LTD data.6 This, in turn, can undermine efforts to ensure all infants with hearing loss are identified and receive EI services as soon as possible.
Regarding intervention, it appears that there was a decrease in the percentage of infants with permanent hearing loss enrolled in Part C EI in year 2006 compared with 2005. It is possible that this apparent decrease was due at least in part to some programs reporting that they did not refer any children with hearing loss to Part C in 2005, while in 2006 they reported referring all children with a loss but could not document if any were actually enrolled in Part C. In 2006, nearly 34% of infants diagnosed with a hearing loss were reported as not receiving any documented intervention services or, in other words, were LFU/LTD. Some of these infants actually might have been receiving EI services. This might have been due to the fact that Part C and non-Part C programs are not typically required to report to EHDI programs if infants and children with hearing loss are receiving services. As a result, it is probable that the LFU/LTD number for intervention services was lower than what was reflected by the surveys.
As expected, the 2005 and 2006 CDC HSFSs showed that the majority of permanent hearing losses were bilateral, accounting for nearly three-fourths of all the reported losses. The most common type of loss in both years was sensorineural, which accounted for more than 70% of all reported losses. A moderate hearing loss was the most frequently reported degree of loss for all types reported in 2005 and 2006. It should be noted that respondents might not have reported type and severity data for all identified cases of hearing loss (3,244 in 2005 and 4,018 in 2006), possibly because this information was not reported to them. While the majority of EHDI programs were able to report type and severity data for some of the cases of hearing loss they identified, it is hoped that in the future all jurisdictions will be able to report complete data for every child identified with a permanent hearing loss.
The over- and underreporting combined with incomplete responses reduced the usability of the demographic data and made it difficult to draw any meaningful conclusions from the information reported in Part 3 of the survey. There might have been several reasons for the difficulty jurisdictions had in reporting these data. The first was that some programs did not collect or receive demographic information. Second, there was a lack of standardization among the demographic data that were collected. For example, some states collected race/ethnicity data for the infant but not for the mother; the HSFS requested information about maternal race/ethnicity. Third, the demographic data requested by the HSFS in 2005 related only to infants being followed through the 1-3-6 Plan. Demographic information about infants who were screened, diagnosed, or received intervention services outside of the 1-3-6 Plan benchmarks or who were of unknown age when they received services was not requested by the HSFS for 2005. Although in 2006 error checks were added and jurisdictions were asked to report demographic data for all infants reported on the survey, most programs still were not able to provide complete data for all categories. While the reported demographic data did suggest some disparities across different groups (e.g., babies born to less educated mothers were less likely to have received follow-up services), it was difficult to draw any conclusions. In the future, it is hoped that it will be possible to collect more accurate and complete demographic data.
Limitations
The findings in this article were subject to at least four limitations. First, the HSFS and the DSHPSHWA survey used different definitions, even for similar items such as the number of infants screened. This discrepancy limited the ability to compare the data from the two surveys. Second, there were some differences between the number of respondents to certain questions (e.g., number enrolled in intervention) in 2005 and 2006, which could have limited the comparability of data by year. Third, it could not be confirmed if infants reported as having “no diagnosis” due to the reason “audiologic diagnosis in process (awaiting diagnosis)” were actually seen by an audiologist. As a result, it was possible that some of these infants might have been LFU/LTD. Lastly, the data from the 2005 and 2006 HSFSs were more than two years old and did not reflect recent changes and accomplishments within jurisdictional EHDI programs.
CONCLUSIONS
The adoption of the CDC HSFS provides data that have made it possible to better assess progress toward the EHDI 1-3-6 Plan benchmarks. It has also provided detailed data about LFU/LTD, the type and severity of identified hearing losses, and the ability of programs to provide demographic data. While results indicated that progress has been made in screening, and to a lesser extent enrollment in intervention, additional efforts are needed to ensure infants and children with hearing loss are documented to receive a timely diagnosis and enrolled in EI services before 6 months of age. More complete reporting to jurisdictional EHDI programs of the results of all diagnostic testing, including cases in which no hearing loss is found, and enrollment in EI for those infants with a permanent hearing loss should help decrease the number of infants that are LTD.
Continued efforts to ensure the standardization of how data are classified and reported is also important in addressing the issue of LFU/LTD. In addition, the collection of more comprehensive demographic data should help jurisdictions better understand at least some of the causes for LFU/LTD. This, in turn, will help programs better direct their efforts and resources toward providing services to the most vulnerable populations. This is critically important because, without the receipt of documented follow-up services, the benefits of newborn hearing screening and the possibility of early identification and intervention might be severely reduced.
Footnotes
The findings and conclusions in this article are those of the authors and do not necessarily represent the views of the Centers for Disease Control and Prevention.
REFERENCES
- 1.Yoshinaga-Itano C, Sedey AL, Coulter DK, Mehl AL. Language of early- and later-identified children with hearing loss. Pediatrics. 1998;102:1161–71. doi: 10.1542/peds.102.5.1161. [DOI] [PubMed] [Google Scholar]
- 2.Moeller MP. Early intervention and language development in children who are deaf and hard of hearing. Pediatrics. 2000;106:E43. doi: 10.1542/peds.106.3.e43. [DOI] [PubMed] [Google Scholar]
- 3.National Institutes of Health (US) Healthy People 2010 objectives: vision and hearing volume 2 focus area 28. [cited 2008 Aug 19]. Available from: URL: http://www.healthypeople.gov/document/html/volume2/28vision.htm.
- 4.Centers for Disease Control and Prevention (US) Early Hearing Detection and Intervention (EHDI) program: EHDI 2006 data. [cited 2008 Aug 18]. Available from: URL: http://www.cdc.gov/ncbddd/ehdi/data.htm.
- 5.Halloran DR, Wall TC, Evans HH, Hardin JM, Woolley AL. Hearing screening at well-child visits [published erratum appears in Arch Pediatr Adolesc Med 2006;160:156] Arch Pediatr Adolesc Med. 2005;159:949–55. doi: 10.1001/archpedi.159.10.949. [DOI] [PubMed] [Google Scholar]
- 6.Mason CA, Gaffney M, Green DR, Grosse SD. Measures of follow-up in early hearing detection and intervention programs: a need for standardization. Am J Audiol. 2008;17:60–7. doi: 10.1044/1059-0889(2008/007). [DOI] [PubMed] [Google Scholar]
- 7.CDC (US) The Directors of Speech and Hearing Programs in State Health and Welfare Agencies (DSHPSHWA) data reporting form: reporting year 2004. [cited 2008 Aug 19]. Available from: URL: http://www.cdc.gov/ncbddd/ehdi/2004/DIPS_2004_final.pdf.
- 8.CDC (US) 2006 EHDI Hearing Screening and Follow-up Survey (HSFS) [cited 2008 Aug 18]. Available from: URL: http://www.cdc.gov/ncbddd/ehdi/documents/EHDI_2006_Survey_Web.pdf.
- 9.CDC (US) CDC-EHDI Hearing Screening and Follow-up Survey: explanations (parts 1, 2, and 3) [cited 2008 Aug 18]. Available from: URL: http://www.cdc.gov/ncbddd/ehdi/documents/EHDI_Expl_2_07_Web.pdf.
- 10.Green DR, Gaffney M, Devine O, Grosse SD. Determining the effect of newborn hearing screening legislation: an analysis of state hearing screening rates. Public Health Rep. 2007;122:198–205. doi: 10.1177/003335490712200209. [DOI] [PMC free article] [PubMed] [Google Scholar]
- 11.CDC (US) Natality public use files. Hyattsville (MD): National Center for Health Statistics; pp. 2004–2005. [Google Scholar]
- 12.Hamilton BE, Martin JA, Ventura SJ. Births: preliminary data for 2006. Natl Vital Stat Rep. 2007 Dec 5;56:1–18. [PubMed] [Google Scholar]


