

Abstract
Traditional approaches to the preclinical investigation of cancer therapies rely on the use of established cell lines maintained in serum-based growth media. This is particularly true of small cell lung cancer (SCLC), where surgically resected tissue is rarely available. Recent attention has focused on the need for better models that preserve the integrity of cancer stem cell populations, as well as three-dimensional tumor-stromal interactions. Here we describe a primary xenograft model of SCLC in which endobronchial tumor specimens obtained from chemo-naive patients are serially propagated in vivo in immunodeficient mice. In parallel, cell lines grown in conventional tissue culture conditions were derived from each xenograft line, passaged for 6 months, and then re-implanted to generate secondary xenografts. Using the Affymetrix platform, we analyzed gene expression in primary xenograft, xenograft-derived cell line, and secondary xenograft, and compared these data to similar analyses of unrelated primary SCLC samples and laboratory models. When compared to normal lung, primary tumors, xenografts and cell lines displayed a gene expression signature specific for SCLC. Comparison of gene expression within the xenograft model identified a group of tumor-specific genes expressed in primary SCLC and xenografts that was lost during the transition to tissue culture, and that was not regained when the tumors were re-established as secondary xenografts. Such changes in gene expression may be a common feature of many cancer cell culture systems, with functional implications for the use of such models for preclinical drug development.
Keywords: Lung, Cancer, Xenograft, Expression, Microarray
Introduction
Lung cancer is the commonest cause of cancer death in the United States (1). Of these, approximately 15–20% of cases are SCLC, a highly aggressive, primitive neuroendocrine tumor that is often widely metastatic at the time of diagnosis. Most cases of SCLC are initially sensitive to cytotoxic chemotherapy, despite the fact that most of these tumors lack both p53 and pRB, and manifest overexpression of BCL2 (2). Regimens based on cis-platinum, usually in combination with etoposide, result in robust and often dramatic clinical responses in SCLC patients (3). Despite the effectiveness of this drug combination, the overwhelming majority of SCLC patients succumb to a chemoresistant recurrence within 2 years of diagnosis (3). Neither the use of novel chemotherapeutics, nor the introduction of dose intensification regimens have improved survival, which has remained essentially unchanged for the last 30 years (3). The clinical imperative in SCLC is the discovery of novel strategies to prevent disease recurrence.
For three decades, the mainstay of preclinical cancer therapeutic research has been the use of human cancer cells lines cultured in vitro, and xenografts derived from these cell lines grown in vivo in immunodeficient mice. Neither of these models consistently predict efficacy in clinical trials, resulting in two major barriers to the successful translation of new cancer therapeutics. First, resources are expended on drug development based on these models that ultimately fail in clinical trials. Secondly, many potentially useful therapies that might be beneficial in humans are discarded because they fail to show efficacy in conventional cell culture and xenograft models. Emerging evidence suggests that the process of establishing conventional cell lines from human cancers results in distinct and irreversible loss of important biological properties, which include (i) gain or loss of gene amplification (4, 5), (ii) the ability to migrate and metastasize (6) (iii) the maintenance of a distinct stem cell population (6) and (iv) the preservation of dependency on embryonic signaling pathways (7, 8). In all cases, these properties are not restored when these conventional cell lines are grown as heterotopic or orthotopic xenografts.
Preclinical modeling of SCLC chemotherapy presents challenges in addition to those outlined above. Since SCLC is usually diagnosed by endobronchial biopsy or fine needle aspiration cytology (FNAC), substantial quantities of fresh or frozen tissues are typically lacking in most tumor banks. For this reason, most SCLC research relies on conventional cell lines, which are often chemoresistant, since they were derived from patients who had received cytotoxic chemotherapy (9). In addition, all of these cell lines suffer from the experimental limitations outlined above, and lack the three dimensional tumor-stromal interactions which appear to significantly affect the response of these cells to chemotherapy (10). As part of our ongoing efforts to develop better models for the study of SCLC, we generated and characterized a series of primary xenograft models derived from chemo-naive patients in order to more accurately model this disease. In our first description of this primary xenograft model, we showed that differential expression of BCL2 in vivo was correlated with growth responses to the BCL2 inhibitor ABT-737 (11). Here, we describe a detailed gene expression analysis of this model that reveals how gene expression is irreversibly altered during the process of establishing conventional cell culture, and how maintenance of SCLC xenografts passaged exclusively in vivo can retain features of the primary tumor of direct relevance to preclinical drug testing.
Materials and Methods
Generation and maintenance of primary xenografts and cell lines
Over an 18 month period, discarded tissue from 3 chemo-naive SCLC patients undergoing therapeutic bronchoscopy for acute bronchial obstruction was obtained fresh and transported to the laboratory in 1X PBS at 4°C. All samples were anonymized, and obtained in accordance with the Johns Hopkins University Institutional Review Board. Due to the small amount of material available, the entire sample was used to generate a xenograft. Under aseptic conditions, tumor samples were finely minced with razor blades, vigorously triturated in 1XPBS, passed through a 60μm filter, centrifuged and then resuspended in 500μl of Matrigel (BD Biosciences) at 4°C. Cells were then injected subcutaneously in the flanks of 5 NOD/SCID mice that were monitored for tumor growth. When the P0 tumors reached 1cm in diameter, the mouse was sacrificed and the tumor divided into sections for snap freezing, frozen section, formalin fixation, conventional cell culture or serial passage. All animal studies were performed in accordance with protocols approved by the Johns Hopkins University Animal Care and Use Committee.
Serial passage in vivo was performed by disaggregating the tumor as described above. Aliquots of cells were then injected into the flanks of athymic nude mice in Matrigel, or cryopreserved in 90% RPMI (Invitrogen)/10% DMSO (Sigma). Conventional cell lines were established by seeding an aliquot of disaggregated cells in culture with Advanced RPMI (Invitrogen)/1% Bovine Calf Serum (Invitrogen). Cell lines were passaged and cryopreserved in standard fashion for SCLC cultures. Publically available SCLC cell lines were obtained from ATCC and cultured in Advanced RPMI (Invitrogen)/1% Bovine Calf Serum. Xenografts derived from these conventional cell lines were grown in the flanks of nude mice as described above. Orthotopic xenografts were generated by dorsoscapular, transcutaneous injection of cells suspended in Matrigel into the right lung of nude mice, essentially as described (12).
Assessment of SCLC phenotype
At each passage in vivo and at every 3 months in vitro, cell suspensions were immunophenotyped by FACS analysis (FACScalibur, BD Biosciences) with antibodies to human CD56, (BD Biosciences). Genomic DNA was purified using DNAzol (Invitrogen). Total RNA was purified using RNAzol (Invitrogen), followed by a secondary purification using the RNEasy system (Qiagen). Standard Affymetrix expression microarray protocols were used for all array studies.
Gene expression annotation and pre-processing
Gene-expression analysis from our xenograft samples were assumed to be human-specific based on (i) quantitative RT-PCR analysis demonstrating that mouse mRNA contributed between 1/8–1/16 of the total mRNA (data not shown), and (ii) probesets developed by Affymetrix that are highly specific for each species7. We complemented our gene expression experiments with additional data sets retrieved from the NCBI Gene Expression Omnibus (GEO) database (13). Gene annotation for all the platforms considered was obtained from R-Bioconductor metadata packages (14). For a complete description of platforms and data sets, see Supplementary Information, Table 1. Raw gene expression intensities for all samples were normalized at the probe-level using the RMA algorithm as described by Irizarry et al (15). To compare gene expression across different Affymetrix platforms we first used Entrez Gene identifiers as cross-referencing keys, and then matched all the individual probes at the sequence level to those contained in the hgu133a platform to control laboratory and batch effects using the ‘barcode’ RMA preprocessing algorithm described by Zilliox and Irizarry (16). Standardization across DNA-chips was attained by quantile normalization (17). Details are reported in Supplementary Information Fig 17,18.
Differential gene expression analysis
In all data sets considered in the present study differential gene expression was investigated using functions and methods implemented in the R/Bioconductor (14, 18) package limma (19). Briefly, a fixed effects linear model was fit for each individual feature to estimate expression differences between groups of samples to be compared. When technical replicates or matched samples from the same individual were available, replicates were used as blocks and the average correlation within the blocks was estimated and used in the model (20). An empirical Bayes approach was applied to moderate standard errors of normalized logarithmic fold-change (M-values) (19). Finally, for each analyzed feature, moderated t-statistics, log-odds ratios of differential expression (B-statistics), raw and adjusted p-values (FDR control by the Benjamini and Hochberg method (21)) were obtained. Details are reported in Supplementary Information. Raw expression data and the MIAME required information are currently available at9, and will be permanently hosted in the Gene Expression Omnibus database upon publication.
Analysis of functional annotation
To capture biological processes relevant in the investigated sample groups we performed Analysis of Functional Annotation (AFA). Functional Gene Sets (FGS), in the form of lists of genes sharing specific biological properties, were obtained from the Gene Ontology database (22–24), KEGG pathway database (25), and from the Molecular Signature Database (MsigDb)8 (26). The AFA was performed by one-sided Wilcoxon test, after ranking the genes by their absolute moderated t-statistics. Multiple testing correction was performed separately for each functional scope (GO, KEGG, and MsigDb) by the Benjamini and Hochberg method (21). Mappings between individual probes on the array to the various functional themes were based on NCBI Entrez Gene identifiers obtained from the R-Bioconductor metadata packages. Overall, this approach is analogous to Gene Set Enrichment Analysis (GSEA) like procedures (26, 27). Details are reported in Supplementary Information.
Relationships among different sample groups
To compare gene expression data among distinct sample groups we compared the lists of differentially expressed genes obtained from the linear model analysis, we computed the squared correlation between normalized gene expression measurements and log2 fold-changes (M-values) across samples, and we used the “correspondence-at-the-top” plot (cat-plot) technique (28). This latter method is specifically designed to assess the agreement and similarity between microarray experiments, where it expected that only a small fraction of genes would be differentially expressed across the large total number of analyzed genes. Principal coordinates analysis and multidimensional scaling was performed using 1-correlation as a measure of distance. Details are reported in Supplementary Information.
Results
Characterization of the primary SCLC xenograft model
An overview of the experimental model is shown in Fig. 1A. With serial passage in vivo, all three primary xenograft lines (LX22, 33, 36) maintained a typical histopathologic appearance ((11) and data not shown). Cell lines derived from each of these xenografts grew as loose aggregates or spheroids typical of SCLC cell lines (9) (data not shown). Immunohistochemical and FACS analysis of freshly isolated cells from each xenograft demonstrated strong expression of human CD56, a marker of neural differentiation in >95% of the cells ((11) and data not shown). Cell lines derived from each xenograft line (LX22CL, 33CL and 36CL) also retained strong immunoreactivity for CD56 (data not shown).
Figure 1.
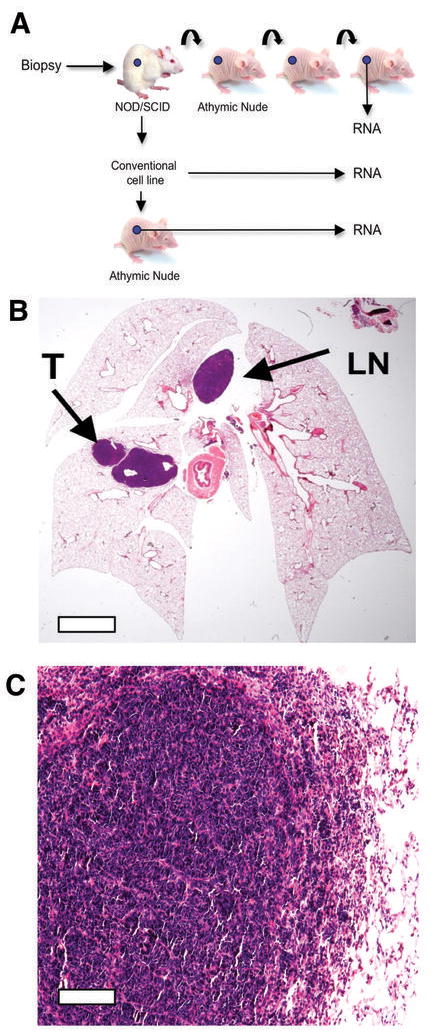
Generation and characterization of the SCLC primary xenograft model. A, Outline of the experimental approach from primary sample, xenograft, cell line and secondary xenograft from the derived cell line. B, H&E stained section of mouse lungs following orthotopic injection of the LX22 xenograft. The “primary” tumor (T) and metastasis in mediastinal lymph node (LN) are highlighted. Scale bar = 1mm C, H&E stained section of the intrapulmonary tumor shown in B. Scale bar = 20μm.
To further characterize this model, we performed orthotopic tumor implantation using a transcutaneous injection approach. All 3 xenograft lines readily grew in the lungs of nude mice, where they formed discrete “primary tumors”, as well as metastasis to regional mediastinal lymph nodes (Fig. 1B), typical of the pattern seen in human SCLC patients. As shown in Fig 1C, intrapulmonary tumors displayed typical SCLC histology, and aggressively invaded lung parenchyma and vessels. These data demonstrate that this experimental system closely resembles human SCLC in vivo. An additional series of xenografts from well-characterized SCLC cell lines from ATCC were also generated, and all grew as flank xenografts with characteristic SCLC histology.
Organization of gene expression analysis
Samples of RNA derived from the primary xenograft model were grouped into “triplets” obtained from each primary xenograft (XG), its derived cell line (CL) and a secondary xenograft derived from that cell line (CLX). RNA was also purified from 11 well characterized, commonly used SCLC cell lines (H69, H82, H128, H146, H187, H209, H345, H446, H526, H1618, and H1930) and their paired xenografts. De novo expression array analysis was then performed on laboratory model triplets (XG, CL, and CLX) from three distinct patients (LX22, LX33, and LX36), on laboratory model pairs (CL and CLX) from ATCC SCLC cell lines, and on total RNA from normal human lung and universal human reference RNA (Stratagene), using the hgu133plus2 Affymetrix array. These data were complemented with expression data from the public domain, and with 2 de novo data sets, one accounting for 4 additional SCLC cell lines without a paired xenograft, and one for 4 primary SCLC specimens independent from the laboratory models described above
Public domain expression data were obtained from the GEO database (13), which included expression analyses of normal lung specimens, SCLC cell lines and xenografts, and primary tumors (series GSE3526, GSE7307, GSE8920, GSE7097 (29), GSE4127, GSE4824 GSE7670 (30), GSE2361, GSE6044) (31), and one data set was obtained from the Broad Institute website10 (32). Overall 192 arrays from 13 data sets (5 Affymetrix platforms) were analyzed, accounting for 62 normal lung samples, 19 primary SCLC, 4 primary xenografts (3 patients), 22 secondary xenografts, and 85 SCLC cell lines. Details of the samples and public domain data used in this analysis are shown in Supplementary Information, Table 1. Preprocessing details are reported in Supplementary Information, Fig. 1–4.
Differentially expressed genes in the primary xenograft model
Results of the linear model analysis are shown in Fig. 2. The direct comparisons among the three different type of samples analyzed (XG, CL, and CLX) revealed three sets of differentially expressed genes: 395 significantly different (adjusted P-value < 0.005) when comparing primary xenografts (XG) to their matched derived cell line (CL), 152 were different when comparing XG to their derivative secondary xenografts (CLX), while only 26 genes were differentially expressed when comparing CL to CLX (Fig. 2A and Supplementary Tables A–C). Similar findings were obtained when the triplet samples were compared using gene expression changes with respect to the universal reference RNA, or the normal lung specimen (Supplementary Information Fig. 5,6). The overall squared correlation among the groups of samples analyzed proved to be higher in all comparisons of derived cell lines with their derivative xenografts (Fig. 2B). Similarly, cat-plots show that a higher proportion of differentially expressed genes were in common between cell lines and their derivative xenografts (Fig. 2C; Supplementary Information, Fig 10,11). These data support the notion that gene expression programs change when cell lines are derived in vitro, and that the expression of a significant number of such genes is not restored when the derivative cell line is returned to growth in vivo as a xenograft.
Figure 2.
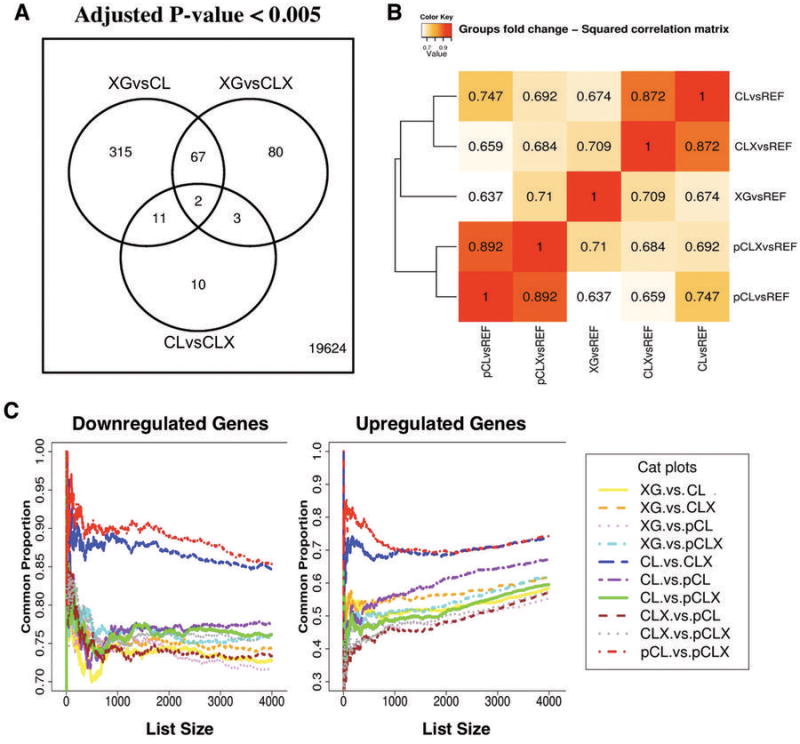
Differential Expression Analysis in the Primary Xenograft Model. A, Venn Diagram showing the number of differentially expressed genes (adjusted P-value < 0.005) in direct comparisons among primary xenografts (XG), the matched cell lines (CL), the xenografts obtained from these cell lines (CLX). Only 26 genes were differentially expressed between CL and CLX (CLvsCLX), 152 between XG and CLX (XGvsCLX), and 395 between XG and CL (XGvsCL). B, Hierarchical clustering of pair-wise squared correlations between distinct groups of samples. Matched triplets of samples are denoted as XG, CL, and CLX, while pairs of independent samples from established cell lines and from the public domain (CL and CLX) are denoted by the prefix ‘p’. All correlations were computed between mean fold-changes of each sample group compared to the universal reference RNA (Strategene). Comparisons involving CL and CLX groups (CLvsREF, CLXvsREF, CLvsREF, pCLXvsREF) proved to be more correlated than any other comparison involving the primary xenografts group (XGvsREF). C, Correspondence-at-the-top plots (CAT-plots) for all pair-wise comparisons among triplets and pairs of samples. The notation is used is the same as in C. Genes were ranked by the mean fold-change of each sample group compared to the universal reference RNA. On the left is shown the correspondence for the most down regulated genes (4000), and on right for the most up regulated genes (400). The red and the blue lines on the top of the CAT-plot represent the comparisons between CL and CLX for matched triplets and pairs of samples, and show the highest correspondence. For the up-regulated genes, the purple line represents the comparison between cell lines derived from our xenografts (CL) and cell lines from the public domain (pCL). This comparison shows more similarity than when XG are compared to CL.
Analysis of functional annotation in the primary xenograft model
Several functional themes were explored by Analysis of Functional Annotation (AFA) to discover common alterations in biological processes within the model. Gene Ontology (GO), KEGG, and Functional Gene Sets from the Molecular Signature Data Base were used in a Wilcoxon rank-sum test, after ordering the genes according to the moderated t-statistics obtained after fitting the linear models. Overall this analysis showed that both multiple pathways and biological processes are enriched in the comparisons between the model samples groups, and that different genes were responsible for the individual enrichments, including genes coding for transcription factors, adhesion and extra-cellular matrix molecules, apoptosis pathways, RNA metabolism and metabolic enzymes. The results of this analysis using KEGG pathways are shown in Fig. 3. Highly significant enrichment was seen in several pathways relevant to preclinical cancer modeling, including keratan sulfate biosynthesis, aminoacyl-tRNA biosynthesis pathway, MAPK signaling, TGF-beta signaling, apoptosis and proteasomal function. The marked changes in gene expression in the apoptosis pathway are also consistent with the findings of Hann et al (11), who showed that sensitivity to the BCL2 antagonist ABT-737 was a feature of SCLC cell lines and their paired xenografts, and was associated with high level BCL2 expression. Lower levels of BCL2 expression seen in our primary xenograft lines in vivo correlated with resistance to this therapy. All other results and the genes driving the enrichment are reported in Supplementary Information Fig. 13–16, and in Supplementary Tables D–E.
Figure 3.
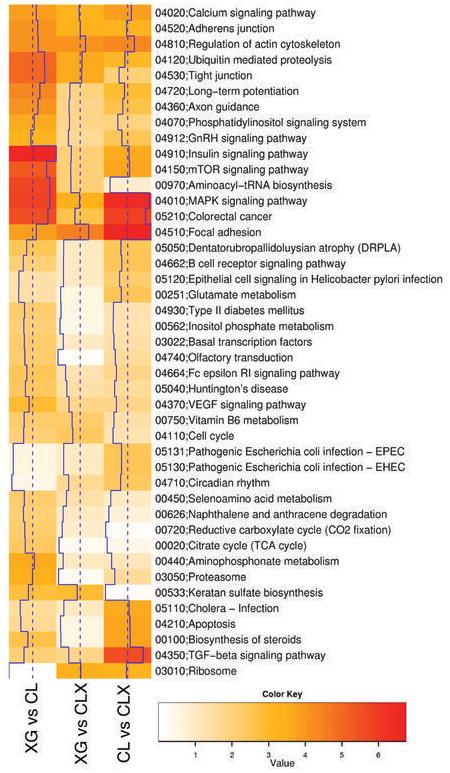
Analysis of Functional Annotation (AFA). Heat-map showing AFA results for KEGG pathways. Color-coded values correspond to absolute values of base 10 logarithms of raw P-values from the Wilcoxon rank sum test. Vertical blue lines show the same data as a histogram value for each color intensity. All pathways shown proved to be enriched in at least one comparison (adjusted P-value < 0.05). Rows were clustered using Euclidian distance and the average clustering method; columns were not reordered. Several pathways showed significant results changes in all comparisons, although different sets of genes proved to be responsible for the enrichment, while a number of pathways (i.e. Keratan sulfate biosynthesis) proved to be enriched in a subset of the contrasts considered (see Supplementary Tables A–C for genes involved and analysis of additional functional scopes, including Gene Ontology).
Analysis of changes in gene expression induced by cell culture
To characterize gene expression changes induced by cell culture we directly compared the model samples to primary tumors using linear model analysis in a combined data set accounting for primary SCLC specimens from several public sources and from our laboratory. We performed this analysis using all the genes in common among the platforms, before and after removing the inter-laboratory effect using the empirical gene expression distribution described by Zilliox and Irizarry (16) (see Supplementary Information). When we compared the models separately (either XG, CL, or CLX) to the primary tumors, most of the differentially expressed genes were in common. This group of differentially expressed genes results from the comparison of fairly pure samples in terms of cell lineage (SCLC xenograft model samples) with a complex tissue accounting for stromal cells, lymphocytes and cancer cells (the primary tumors). Nevertheless, a number of genes proved to change only in specific contrasts, and also in this case fewer differentially expressed genes were found when primary xenografts were compared to tumors, than in the comparisons involving the cell lines and the secondary xenografts (Fig. 4A). In this aggregated analysis we also compared the laboratory models and the primary SCLC to a large group of normal lung specimens, thus identifying the gene expression signature present in the primary tumors and conserved in all the laboratory models (Supplementary Information Fig 16,19–25 and Supplementary Table G).
Figure 4.
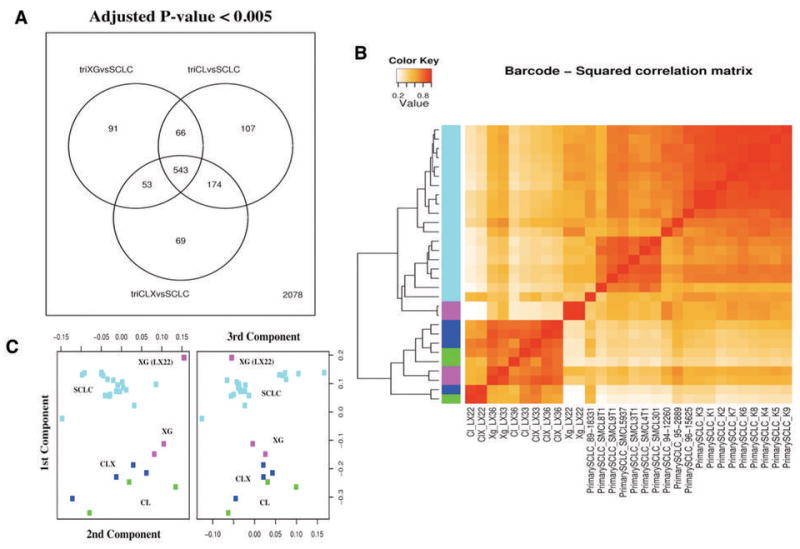
Comparison between laboratory model samples and primary small cell lung cancer (SCLC) specimens. (A) Venn diagram showing the number of differentially expressed genes (adjusted P-value < 0.005) in direct comparisons among primary xenografts (XG), the matched cell lines (CL), the xenografts obtained from these cell lines (CLX) and the group of primary SCLC. A group of 543 genes proved to be differentially expressed between all laboratory model groups (XG, CL, and CLX) and the primary SCLC. This group of genes accounts for genes expressed in cell types present only in primary tumors, such as genes expressed in lymphocytes, stromal cells present in the primary SCLC, and represent the difference in complexity between specimens obtain in vivo with respect to the laboratory models. A number of genes proved different between each group (XG, CL, and CLX) and the primary SCLC: only 91 genes were differentially expressed between XG and SCLC, while 174 were genes differentially expressed between CL and CLX and SCLC. (B) Hierarchical clustering of all pairwise squared correlations between individual samples, based on gene expression levels after barcode-RMA and quantile normalization. Individual primary Small Cell Lung Cancer (SCLC, cyan), primary xenografts (XG, purple), cell lines (CL, green), and xenografts from these cell lines (CLX, blue) are shown. Correlations were computed using all genes (181) that proved to be differentially expressed (adjusted P-value < 0.05) in any comparison between XG, CL, and CLX and that were present in all platforms. Overall the primary xenografts (XG) proved to be more correlated with the primary SCLC than any other sample. Among primary xenografts (XG), the LX22 sample proved to be more correlated to primary SCLC than to its derivative CL and CLX. (C) Multidimensional scaling plot showing the relationships among all individual SCLC, XG, CL, and CLX samples. SCLC are shown in cyan, XG in purple, CL in green, and CLX in blue. The XG samples from LX22 patient proved to be the most similar to primary SCLC samples than to its derivative CL and CLX.
One major problem when comparing expression array data from primary tumor samples with those derived from cell lines is that stromal and lymphoid gene expression in the primary tumor can create marked differences in gene expression that are not tumor-specific. In order to overcome this problem, we searched for highly significant changes in gene expression within the three groups of the xenograft model (XG, CL, CLX), where only human-specific, tumor-specific genes are analyzed. To this end, we selected genes whose expression varied in any comparison between within our laboratory model (XG, CL, CLX), and used this gene set to compare our xenograft model to primary SCLC samples. In this analysis, the primary xenografts more closely resembled primary tumors than derivative cell lines and the secondary xenografts, as shown by all the pair-wise squared correlations and by multidimensional scaling of the first three components. (Fig. 4B and C). This is particularly evident in the LX22 model, in which the differences in gene expression are evident in the primary xenograft, but are lost both in the derivative cell line and secondary xenograft (Fig. 4B and C). Similar findings were also obtained by using different stringency criteria to select the genes differentially expressed in the laboratory models, and both by mapping the genes predicted in our direct comparison of the models (see Figure 2), or by predicting the gene set on the combined data set (see Supplementary Information).
Most significantly, a group of genes was identified across the three models that were differentially expressed when comparing the primary xenograft lines, the xenograft-derived cell lines, and the secondary xenografts derived from these cell lines. This represents an expression signature of the permanent effects of tissue culture on gene expression in SCLC, and includes genes known to be important in tumor growth such as IGFBP4, ITPR3, COX10, NKX2.1, CXCR4, CDH1, DAP3, CXCR7, TLE2 (a detailed list of these genes in shown in Table 1 and Supplementary Table H).
Table 1.
List of genes that are permanently changed by cell culture. The Table shows the genes that are differentially expressed (adjusted P-value < 0.005) between XG and CL and between XG and CLX, but not between CL and CLX. Fold-change (logarithmic scale on base 2) are shown for each comparison.
| Fold Change (Log2) | Adjusted P value | |||||||
|---|---|---|---|---|---|---|---|---|
| Entrez ID | Symbol | Gene Name | XGvCL | CLvsCLX | XGvsCLX | XGvsCL | CLvsCLX | XGvsCLX |
| 2261 | FGFR3 | fibroblast growth factor receptor 3 | 5.65 | −0.4 | 5.25 | 0 | 0.91 | 0 |
| 94235 | GNG8 | guanine nucleotide binding protein (G protein), gamma 8 | 4.94 | −0.04 | 4.9 | 0 | 1 | 0 |
| 3306 | HSPA2 | heat shock 70kDa protein 2 | 4.84 | −0.7 | 4.14 | 0.01 | 0.9 | 0.02 |
| 283120 | H19 | H19, imprinted maternally expressed transcript | 4.96 | −1.54 | 3.56 | 0 | 0.52 | 0.02 |
| 283131 | TncRNA | trophoblast-derived noncoding RNA | 4.11 | −0.17 | 4.39 | 0 | 0.84 | 0 |
| 64065 | PERP | PERP, TP53 apoptosis effector | 4.43 | −0.98 | 3.9 | 0.02 | 0.84 | 0.03 |
| 4821 | NKX2-2 | NK2 homeobox 2 | 4.17 | −0.27 | 3.91 | 0.03 | 0.98 | 0.03 |
| 999 | CDH1 | cadherin 1, type 1, E-cadherin (epithelial) | 4.09 | −0.31 | 3.79 | 0.04 | 0.97 | 0.05 |
| 55466 | DNAJA4 | DnaJ (Hsp40) homolog, subfamily A, member 4 | 4.14 | −0.31 | 3.74 | 0 | 0.25 | 0 |
| 4070 | TACSTD2 | tumor-associated calcium signal transducer 2 | 3.96 | −0.22 | 3.67 | 0.01 | 0.4 | 0.02 |
| 7852 | CXCR4 | chemokine (C-X-C motif) receptor 4 | 4.22 | −1.09 | 3.38 | 0 | 0.62 | 0.01 |
| 1299 | COL9A3 | collagen, type IX, alpha 3 | 3.71 | 0.12 | 3.83 | 0 | 0.98 | 0 |
| 57007 | CXCR7 | chemokine (C-X-C motif) receptor 7 | 4.89 | −0.25 | 2.64 | 0 | 0.53 | 0 |
| 6662 | SOX9 | SRY (sex determining region Y)-box 9 | 3.74 | −0.29 | 3.54 | 0.03 | 0.97 | 0.03 |
| 54492 | LOC54492 | hypothetical LOC54492 | 3.82 | −0.38 | 3.44 | 0.02 | 0.95 | 0.03 |
| 2820 | GPD2 | glycerol-3-phosphate dehydrogenase 2 (mitochondrial) | 5.5 | −0.5 | 1.75 | 0 | 0.92 | 0 |
| 164633 | CABP7 | calcium binding protein 7 | 3.47 | 0.17 | 3.64 | 0.02 | 0.98 | 0.02 |
| 219844 | HYLS1 | hydrolethalus syndrome 1 | 3.66 | −0.24 | 3.42 | 0.01 | 0.97 | 0.02 |
| 3481 | IGF2 | insulin-like growth factor 2 (somatomedin A) | 2.54 | −0.26 | 4.44 | 0.01 | 0.45 | 0.02 |
| 5349 | FXYD3 | FXYD domain containing ion transport regulator 3 | 3.58 | −0.38 | 3.28 | 0.02 | 0.85 | 0.03 |
| 4246 | SCGB2A1 | secretoglobin, family 2A, member 1 | 3.55 | −0.28 | 3.28 | 0.01 | 0.96 | 0.01 |
| 5617 | PRL | prolactin | 4.06 | −1.32 | 2.74 | 0.01 | 0.59 | 0.04 |
| 3963 | LGALS7 | lectin, galactoside-binding, soluble, 7 (galectin 7) | 3.23 | 0.28 | 3.51 | 0.05 | 0.97 | 0.03 |
| 25878 | MXRA5 | matrix-remodelling associated 5 | 3.3 | 0.05 | 3.35 | 0 | 0.99 | 0 |
| 10653 | SPINT2 | serine peptidase inhibitor, Kunitz type, 2 | 3.46 | −0.36 | 3.1 | 0.03 | 0.96 | 0.04 |
| 2977 | GUCY1A2 | guanylate cyclase 1, soluble, alpha 2 | −2.07 | 0.26 | −1.81 | 0.01 | 0.92 | 0.02 |
| 255231 | MCOLN2 | mucolipin 2 | −1.6 | −0.7 | −2.31 | 0.03 | 0.72 | 0.02 |
| 8715 | NOL4 | nucleolar protein 4 | −2.19 | 0.39 | −1.8 | 0.01 | 0.87 | 0.03 |
| 3709 | ITPR2 | inositol 1,4,5-triphosphate receptor, type 2 | −1.87 | −0.84 | −2.11 | 0.01 | 0.53 | 0 |
| 11001 | SLC27A2 | solute carrier family 27 (fatty acid transporter), member 2 | −1.84 | −0.33 | −2.17 | 0.04 | 0.91 | 0.02 |
| 54530 | C1orf218 | chromosome 1 open reading frame 218 | −2.26 | 0.42 | −1.84 | 0.01 | 0.87 | 0.04 |
| 6507 | SLC1A3 | (glial high affinity glutamate transporter), member 3 | −1.89 | −0.35 | −2.25 | 0.03 | 0.62 | 0.01 |
| 5028 | P2RY1 | purinergic receptor P2Y, G-protein coupled, 1 | −1.35 | 0.85 | −2.8 | 0.05 | 0.44 | 0.02 |
| 7325 | UBE2E2 | ubiquitin-conjugating enzyme E2E 2 | −2.25 | −0.76 | −1.91 | 0.02 | 0.51 | 0.03 |
| 169200 | TMEM64 | transmembrane protein 64 | −2.22 | −0.25 | −2.03 | 0.01 | 0.38 | 0.04 |
| 5308 | PITX2 | paired-like homeodomain 2 | −2.16 | 0.06 | −2.1 | 0.02 | 0.99 | 0.03 |
| 51678 | MPP6 | membrane protein, palmitoylated 6 | −2.18 | −0.05 | −2.22 | 0.02 | 0.99 | 0.02 |
| 1491 | CTH | cystathionase (cystathionine gamma-lyase) | −2.54 | 1.24 | −1.86 | 0 | 0.25 | 0.03 |
| 79071 | ELOVL6 | ELOVL family member 6 | −2.54 | 0.49 | −2.05 | 0.01 | 0.85 | 0.03 |
| 153 | ADRB1 | adrenergic, beta-1-, receptor | −2.34 | 0.14 | −2.36 | 0.02 | 0.74 | 0.02 |
| 401097 | LOC401097 | Similar to LOC166075 | −2.42 | −0.29 | −2.71 | 0.04 | 0.95 | 0.02 |
| 80144 | FRAS1 | Fraser syndrome 1 | −2.33 | −0.52 | −2.82 | 0.03 | 0.57 | 0.01 |
| 594855 | CPLX3 | complexin 3 | −2.89 | 1.08 | −2.26 | 0.01 | 0.74 | 0.03 |
| 3049 | HBQ1 | hemoglobin, theta 1 | −2.28 | −0.6 | −2.88 | 0.03 | 0.81 | 0.01 |
| 54941 | RNF125 | ring finger protein 125 | −2.35 | −0.47 | −2.82 | 0.01 | 0.82 | 0 |
| 6096 | RORB | RAR-related orphan receptor B | −2.65 | 0.8 | −2.57 | 0.01 | 0.45 | 0.01 |
| 285368 | PRRT3 | proline-rich transmembrane protein 3 | −2.91 | 0.54 | −2.37 | 0.01 | 0.87 | 0.04 |
| 84864 | MINA | MYC induced nuclear antigen | −2.69 | 0.55 | −2.68 | 0.04 | 0.85 | 0.04 |
| 29953 | TRHDE | thyrotropin-releasing hormone degrading enzyme | −3.05 | 0.4 | −2.64 | 0 | 0.86 | 0 |
| 8835 | SOCS2 | suppressor of cytokine signaling 2 | −3.82 | 1.16 | −2.66 | 0 | 0.55 | 0.02 |
Overall these results demonstrate that tumors cells acclimated to standard cell culture conditions cannot completely regain the gene expression profile characteristic of SCLC in humans.
Validation of gene expression changes
We next sought to validate the gene expression changes observed in our primary xenograft model using quantitative real-time RT-PCR, with particular emphasis on expression changes that were not reversed when cell lines were reimplanted as xenografts. As shown in Fig. 5, irreversible changes in gene expression were quantitatively confirmed for 12 genes that were downregulated (Fig. 5A), and 10 that were upregulated (Fig. 5B) following the transition cell culture in vitro. These data confirm that marked changes in gene expression result during the transition from growth in vivo to culture in vitro, and that these changes are irreversible.
Figure 5.
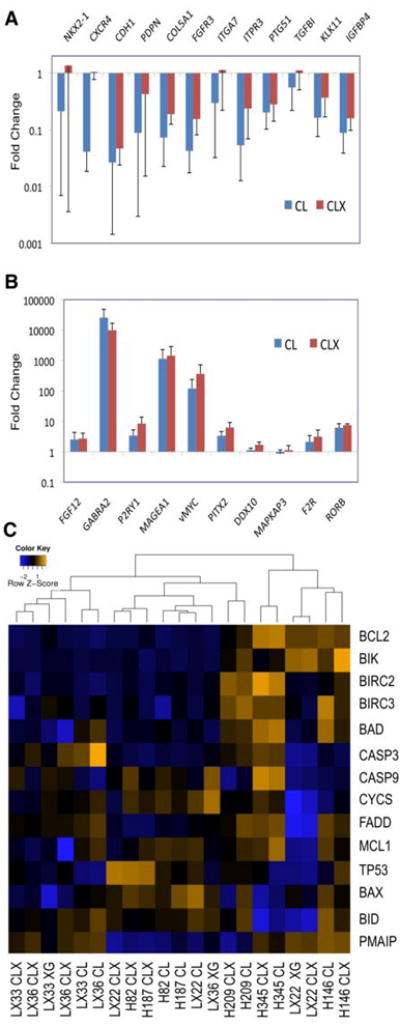
Validation of gene expression genes in the primary SCLC xenograft model. Expression levels in derivative cell lines (CL) and secondary xenografts (CLX) were compared to those in the corresponding primary xenograft, and are shown as the mean of paired data from all three xenograft lines (n=6). Error bars indicate standard errors. Genes selected from the microarray data (shown on the x axis) were upregulated (A) or downregulated (B) relative to expression in the primary xenograft samples. (C) Heat map expression analysis of BCL2-related genes in SCLC models. The RNA samples are listed as columns, and the genes in rows. The color scale represents the level of expression from low (blue) to high (orange).
A recent study using our xenograft model analyzed the preclinical efficacy of the BCL2 antagonist ABT-737 as a potential targeted therapy for SCLC (11). Four cell lines (NCI-H146, H187, H209, and H345) proved sensitive, while the cell line H82, with markedly lower expression of BCL2 protein, proved resistant. The efficacy of ABT-737 in controlling the tumor growth in vivo using our primary xenografts models (LX22, LX33, and LX36) proved variable, and seemed to correlate with BCL2 protein expression (11). As a further validation of our analysis, we determined the expression of BCL2 and BCL2-related genes in the same models as used in the ABT-737 study (11). As shown in the heat map analysis (Fig. 5C), the expression of BCL2, and of functionally related genes such as BID, BAX and MCL1, varied significantly in the different SCLC models analyzed. In addition, the expression pattern of BCL2 was consistent with the Western blot analysis of BCL2 protein expression in LX22 33 and 36 (11). These data highlight the potential variability in preclinical cell culture models in the investigation of novel targeted agents.
Discussion
Preclinical cancer biology and drug development have traditionally relied on the use of cell lines that are able to grow in serum-containing media, and on artificial surfaces. Considerable debate has focused on the reliability of such cell lines as cancer models, and of their ability to predict the success of novel therapies in humans (33–35). Recent attention has focused on the use of primary xenografts as a way to better model cancer in vivo (36). Although this approach is time consuming and labor-intensive, emerging evidence that these models retain important biological properties that are seen in the primary tumor, including gene amplification (4), genomic architecture (37), characteristic histopathology (38–41), gene expression (42) and cancer stem cell biology (43, 44). By contrast, emerging evidence supports the contention that primary xenografts differ substantially from their parent tumor by acquiring new genomic changes, faster growth rates and nuclear pleomorphism (45, 46).
In 2007, Dangles-Marie et al compared colon cancer primary xenografts to matched cell lines, and demonstrated variable changes in expression of a panel of 66 genes (47). Most importantly, these cells lines differed markedly in their sensitivities to standard chemotherapeutic agents derived from their matched xenografts (47). In our study, we explored the idea that primary xenografts may represent a useful preclinical model in SCLC, a tumor in which little therapeutic progress has been made in the last 30 years. Using a prospective, unbiased, bioinformatics-based approach, we were able to observe marked changes in gene expression as SCLC cells transitioned to standard cell culture conditions. In many cases, these changes were not reversed when cell lines were re-established as xenografts. Even more striking was that these expression changes occurred in a large number of critically important cancer signaling pathways of direct relevance to targeted therapies, stromal interactions, developmental signaling and chemosensitivity.
Interestingly, when analyzing the genes whose expression changed most significantly in the transition to cell culture, expression patterns in our primary xenograft lines were more closely matched to those seen in primary SCLC tissues than in cell lines or cell-line derived models. Moreover, the tendency of tissue culture to reduce the differential gene expression patterns in lines derived from different patients suggests that heterogeneity in tumor cell biology may be under-represented in cell culture systems. The ability of our SCLC models, and of other primary xenograft systems, to predict therapeutic efficacy of cytotoxic and targeted agents in patients will be a more rigorous test of any potential clinical application of this approach.
Supplementary Material
Acknowledgments
Financial Support and Acknowledgements: American College of Surgeons (VC Daniel), NIH/NCI SPORE P50 CA058184 (DN Watkins, CD Peacock, WL Devereux, R Yung), The Flight Attendant Medical Research Institute (DN Watkins, CD Peacock, CM Rudin, JS Hierman, L Marchionni), The Burroughs Wellcome Foundation (DN Watkins, CM Rudin) and Genentech Inc (CD Peacock), NSF DMS0342111, and NIH/NCRR 1U54RR023561-01A1 (L Marchionni). We wish to thank Rafel Irizarry for comments and help with the analysis.
Footnotes
Conflict of Interest: DN Watkins is a former paid consultant for Genentech Inc., with no ongoing financial interest. CD Peacock received salary support through a gift from Genentech Inc.
References
- 1.Jemal A, Siegel R, Ward E, Murray T, Xu J, Thun MJ. Cancer statistics, 2007. CA: a cancer journal for clinicians. 2007;57(1):43–66. doi: 10.3322/canjclin.57.1.43. [DOI] [PubMed] [Google Scholar]
- 2.Pisick E, Jagadeesh S, Salgia R. Small cell lung cancer: from molecular biology to novel therapeutics. Journal of experimental therapeutics & oncology. 2003;3(6):305–18. doi: 10.1111/j.1533-869x.2003.01103.x. [DOI] [PubMed] [Google Scholar]
- 3.Zochbauer-Muller S, Pirker R, Huber H. Treatment of small cell lung cancer patients. Ann Oncol. 1999;10(Suppl 6):83–91. doi: 10.1023/a:1008333713858. [DOI] [PubMed] [Google Scholar]
- 4.Pandita A, Aldape KD, Zadeh G, Guha A, James CD. Contrasting in vivo and in vitro fates of glioblastoma cell subpopulations with amplified EGFR. Genes Chromosomes Cancer. 2004;39(1):29–36. doi: 10.1002/gcc.10300. [DOI] [PubMed] [Google Scholar]
- 5.De Witt Hamer PC, Van Tilborg AA, Eijk PP, et al. The genomic profile of human malignant glioma is altered early in primary cell culture and preserved in spheroids. Oncogene. 2007 doi: 10.1038/sj.onc.1210850. [DOI] [PubMed] [Google Scholar]
- 6.Vescovi AL, Galli R, Reynolds BA. Brain tumour stem cells. Nat Rev Cancer. 2006;6(6):425–36. doi: 10.1038/nrc1889. [DOI] [PubMed] [Google Scholar]
- 7.Clement V, Sanchez P, de Tribolet N, Radovanovic I, Ruiz i Altaba A. HEDGEHOG-GLI1 signaling regulates human glioma growth, cancer stem cell self-renewal, and tumorigenicity. Curr Biol. 2007;17(2):165–72. doi: 10.1016/j.cub.2006.11.033. [DOI] [PMC free article] [PubMed] [Google Scholar]
- 8.Sasai K, Romer JT, Lee Y, et al. Shh pathway activity is down-regulated in cultured medulloblastoma cells: implications for preclinical studies. Cancer Res. 2006;66(8):4215–22. doi: 10.1158/0008-5472.CAN-05-4505. [DOI] [PubMed] [Google Scholar]
- 9.Phelps RM, Johnson BE, Ihde DC, et al. NCI-Navy Medical Oncology Branch cell line data base. Journal of cellular biochemistry. 1996;24:32–91. doi: 10.1002/jcb.240630505. [DOI] [PubMed] [Google Scholar]
- 10.Hodkinson PS, Mackinnon AC, Sethi T. Extracellular matrix regulation of drug resistance in small-cell lung cancer. Int J Radiat Biol. 2007:1–9. doi: 10.1080/09553000701570204. [DOI] [PubMed] [Google Scholar]
- 11.Hann CL, Daniel VC, Sugar EA, et al. Therapeutic efficacy of ABT-737, a selective inhibitor of BCL-2, in small cell lung cancer. Cancer Res. 2008;68(7):2321–8. doi: 10.1158/0008-5472.CAN-07-5031. [DOI] [PMC free article] [PubMed] [Google Scholar]
- 12.Vertrees RA, Deyo DJ, Quast M, Lightfoot KM, Boor PJ, Zwischenberger JB. Development of a human to murine orthotopic xenotransplanted lung cancer model. J Invest Surg. 2000;13(6):349–58. [PubMed] [Google Scholar]
- 13.Wheeler DL, Barrett T, Benson DA, et al. Database resources of the National Center for Biotechnology Information. Nucleic Acids Res. 2008;36(Database issue):D13–21. doi: 10.1093/nar/gkm1000. [DOI] [PMC free article] [PubMed] [Google Scholar]
- 14.Gentleman R, Carey VJ, Bates DM, et al. Bioconductor: open software development for computational biology and bioinformatics. Genome Biol. 2004;R80:1465–6914. doi: 10.1186/gb-2004-5-10-r80. [DOI] [PMC free article] [PubMed] [Google Scholar]
- 15.Irizarry RA, Hobbs B, Collin F, et al. Exploration, normalization, and summaries of high density oligonucleotide array probe level data. Biostatistics (Oxford, England) 2003;4(2):249–64. doi: 10.1093/biostatistics/4.2.249. [DOI] [PubMed] [Google Scholar]
- 16.Zilliox MJ, Irizarry RA. A gene expression bar code for microarray data. Nature methods. 2007;4(11):911–3. doi: 10.1038/nmeth1102. [DOI] [PMC free article] [PubMed] [Google Scholar]
- 17.Yang YH, Thorne N. Normalization for two color cDNA microarray data. Science and Statistics: A Festschrift for Terry Speed. 2003:403–18. [Google Scholar]
- 18.Ihaka R, Gentleman R. A language for data analysis and graphics. Journal of Computational and Graphical Statistics. 1996;5:299–314. [Google Scholar]
- 19.Smyth GK. Linear models and empirical Bayes methods for assessing differential expression in microarray experiments. Statistical Applications in Genetics and Molecular Biology. 2004 doi: 10.2202/1544-6115.1027. [DOI] [PubMed] [Google Scholar]
- 20.Smyth GK, Michaud J, Scott HS. Use of within-array replicate spots for assessing differential expression in microarray experiments. Bioinformatics. 2005;21(9):2067–75. doi: 10.1093/bioinformatics/bti270. [DOI] [PubMed] [Google Scholar]
- 21.Benjamini Y, Hochberg Y. Controlling the false discovery rate: a practical and powerful approach to multiple testing. Journal of the Royal Statistical Society. 1995;57:289–300. [Google Scholar]
- 22.Ashburner M, Ball CA, Blake JA, et al. Gene ontology: tool for the unification of biology. The Gene Ontology Consortium Nat Genet. 2000;25(1):25–9. doi: 10.1038/75556. [DOI] [PMC free article] [PubMed] [Google Scholar]
- 23.Ashburner M, Lewis S. On ontologies for biologists: the Gene Ontology--untangling the web. Novartis Found Symp. 2002;247:66–80. discussion -3, 4–90, 244–52. [PubMed] [Google Scholar]
- 24.Harris MA, Clark J, Ireland A, et al. The Gene Ontology (GO) database and informatics resource. Nucleic Acids Res. 2004;32(Database issue):D258–61. doi: 10.1093/nar/gkh036. [DOI] [PMC free article] [PubMed] [Google Scholar]
- 25.Kanehisa M, Goto S, Kawashima S, Okuno Y, Hattori M. The KEGG resource for deciphering the genome. Nucleic Acids Res. 2004;32(Database issue):D277–80. doi: 10.1093/nar/gkh063. [DOI] [PMC free article] [PubMed] [Google Scholar]
- 26.Subramanian A, Tamayo P, Mootha VK, et al. Gene set enrichment analysis: a knowledge-based approach for interpreting genome-wide expression profiles. Proc Natl Acad Sci U S A. 2005;102(43):15545–50. doi: 10.1073/pnas.0506580102. [DOI] [PMC free article] [PubMed] [Google Scholar]
- 27.Mootha VK, Lepage P, Miller K, et al. Identification of a gene causing human cytochrome c oxidase deficiency by integrative genomics. Proc Natl Acad Sci U S A. 2003;100(2):605–10. doi: 10.1073/pnas.242716699. [DOI] [PMC free article] [PubMed] [Google Scholar]
- 28.Irizarry RA, Warren D, Spencer F, et al. Multiple-laboratory comparison of microarray platforms. Nature methods. 2005;2(5):345–50. doi: 10.1038/nmeth756. [DOI] [PubMed] [Google Scholar]
- 29.Olejniczak ET, Van Sant C, Anderson MG, et al. Integrative genomic analysis of small-cell lung carcinoma reveals correlates of sensitivity to bcl-2 antagonists and uncovers novel chromosomal gains. Mol Cancer Res. 2007;5(4):331–9. doi: 10.1158/1541-7786.MCR-06-0367. [DOI] [PubMed] [Google Scholar]
- 30.Su LJ, Chang CW, Wu YC, et al. Selection of DDX5 as a novel internal control for Q-RT-PCR from microarray data using a block bootstrap re-sampling scheme. BMC genomics. 2007;8:140. doi: 10.1186/1471-2164-8-140. [DOI] [PMC free article] [PubMed] [Google Scholar]
- 31.Ge X, Yamamoto S, Tsutsumi S, et al. Interpreting expression profiles of cancers by genome-wide survey of breadth of expression in normal tissues. Genomics. 2005;86(2):127–41. doi: 10.1016/j.ygeno.2005.04.008. [DOI] [PubMed] [Google Scholar]
- 32.Bhattacharjee A, Richards WG, Staunton J, et al. Classification of human lung carcinomas by mRNA expression profiling reveals distinct adenocarcinoma subclasses. Proc Natl Acad Sci U S A. 2001;98(24):13790–5. doi: 10.1073/pnas.191502998. [DOI] [PMC free article] [PubMed] [Google Scholar]
- 33.Johnson JI, Decker S, Zaharevitz D, et al. Relationships between drug activity in NCI preclinical in vitro and in vivo models and early clinical trials. Br J Cancer. 2001;84(10):1424–31. doi: 10.1054/bjoc.2001.1796. [DOI] [PMC free article] [PubMed] [Google Scholar]
- 34.Voskoglou-Nomikos T, Pater JL, Seymour L. Clinical predictive value of the in vitro cell line, human xenograft, and mouse allograft preclinical cancer models. Clin Cancer Res. 2003;9(11):4227–39. [PubMed] [Google Scholar]
- 35.Kerbel RS. Human tumor xenografts as predictive preclinical models for anticancer drug activity in humans: better than commonly perceived-but they can be improved. Cancer biology & therapy. 2003;2(4 Suppl 1):S134–9. [PubMed] [Google Scholar]
- 36.Morton CL, Houghton PJ. Establishment of human tumor xenografts in immunodeficient mice. Nature protocols. 2007;2(2):247–50. doi: 10.1038/nprot.2007.25. [DOI] [PubMed] [Google Scholar]
- 37.Lefrancois D, Olschwang S, Delattre O, et al. Preservation of chromosome and DNA characteristics of human colorectal adenocarcinomas after passage in nude mice. Int J Cancer. 1989;44(5):871–8. doi: 10.1002/ijc.2910440521. [DOI] [PubMed] [Google Scholar]
- 38.Lee CH, Xue H, Sutcliffe M, et al. Establishment of subrenal capsule xenografts of primary human ovarian tumors in SCID mice: potential models. Gynecologic oncology. 2005;96(1):48–55. doi: 10.1016/j.ygyno.2004.09.025. [DOI] [PubMed] [Google Scholar]
- 39.Burg-Kurland CL, Purnell DM, Combs JW, Valerio MG, Harris CC, Trump BF. Immunocytochemical evaluation of primary human esophageal carcinomas and their xenografts for keratin, beta-chorionic gonadotropin, placental lactogen, alpha-fetoprotein, carcinoembryonic antigen, and nonspecific cross-reacting antigen. Cancer Res. 1986;46(11):5730–7. [PubMed] [Google Scholar]
- 40.Alpaugh ML, Tomlinson JS, Shao ZM, Barsky SH. A novel human xenograft model of inflammatory breast cancer. Cancer Res. 1999;59(20):5079–84. [PubMed] [Google Scholar]
- 41.Gray DR, Huss WJ, Yau JM, et al. Short-term human prostate primary xenografts: an in vivo model of human prostate cancer vasculature and angiogenesis. Cancer Res. 2004;64(5):1712–21. doi: 10.1158/0008-5472.can-03-2700. [DOI] [PubMed] [Google Scholar]
- 42.Rubio-Viqueira B, Jimeno A, Cusatis G, et al. An in vivo platform for translational drug development in pancreatic cancer. Clin Cancer Res. 2006;12(15):4652–61. doi: 10.1158/1078-0432.CCR-06-0113. [DOI] [PubMed] [Google Scholar]
- 43.Li C, Heidt DG, Dalerba P, et al. Identification of pancreatic cancer stem cells. Cancer Res. 2007;67(3):1030–7. doi: 10.1158/0008-5472.CAN-06-2030. [DOI] [PubMed] [Google Scholar]
- 44.Dalerba P, Dylla SJ, Park IK, et al. Phenotypic characterization of human colorectal cancer stem cells. Proc Natl Acad Sci U S A. 2007 doi: 10.1073/pnas.0703478104. [DOI] [PMC free article] [PubMed] [Google Scholar]
- 45.Beniers AJ, Peelen WP, Schaafsma HE, et al. Establishment and characterization of five new human renal tumor xenografts. Am J Pathol. 1992;140(2):483–95. [PMC free article] [PubMed] [Google Scholar]
- 46.Beniers AJ, van Moorselaar RJ, Peelen WP, Debruyne FM, Schalken JA. Differential sensitivity of renal cell carcinoma xenografts towards therapy with interferon-alpha, interferon-gamma, tumor necrosis factor and their combinations. Urological research. 1991;19(2):91–8. doi: 10.1007/BF00368183. [DOI] [PubMed] [Google Scholar]
- 47.Dangles-Marie V, Pocard M, Richon S, et al. Establishment of human colon cancer cell lines from fresh tumors versus xenografts: comparison of success rate and cell line features. Cancer Res. 2007;67(1):398–407. doi: 10.1158/0008-5472.CAN-06-0594. [DOI] [PubMed] [Google Scholar]
Associated Data
This section collects any data citations, data availability statements, or supplementary materials included in this article.