

Abstract
The LGI1 gene suppresses invasion in glioma cells and predisposes to epilepsy. In a gene expression array comparison between parental cells and T98G cell clones forced to express LGI1, we demonstrate that the canonical axon guidance pathway is the most significantly affected. In particular, aspects of axon guidance that involve reorganization of the actin cytoskeleton, which is also involved in cell movement and invasion, were affected. Analysis of actin fiber organization using fluorescence microscopy demonstrated that different T98G cell clones expressing the exogenous LGI1 gene show high levels of stress fibers compared with controls. Since stress fiber formation is associated with loss of cell mobility, we used scratch wound assays to demonstrate that LGI1-expressing clones show a significant reduction in cell mobility. LGI1 re-expression also resulted in loss of the PDGFRA and EGFR proteins, suggesting a rapid turnover of these receptors despite increased mRNA levels for PDGFRA. LGI1 suppression of invasion is associated with loss of ERK activation. LGI1 is a secreted protein and when the culture supernatant from cells expressing FLAG- and GFP-tagged proteins were applied to parental T98G cells, ERK phosphorylation and cell mobility was suppressed demonstrating that the LGI1 protein acts as a suppressive agent for cell movement in this assay. These observations support a previous suggestion that LGI1 can reduce cellular invasion in in vitro assays and as a secreted agent, may be developed as a means of treating metastatic cancer. In addition, this observation provides a mechanistic link for LGI1’s common role in metastasis and epilepsy development.
Introduction
The LGI1 gene was originally isolated through its association with a chromosome translocation breakpoint in a glioma cell line [1] and has since been shown to have a regulatory function in the suppression of cell migration and invasion of the cells through down regulation of the MEK/ERK pathway (2, 3]. Absence of LGI1 expression was related to tumor progression [1] and reexpression of LGI1 in null cells resulted in almost complete suppression of invasion in vitro and loss of the ability to grow under anchorage independent conditions [2]. In neuroblastoma cells, reexpression of LGI1 results in apoptosis [4]. By linkage studies, LGI1 was associated with an epilepsy phenotype [5] in families showing a rare form of autosomal dominant partial epilepsy with auditory features (ADPEAF). Genetic analysis of affected individuals in these hereditary cases demonstrated mutations in LGI1 [6] and these observations have been extended in subsequent studies [7, 8].
The question that arises from these different observations is how can the same gene that predisposes to a neuronal-related abnormality as a result of haploinsufficiency in humans, also suppress the invasion phenotype in glioma cells. Since neuronal cells and glia are derived from a common precursor neuroepithelial stem cell, and even though these are end-stage differentiated cells that have very distinct functions, it is possible that both cell types have adapted similar genetic pathways to execute some common cellular functions.
Since LGI1 appears to function in different, but related ways in different cell types, there have been conflicting interpretations about the relative role of LGI1 in different cell contexts. The role of LGI1 in brain development awaits the development of a knock out mouse, since its function in post mitotic cells is hard to establish in vitro. In contrast, the demonstration that reexpression of LGI1 in glioma cells null for endogenous activity has a profound effect on the invasion phenotype of these cells [2], provides an opportunity to investigate the consequences of reexpressing this gene on the cellular gene expression profile. LGI1 is a secreted protein [9,10] which has recently been shown to bind on the surface of neuronal cells and affect sodium channel functioning [11]. LGI1 is found in a protein complex with the ADAM22/23 cell adhesion/receptor protein [12], which when mutated, results in seizures. Since the secreted LGI1 protein may have signaling capabilities in glial cells that derive from the docking of this protein with partners at the cell membrane, we undertook a gene expression profile analysis in a carefully controlled cell system to compare cells that express LGI1 with those that do not. Pathways analysis identified a canonical pathway involving axon guidance, as it relates to actin cytoskeleton reorganization, that is significantly affected by LGI1 expression. These observations provide an important link between the involvement of these pathways in glial cell types in the context of cancer metastasis. Since actin cytoskeleton reorganization is also involved in cell movement, we further demonstrate that glioma cells expressing exogenous LGI1 show increased stress fiber formation and marked reduction in cell mobility. The same phenotypes can be induced in glioma cells by addition of the secreted LGI1 protein.
Materials and Methods
Molecular Analyses
RNA was prepared from cell lines grown in DMEM, supplemented with 10% fetal bovine serum as described previously [13] and used to generate cRNA probes for hybridization to the Affymetrix U133Plus2 human gene expression arrays using standard procedures [14]. RT-PCR analysis was performed using 2 μg of cDNA from both vector control and LGI1 expressing cells and semi-quantitative PCR was performed following the generation of cDNA from cell line-derived RNA as described previously [15]. Normal human astrocytes were obtained from Cambrex – Clonetics (New Brunswick, NJ) and maintained in the custom formulated medium provided by the manufacturer.
Quality control of the raw .CEL intensity files was assessed using the QC statistics associated with the ‘simpleaffy’ and ‘affyPLM’ R packages which include MA-plots of quantile normalized signal, RNA degradation plots, probe level model (PLM) residuals, relative Log Expression (RLE), and normalized unscaled standard error (NUSE) and median absolute deviation (MAD). In addition, spatial biases were explored using the SmudgeMiner library. All of the arrays passed these quality measures and principle components analysis (PCA) demonstrated no significant variation due to technical aspects of the analysis.
Normalization, background subtraction and summarization of probe intensities was processed using an adaptation of Robust Multi-Chip Average (RMA) [16], with specific correction for G-C biases known as GC-RMA [17]. The quantile-normalized PM values were then log transformed and all the probes in a set representing specific genes were summarized using Tukey’s median polishing procedure.
After performing extensive pre-processing using R statistical software, additional filtering steps were undertaken using the MAS5 ‘absent’, ‘present’ and ‘marginal’ detection calls. Within a group of samples that pass quality control criteria, probe sets which show ‘absent’ for all samples were filtered out to avoid excessive false discoveries. The filtered data set was then imported into statistical packages from Partek Genomics for visualization. PCA, which is useful in reducing the dimensions of microarray data, was used to examine whether clusters could be explained by the first few principle components, which is ordered by the eigen values of the covariance matrix. Since dimensionality reduction using PCA has been shown to degrade cluster quality in certain instances [18], unsupervised hierarchal clustering using the Pearson correlation coefficient as a distance metric is performed as a comparison to the clustering structure provided by PCA. Since concordance of the clustering structure was observed between the two dimensionality-reduction procedures, n-way ANOVA analysis was performed comparing the various clusters. Generally, a group difference of 2 fold between the clusters and a p-value of 0.05 based on the t-statistic after adjustment for multiplicity by way of the Bonferroni (FWER) or Benjamanini-Hochberg (FDR) correction was considered significant.
To define how the individual regulated genes interact as parts of complexes, pathways and biological networks we used the Ingenuity Pathway Analysis software which computes a score for each network according to the fit of the network, using a cut-off score of 1.3 to identify gene networks significantly affected by reexpression of LGI1. This score indicates that there is a 5% chance that the genes are in a network due to random chance alone.
Wound Healing assay
The wound-healing assay is a simple, inexpensive method to study directional cell migration in vitro. In brief, cells were cultured in six well plates to confluency. Cultures were then washed once with PBS and a linear scratch was created in the cell monolayer with a pipette tip. After marking the position of the ‘wound’, the cells were again washed twice with PBS and fresh culture medium was added. Using an inverted microscope (4x magnification) each wound was photographed at time = 0 and then again 24 hours later. The relative efficiency of wound closure was calculated using the ImageJ software and then plotted using the Graphpad prism software. The wound closure was defined as the ratio of the extent of the remaining wounded area relative to that of the initial area. To study the effect of secreted LGI1 on wound closure supernatant from LGI1 secreting cells was collected and concentrated using Amicon Millipore columns and then added to the T98G cells immediately after the scratch wound was made. After 24 hr, these cell monolyers were again photographed and the extent of wound closure was measured and compared to control cells treated in the same way. Experiments were repeated at least three times in 6 replicates.
Immunofluorescence Microscopy
Cells (105cells/well) were grown in DMEM containing 10% fetal bovine serum (FBS) on glass coverslips (22 × 22 mm) for 24 hours. Cells were then fixed with 2% paraformaldehyde-PBS. Actin filaments (F-actin) were stained with a 1: 500 anti-phalloidin-Texas Red antibody in PBS (Molecular Probes, Eugene, OR). Fluorescent images were captured using a Nikon TE2000-E inverted microscope (Garden City, NY).
Western Blot analysis
Cells were lysed in RIPA buffer containing protease and phosphatase inhibitors. 40 μg of the protein lysates were size fractionated on polyacrylamide gels and western blot analysis was performed using total anti-PDGFR alpha and beta, and anti-EGFR antibodies (Santa Cruz) at 1:1000 dilution. Protein detection was performed using 1:5000 anti-Rabbit HRP secondary antibodies (Amersham) and developed using ECL chemiluminscence reagent from NEN.
RESULTS
Western blot assays demonstrated that all of the T98G clones carrying LGI1 showed down regulation of ERK phosphorylation (activation) compared with the vector-only clones which showed constitutional expression of activated ERK [3]. The profound effect seen previously on cell invasion and growth in soft agar [2] was re-confirmed in these clones expressing LGI1. In the gene expression array analysis we compared individually derived clones expressing LGI1 or containing the empty pcDNA3 vector or LGI1 using Affymetrix U133 Plus2 arrays, which contains >22,000 genes. Three independently derived clones from each group were used in the comparison.
Processing of Gene expression data
Quality control of the raw .CEL intensity files prior to preprocessing was assessed using the ‘affyQCReport’ library in the R statistical programming environment, which incorporates various additional quality control measures above the standard Affymetrix QC metrics. This analysis revealed no significant quality control issues associated with any of the hybridization reactions in this experiment (data not shown).
After standard data preprocessing (see materials and methods), filtering was performed, and principal components analysis (PCA) demonstrated that the only factor that was significantly associated with the largest separation of the biological data, was the presence of LGI1 expression. Using 1-way ANOVA, incorporating Benjamini-Hochberg multiplicity correction, 1461 high quality probesets (FDR DEGs) demonstrated at least a 2 fold differential expression with an FDR of 0.05 in a comparison between three independently isolated LGI1 expressing T98G clones and three parental T98G cell clones expressing the empty vector. The definition of differential expression in this analysis followed very strict criteria where, only if the change in gene expression levels was observed in all three clones, in both the test and control samples, was the gene included in the final analysis. Gene expression data were analyzed as described in the materials and methods, identifying 738 of the 57,000 probe sets with a greater than 2-fold increase in expression levels and 724 probe sets showing a greater than 2-fold decrease in expression levels. Because of the redundancy on the U133plus2 arrays, this corresponds to 525 genes with >2-fold decreases and 560 with >2-fold increases of the ~22,000 discrete genes on the array. The full details of these gene changes and selected examples, including those relevant to the following discussion, are shown in Table 1. Expression levels were defined relative to those seen in normal cultures of primary astrocytes, which we felt was the closest available cell type of origin for glial cells. In the final analysis, however, the comparison was essentially between T98G parental cells and T98G cells expressing exogenous LGI1, which allowed us to assess the influence of LGI1 on overall cellular gene expression levels.
Table 1.
Summary of the fold changes of the down regulated and up regulated genes of a representative sample of those showing the highest fold changes. Genes germane to the discussion in this report are highlighted in bold.
| Probe ID | Gene | FC (decrease) | Probe ID | Gene | FC (increase) |
|---|---|---|---|---|---|
| 203324_s_at | CAV2 | −388.941009 | 205767_at | EREG | 148.6190033 |
| 202016_at | MEST | −348.2319946 | 1552971_at | SGCZ | 100.3779984 |
| 204620_s_at | CSPG2 | −124.1279984 | 210432_s_at | SCN3A | 83.24169922 |
| 225275_at | EDIL3 | −71.36370087 | 203131_at | PDGFRA | 75.53769684 |
| 219837_s_at | CYTL1 | −61.41600037 | 212865_s_at | COL14A1 | 74.65879822 |
| 213416_at | ITGA4 | −60.1966019 | 204818_at | HSD17B2 | 67.50180054 |
| 212977_at | CXCR7 | −59.62039948 | 1566968_at | SPRY4 | 61.99990082 |
| 213194_at | ROBO1 | −50.9077988 | 202546_at | VAMP8 | 61.45629883 |
| 203184_at | FBN2 | −49.20669937 | 221911_at | ETV1 | 49.39530182 |
| 210511_s_at | INHBA | −43.93939972 | 227276_at | PLXDC2 | 31.3939991 |
| 215646_s_at | CSPG2 | −41.77500153 | 227059_at | GPC6 | 31.04870033 |
| 243366_s_at | CERKL | −30.16259956 | 202668_at | EFNB2 | 27.7052002 |
| 236044_at | PPAPDC1A | −30.13509941 | 206295_at | IL18 | 24.93589973 |
| 236824_at | TMEM132B | −24.02289963 | 230645_at | FRMD3 | 24.36370087 |
| 229947_at | PI15 | −23.96629906 | 202291_s_at | MGP | 21.44120026 |
| 227261_at | KLF12 | −22.36009979 | 210517_s_at | AKAP12 | 21.32439995 |
| 204105_s_at | NRCAM | −22.13750076 | 219230_at | TMEM100 | 19.09819984 |
| 201631_s_at | IER3 | −19.18370056 | 225207_at | PDK4 | 19.03770065 |
| 212942_s_at | KIAA1199 | −18.66180038 | 1554997_a_at | PTGS2 | 18.06200027 |
| 204364_s_at | REEP1 | −18.09609985 | 1552511_a_at | CPA6 | 17.88500023 |
| 206155_at | ABCC2 | −17.21590042 | 213049_at | GARNL1 | 17.51539993 |
| 226677_at | ZNF521 | −17.16799927 | 219014_at | PLAC8 | 17.46640015 |
| 218723_s_at | RGC32 | −16.99559975 | 205650_s_at | FGA | 15.91399956 |
| 205828_at | MMP3 | −15.7476997 | 219033_at | PARP8 | 15.0394001 |
| 209875_s_at | SPP1 | −15.6086998 | 227399_at | VGLL3 | 14.07759953 |
| 209031_at | IGSF4 | −15.57870007 | 209955_s_at | FAP | 13.73390007 |
| 211571_s_at | CSPG2 | −15.36250019 | 218451_at | CDCP1 | 13.25669956 |
| 227197_at | SGEF | −13.90799999 | 203151_at | MAP1A | 13.2112999 |
| 204042_at | WAVE3 | −13.5626001 | 201042_at | TGM2 | 12.84910011 |
| 219310_at | C20orf39 | −12.8920002 | 220794_at | GREM2 | 12.27639961 |
| 223340_at | SPG3A | −12.44659996 | 220615_s_at | MLSTD1 | 11.30560017 |
| 235874_at | PRSS35 | −12.2407999 | 211990_at | HLADPA1 | 11.09770012 |
| 218694_at | ARMCX1 | −12.13899994 | 219478_at | WFDC1 | 10.97350025 |
| 225342_at | AK3L1 | −11.80860043 | 202409_at | IGF2 | 10.84459972 |
| 213170_at | GPX7 | −11.55970001 | 228575_at | IL20RB | 10.70629978 |
| 227224_at | RALGPS2 | −6.732211 | 239907_at | KIAA1026 | 10.64669991 |
| 203666_s_at | CXCL12 | −4.897001 | 205870_at | BDKRB2 | 10.43519974 |
| 205405_at | SEMA5A | −3.26049 | 201739_at | SGK | 10.07999992 |
| 206805_at | SEMA3A | −2.114749908 | 223618_at | FMN2 | 10.03419971 |
From the series of genes identified in the expression array analysis we selected representatives for verification using semi-quantitative RT-PCR analysis (figure 1), primarily to demonstrate that the expression changes seen on the array were not due to unforeseen artifacts. The upregulated genes that were selected were; GPC6, PDGFRA, SCN3A and VAMP8. Down regulated genes selected were; CAV2, ITGA4, RALGPS2, ROBO1 and WAVE3. In all cases, the array-generated suggestion of up- or down-regulation was confirmed in this analysis (figure 1).
Figure 1.

Semi quantitative (25 cycle) analysis of expression levels for genes identified using the U133Plus2 array analysis as upregulated or downregulated (see text). Lanes 1–3 represent individual clones from T98G carrying the empty pcDNA3 vector, and lanes 4–6 represent different individual clones expressing the exogenous LGI1 gene.
The FDR DEGs were then submitted to the Ingenuity Pathways Analysis (IPA) workflow to potentially identify pathways and interaction networks that are overrepresented in the FDR DEG group with high statistical confidence and which therefore provide a better understanding of the consequences of the experimental manipulation. This software describes functional relationships between gene products based on published interactions that have been manually curated. Using IPA, the FDR DEGs (Figure 2) demonstrated that the Axonal Guidance Signaling pathway was statistically the most overrepresented pathway, with a p-value of <0.00001, where approximately 10% of the genes in the curated Axonal Guidance Signaling pathway were shown to be differentially expressed. Several other well characterized pathways were also shown to be overrepresented including, IGF-1, NF-κB and the ERK/MAPK signaling pathways but did not show statistical significance (data not shown).
Figure 2.

Summary analysis of the axon guidance pathway identified using Ingenuity Pathways Analysis showing up regulated genes (red) and down regulated genes (green) in a comparison between T98G cells which do and do not express LGI1.
The canonical axon guidance pathway shares one essential feature with cancer cell movement and invasion in that they both require reorganization of the actin cytoskeleton. We have previously demonstrated that reexpression of LGI1 in glioma cells suppresses invasion through a basement membrane structure in vitro [2] through down regulation of MMPs. To determine whether the loss of movement is related to formation of actin stress fibers, a common phenotype associated with loss of movement, we compared phalloidin staining in parental T98G cells with those forced to re-express LGI1. As shown in figure 3 the LGI1-expressing cells clearly show significantly increased levels of stress fibers. To determine whether this phenotype is related to loss of cell movement, we subjected T98G cells to scratch wound assays. Over a 24 hour period, parental T98G cells almost completely closed the gap created in the cell monolayer (figure 4). This response could not be accounted for by cell proliferation, since T98G cells have a cycle time of ~20 hours [2]. T98G cells expressing an exogenous LGI1 gene, on the other hand, were relatively unable (<40%) to significantly close the wound in this assay (figure 4) demonstrating a suppression of cell motility.
Figure 3.

Fluorescence microscopic analysis of parental T98G cells and cells expressing an exogenous LGI1 gene (TF1) shows increased stress fiber formation in the LGI1-expressing cells (A–C). Analysis of the EGF receptor (D) shows typical membrane localization (red) in the parental T98G cells but almost complete loss of protein in the LGI1-expressing cells.
Figure 4.

Scratch wound assays for parental T98G cells (above) and LGI1-expressing cells (TF1-below). In both cases the images on the left were obtained immediately after the wound was created and the images on the right were obtained 24 hours later. Quantitation (lower graph) of the degree of wound closure (see Materials and Methods) demonstrates that while the parental (T98G) cells can almost completely close the wound, the LGI1-expressing cells (TF1) show a reduced capacity. When supernatants from parental T98G cells were applied to fresh T98G cells, using a 500-fold (S20P) or 1000-fold (S10P) concentration, the parental T98G cells show no significant difference in their ability to close the wound after 24 hours. In contrast, when the supernatants from T98G cells expressing the LGI1-flag protein were added to fresh cultures of T98G cells, also with 500-fold (S20F) and 1000-fold (S10F) concentrations, wound closure was largely inhibited.
LGI1 is a secreted protein [9,10,19]. To further delineate whether the LGI1 protein is responsible for the observed loss of motility, we harvested the supernatant from the T98G clones expressing exogenous FLAG-tagged LGI1 which was secreted into the medium. This supernatant was then concentrated and applied to T98G cell monolayers in which a scratch wound had been created. Over a 24 hour period, although parental cells again close the wound when incubated in normal medium, the cells treated with LGI1-containing supernatant were unable to significantly close the wound (Figure 4). Supernatants from T98G parental cells were similarly collected and applied to fresh cultures and showed no effect on closure of the wound. These results demonstrate that the effect on the movement phenotype is due to the secreted LGI1 protein, since supernatants from parental T98G cells when applied to the same cells in parallel did not have the same effect. In addition, we have generated 293 cells that constitutively express, and secrete, a GFP-tagged LGI1 protein [10]. Application of supernatants from these cells also suppressed wound closure, although supernatant from 293 parental cells did not, demonstrating that the specific tags do not affect the function of this protein in this respect (data not shown). To relate this loss of wound closure to ERK activity, we analyzed phospho-ERK levels in the T98G cells which were previously shown to be reduced below detectable levels by western blotting in T98G-LGI1 cells [3]. As shown in figure 5, ERK1/2 activity in the cells treated with the LGI1-containing supernatants essentially show undetectable levels of ERK phosphorylation.
Figure 5.
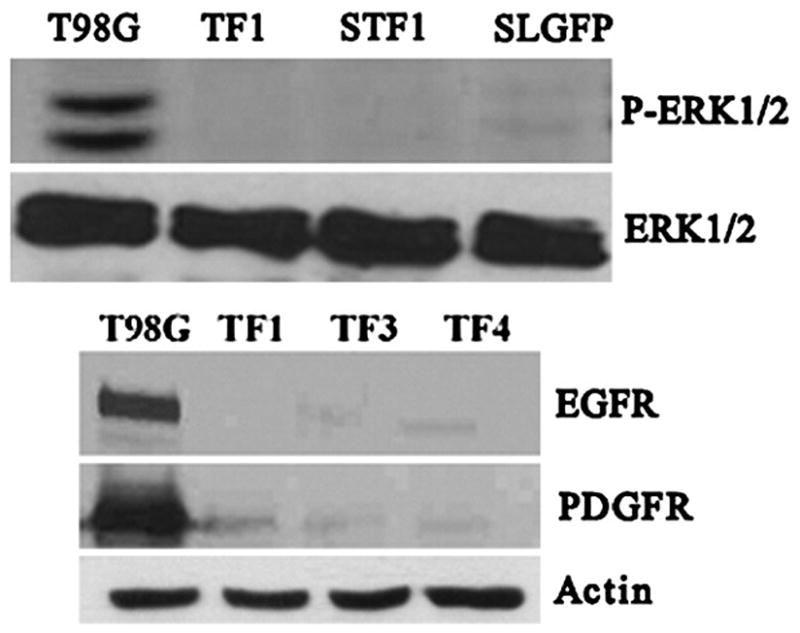
Western blot analysis of phospho-ERK protein levels (above) demonstrate absence of the activated proteins in cells expressing exogenous LGI1 (TF1) compared with the parental T98G cells. When supernatants from either LGI1-flag expressing cells (STF1) of GFP-LGI1 expressing cells (SLGFP), are added to parental T98G cells, phospho-ERK protein levels are similarly reduced. Analysis of EGFR and PDGFRA protein levels in three clones (TF1, TF3 and TF4) of T98G cells expressing the LGI1-Flag protein show almost undetectable levels of the receptor proteins compared with the parental T98G cells.
LGI1 expression reduces growth factor receptor protein levels
The platelet derived growth factor receptor alpha (PDGFRA) gene was one of the most highly upregulated genes seen in this gene expression analysis (Table 1). This observation was confirmed using RT-PCR (figure 1). Western blot analysis for PDGFRA using protein lysates from T98G parental and LGI1 expressing cells, however, demonstrated that levels of the receptor protein were reduced to below detectable levels. To determine whether a similar effect was seen for the epidermal growth factor receptor (EGFR), which was also shown to be over expressed in T98G parental cells (figure 5) and related to ERK inactivation, we used confocal microscopy to study the effects of stably expressing LGI1-FLAG in these cells. As shown in figure 3, the typical EGFR membrane localization seen in the parental cells was lost in the LGI1 expressing cells. Western blot analysis further demonstrated that, as with PDGFRA, protein levels were below the limits of detection in LGI1-expressing T98G cells (figure 5).
DISCUSSION
One of the conundrums presently surrounding the function of LGI1 derives from the observations that its haploinsufficiency in humans leads to a predisposition to epilepsy [6] and its forced re-expression in glioma cells inhibits cell migration and invasion [2]. We have shown in this study that many genes that are known to be associated with pathways that have been implicated in the process of axon guidance, and which lead to axon outgrowth, repulsion, attraction and neurite retraction, as well as cone collapse in a neuronal cell context, primarily through actin reorganization, are also dysregulated in glioma cells forced to express LGI1. Thus, it appears that the same pathways are affected, although the phenotypic consequences are different depending on the cell context. This observation may not be surprising since glia and neurons are derived from the same neuroepithelial stem cell. In fact, the process of axon guidance and neuronal migration has been shown to be associated with many of the same genes that are implicated in glioma cell invasion and metastasis. The matrix metalloproteinases, such as MMP3 for example, were shown to be inactivated in the presence of LGI1 [3], which was presumed to be related to the loss of invasion in these cells compared to the parental glioma cells that did not express LGI1. MMPs also perform essential functions during neuroplasticity in both the developing and adult nervous systems, including guidance and establishment of axonal terminal fields [20] and inhibition of MMP activity prevents aspects of the deafferentation/sprouting cycle. MMP3, in particular, has been implicated in cortical axon outgrowth and optimal axon extension [21]. This process is related to semaphorin 3C-dependent chemo attraction of cortical axons which is inhibitory to the process. In the gene expression studies presented here, semaphorin 3A and 5A were down regulated in the presence of LGI1 expression (Table 1). High levels of expression of SEMA5A have been associated with aggressiveness in cancer cells [22], and supports the idea that its down regulation in the presence of LGI1 may be related to the loss of invasiveness in these cells. The connection between axon outgrowth and metastasis was also demonstrated for the Syntenin gene in melanoma [23]. Syntenin interacts with Unc51.1, a serine/thronine kinase that promotes neurite extension in neurons [23]. Overexpression of Syntenin in melanoma cells prevented migration, invasion and anchorage independent growth [24] in a similar way that LGI1 suppressed these phenotypes in glioma cells [3].
Another strong link between forced overexpression of LGI1 in glioma cells and the axon guidance pathway is seen in the down regulation of ROBO1, the receptor for the SLIT protein which drives axon guidance. Although these two proteins are distinct, the leucine rich domain in the SLIT and LGI1 proteins is highly homologous [1], potentially suggesting a related function for these proteins. ROBO1 is an axon guidance receptor that regulates midline crossing [25] and affects neuronal precursor migration. Recently ROBO1 has been suggested to participate in glioma cell guidance within the brain [26] and possibly facilitates metastasis of breast cancer cells to the brain, through the action of chemo attractants in the CXCR/CXCL chemokine receptor/ligand family [27]. CXCR7 and CXCL12 were down regulated in cells expressing LGI1 (Table 1).
WAVE3, also known as WASF3 has also been implicated in invasion and metastasis [28,29]. High levels of this protein were seen in advanced stage breast cancer and knockdown using siRNA resulted in loss of in vitro invasion and metastasis in vivo, which correlated with reduced lamellipodia formation [30,31]. Up regulation of WAVE3 is positively correlated with increased cell movement and invasion, through actin cytoskeleton reorganization. In this series of experiments, expression of LGI1 resulted in down regulation of WAVE3 which is consistent with the suppression of movement in these cells. Recently, it was demonstrated that ROBO1 is essential for filopodia formation in endothelial and down regulation in these cells suppresses cell migration [32]. These observations are consistent with a role for LGI1 in suppressing cell movement in glioma cells through down regulation of ROBO1.
Our detailed analysis of gene expression changes in glioma cells, that show inhibition of invasion as a result of over expression of LGI1, demonstrates major reorganization of the expression of genes involved in neuronal migration and axon guidance, and many of these genes have also been implicated in cancer cell metastasis and invasion. These observations support the idea that LGI1, in different cell contexts, can profoundly influence both processes [33]. It should be noted that the LGI1-related mechanisms that predispose to epilepsy are only just beginning to be understood. Recent studies have demonstrated an association with an ADAM22/23-containing complex [11]. These members of a membrane associated family of metalloproteinases are involved in signaling through glutamate receptors and cell adhesion molecules at synapse points. Interestingly, the RALGPS2 gene which was down regulated in LGI1 expressing cells was shown to interact with the 14-3-3-zeta protein [34] which facilitates surface expression of ADAM22 [35]. CAV2, which showed the highest level of down regulation is also tied to receptor function through its involvement with lipid raft function and internalization [36]. In addition, the presence of LGI1 in a complex with the Kv1.1 (SCNA1) voltage-gated potassium channel, and the demonstration that LGI1 can inhibit channel inactivation by cytoplasmic Kvβ1 [12], points to a role in neuronal function. Whether LGI1 has a role in development of the brain cytoarchitecture, as might be expected from a function that controls axon positioning, has not yet been specifically determined. Since loss of LGI1 in glioma cells promotes movement and invasion, without significantly affecting cell proliferation, it is possible that LGI1 is related specifically to the metastasis process by regulating cell signaling pathways that are responsible for influencing actin cytoskeleton reorganization as supported by the data presented here. As a secreted protein, therefore, LGI1 has the potential to be developed as a therapeutic agent that could control tumor cell invasion.
Addition of exogenous LGI1 protein to the parental T98G cells resulted in down regulation of the ERK-MAPK pathway and an inhibition of wound closure (cell motility) compared to the parental T98G cells. This phenotypic change suggested that a cell surface receptor might be involved in mediating the LGI1 effect. The gene expression studies demonstrated that PDGFRA transcription was upregulated (possibly as a result of increased expression of GLI1 seen on the expression array, which is known to drive PDGFRA expression) but cells expressing LGI1, showed drastically reduced levels of the receptor protein. The same consequence was seen for the EGF receptor in T98G cells expressing LGI1, suggesting that it may influence protein stability for these two receptors. Interestingly, another human LRR protein, LR1G1, was shown to bind with, and inhibit, the ERB2 member of the EGFR family of receptor kinases by increasing internalization and turnover rate of the receptor [37]. In these studies, lack of the receptor proteins was demonstrated using western blotting after introduction of exogenous LRIG1. In addition, decorin, a secreted proteoglycan which also carries an LRR motif, was shown to interact with EGFR in Drosophila and was associated with a prolonged down regulation of the receptor, which resulted in inhibition of cellular growth by increasing p21 [38]. Thus, there are now several examples where LRR-containing proteins are associated with cell surface receptor stability which results in reduced levels of these proteins and so may provide a mechanism of downregulating the ERK pathway, and as a consequence MMP3 production, which has shown to be an important mediator of cell movement and metastasis [39,40].
Many genes known to be involved in axon guidance or other specific neuronal functions are also expressed in glial cells as we have shown here. Some of these genes appear to be disregulated by forced reexpression of LGI1 which accompanies loss of cellular invasion and migration phenotypes. The analysis reported here, therefore, makes the connection between genetic pathways that control normal neuronal migration and glioma cell invasion. The exact role of LGI1 in neuronal cell development and function awaits the development of the mutant null mouse for LGI1.
Acknowledgments
Funding – This work was supported by The National Institutes of Health (grant number NS046706)
Footnotes
Conflict of Interest Statement – The authors have no conflict of interests.
References
- 1.Chernova OB, Somerville RPT, Cowell JK. A novel geneLGI1from 10q24 is rearranged and downregulated in malignant brain tumors. Oncogene. 1998;17:2873–2881. doi: 10.1038/sj.onc.1202481. [DOI] [PubMed] [Google Scholar]
- 2.Kunapuli P, Chitta KS, Cowell JK. Suppression of the cell proliferation and invasion phenotypes in glioma cells by the LGI1 gene. Oncogene. 2003;22:3985–3991. doi: 10.1038/sj.onc.1206584. [DOI] [PubMed] [Google Scholar]
- 3.Kunapuli P, Chitta KS, Hawthorn L, Cowell JK. LGI1a putative tumor metastasis suppressor genecontrols in vitro invasiveness and expression of matrix metalloproteinases in glioma cells through the Erk1/2 pathway. J Biol Chem. 2004;279:23151–23157. doi: 10.1074/jbc.M314192200. [DOI] [PubMed] [Google Scholar]
- 4.Gabellini N, Masola V, Quartesan SO, Selladore B, Nobile C, Michelucci R, Curtarello M, Parolin C, Palù G. Increased expression of LGI1 gene triggers growth inhibition and apoptosis of neuroblastoma cells. J Cell Physiol. 2006;207:711–721. doi: 10.1002/jcp.20627. [DOI] [PubMed] [Google Scholar]
- 5.Ottman R, Risch N, Hauser WA, Pedley TA, Lee JH, Barker-Cummings C, Lustenberger A, Nagle KJ, Lee KS, Scheuer ML, et al. Localization of a gene for partial epilepsy to chromosome 10q. Nat Genet. 1995;10:56–60. doi: 10.1038/ng0595-56. [DOI] [PMC free article] [PubMed] [Google Scholar]
- 6.Kalachikov S, Evgrafov O, Ross B, Winawer M, Barker-Cummings C, Martinelli Boneschi F, Choi C, Morozov P, Das K, Teplitskaya E, et al. Mutations in LGI1 cause autosomal-dominant partial epilepsy with auditory features. Nat Genet. 2002;30:335–341. doi: 10.1038/ng832. [DOI] [PMC free article] [PubMed] [Google Scholar]
- 7.Gu W, Brodtkorb E, Steinlein OK. LGI1 is mutated in familial temporal lobe epilepsy characterized by aphasic seizures. Ann Neurol. 2002;52:364–367. doi: 10.1002/ana.10280. [DOI] [PubMed] [Google Scholar]
- 8.Ottman R, Winawer MR, Kalachikov S, Barker-Cummings C, Gilliam TC, Pedley TA, Hauser WA. LGI1 mutations in autosomal dominant partial epilepsy with auditory features. Neurology. 2004;62:1120–1126. doi: 10.1212/01.wnl.0000120098.39231.6e. [DOI] [PMC free article] [PubMed] [Google Scholar]
- 9.Senechal KR, Thaller C, Noebels JL. ADPEAF mutations reduce levels of secreted LGI1a putative tumor suppressor protein linked to epilepsy. Hum Mol Genet. 2005;14:1613–1620. doi: 10.1093/hmg/ddi169. [DOI] [PubMed] [Google Scholar]
- 10.Head K, Gong S, Joseph S, Wang C, Burkhardt T, Rossi MR, LaDuca J, Matsui S-I, Vaughan M, Hicks DG, et al. The expression pattern of the LGI1 gene in tissues and organs from BAC transgenic mice demonstrate a neuronal and glial expression pattern as well as other distinct cell types in the adult animal. Mamm Genome. 2007;18:328–337. doi: 10.1007/s00335-007-9024-6. [DOI] [PubMed] [Google Scholar]
- 11.Fukata Y, Adesnik H, Iwanaga T, Bredt DS, Nicoll RA, Fukata M. Epilepsy-related ligand/receptor complex LGI1 and ADAM22 regulate synaptic transmission. Science. 2006;313:1792–1795. doi: 10.1126/science.1129947. [DOI] [PubMed] [Google Scholar]
- 12.Schulte U, Thumfart JO, Klöcker N, Sailer CA, Bildl W, Biniossek M, Dehn D, Deller T, Eble S, Abbass K, et al. The epilepsy-linked Lgi1 protein assembles into presynaptic Kv1 channels and inhibits inactivation by Kvbeta1. Neuron. 2006;49:697–706. doi: 10.1016/j.neuron.2006.01.033. [DOI] [PubMed] [Google Scholar]
- 13.Hawthorn L, Stein L, Panzarella J, Loewen GM, Baumann H. Characterization of cell-type specific profiles in tissues and isolated cells from squamous cell carcinomas of the lung. Lung Cancer. 2006;53:129–142. doi: 10.1016/j.lungcan.2006.04.015. [DOI] [PubMed] [Google Scholar]
- 14.Lo KC, Rossi MR, LaDuca J, Hicks DG, Turpaz Y, Hawthorn L, Cowell JK. Candidate glioblastoma development gene identification using concordance between copy number abnormalities and gene expression level changes. Genes Chroms Cancer. 2007;46:875–894. doi: 10.1002/gcc.20474. [DOI] [PubMed] [Google Scholar]
- 15.Rossi MR, LaDuca J, Matsui S-I, Nowak NJ, Hawthorn L, Cowell JK. Novel amplicons on the short arm of chromosome 7 identified using high resolution array CGH contain over expressed genes in addition to EGFR in glioblastoma multiforme. Genes Chroms Cancer. 2005;44:392–404. doi: 10.1002/gcc.20256. [DOI] [PubMed] [Google Scholar]
- 16.Irizarry RA, Hobbs B, Collin F, Beazer-Barclay YD, Antonellis KJ, Scherf U, Speed TP. Exploration normalization and summaries of high density oligonucleotide array probe level data. Biostatistics. 2003;4:249–264. doi: 10.1093/biostatistics/4.2.249. [DOI] [PubMed] [Google Scholar]
- 17.Wu Z, Irizarry RA, Gentleman R, Martinez Murillo F, Spencer F. A model based background adjustment for oligonucleotide expression arrays. J Am Stat Assoc. 2004;99:909–917. [Google Scholar]
- 18.Yeung KY, Ruzzo WL. Principle component analysis for clustering gene expression data. Bioinformatics. 2001;17:977–987. doi: 10.1093/bioinformatics/17.9.763. [DOI] [PubMed] [Google Scholar]
- 19.Sirerol-Piquer MS, Ayerdi-Izquierdo A, Morante-Redolat JM, Herranz-Pérez V, Favell K, Barker PA, Pérez-Tur J. The epilepsy gene LGI1 encodes a secreted glycoprotein that binds to the cell surface. Hum Mol Genet. 2006;15:3436–3445. doi: 10.1093/hmg/ddl421. [DOI] [PubMed] [Google Scholar]
- 20.Reeves TM, Prins ML, Zhu J, Povlishock JT, Phillips LL. Matrix metalloproteinase inhibition alters functional and structural correlates of deafferentation-induced sprouting in the dentate gyrus. J Neurosci. 2003;23:10182–10189. doi: 10.1523/JNEUROSCI.23-32-10182.2003. [DOI] [PMC free article] [PubMed] [Google Scholar]
- 21.Gonthier B, Nasarre C, Roth L, Perraut M, Thomasset N, Roussel G, Aunis D, Bagnard D. Functional interaction between matrix metalloproteinase-3 and semaphorin-3C during cortical axonal growth and guidance. Cereb Cortex. 2007;17:1712–1721. doi: 10.1093/cercor/bhl082. [DOI] [PubMed] [Google Scholar]
- 22.Sarkar D, Boukerche H, Su ZZ, Fisher PB. mda-9/Syntenin: more than just a simple adapter protein when it comes to cancer metastasis. Cancer Res. 2008;68:3087–3093. doi: 10.1158/0008-5472.CAN-07-6210. [DOI] [PubMed] [Google Scholar]
- 23.Tomoda T, Kim JH, Zhan C, Hatten ME. Role of Unc51.1 and its binding partners in CNS axon outgrowth. Genes Dev. 2004;18:541–558. doi: 10.1101/gad.1151204. [DOI] [PMC free article] [PubMed] [Google Scholar]
- 24.Boukerche H, Su ZZ, Emdad L, Baril P, Balme B, Thomas L, Randolph A, Valerie K, Sarkar D, Fisher PB. mda-9/Syntenin: a positive regulator of melanoma metastasis. Cancer Res. 2005;65:10901–10911. doi: 10.1158/0008-5472.CAN-05-1614. [DOI] [PubMed] [Google Scholar]
- 25.Kidd T, Brose K, Mitchell KJ, Fetter RD, Tessier-Lavigne M, Goodman CS, Tear G. Roundabout controls axon crossing of the CNS midline and defines a novel subfamily of evolutionarily conserved guidance receptors. Cell. 1998;92:205–215. doi: 10.1016/s0092-8674(00)80915-0. [DOI] [PubMed] [Google Scholar]
- 26.Mertsch S, Schmitz N, Jeibmann A, Geng JG, Paulus W, Senner V. Slit2 involvement in glioma cell migration is mediated by Robo1 receptor. J Neurooncol. 2008;8:71–77. doi: 10.1007/s11060-007-9484-2. [DOI] [PubMed] [Google Scholar]
- 27.Schmid BC, Rezniczek GA, Fabjani G, Yoneda T, Leodolter S, Zeillinger R. The neuronal guidance cue Slit2 induces targeted migration and may play a role in brain metastasis of breast cancer cells. Breast Cancer Res Treat. 2007;106:333–342. doi: 10.1007/s10549-007-9504-0. [DOI] [PubMed] [Google Scholar]
- 28.Sossey-Alaoui K, Ranalli TA, Li X, Cowell JK. WAVE3 promotes cell motility and invasion through the regulation of MMP-1MMP-3 and MMP-9- expression. Exp Cell Res. 2005;308:135–145. doi: 10.1016/j.yexcr.2005.04.011. [DOI] [PubMed] [Google Scholar]
- 29.Sossey-Alaoui K, Safina A, Li X, Vaughan MM, Hicks DG, Bakin AV, Cowell JK. Down-regulation of WAVE3a metastasis promoter geneinhibits invasion and metastasis of breast cancer cells. Am J Pathol. 2007;170:2112–2121. doi: 10.2353/ajpath.2007.060975. [DOI] [PMC free article] [PubMed] [Google Scholar]
- 30.Sossey-Alaoui K, Li X, Ranalli TA, Cowell JK. WAVE-3 mediated cell migration and lamellipodia formation are regulated downstream of P13-kinase. J Biol Chem. 2005;280:21748–21755. doi: 10.1074/jbc.M500503200. [DOI] [PubMed] [Google Scholar]
- 31.Sossey-Alaoui K, Li X, Cowell JK. c-ABL-mediated phosphorylation of WAVE3 is required for lamellipodia formation and cell migration. J Biol Chem. 2007;282:26257–26265. doi: 10.1074/jbc.M701484200. [DOI] [PubMed] [Google Scholar]
- 32.Sheldon H, Andre M, Legg JA, Heal P, Herbert JM, Sainson R, Sharma AS, Kitajewski JK, Heath VL, Bicknell R. Active involvement of Robo1 and Robo4 in filopodia formation and endothelial cell motility mediated via WASP and other actin nucleation-promoting factors. FASEB J. 2008 Oct 23; doi: 10.1096/fj.07-098269. [Epub ahead of print] [DOI] [PMC free article] [PubMed] [Google Scholar]
- 33.Cowell JK. Epilepsy research gets new guidance. Nat Med. 2002;8:219–220. doi: 10.1038/nm0302-219. [DOI] [PubMed] [Google Scholar]
- 34.Gödde NJ, D’Abaco GM, Paradiso L, Novak U. Efficient ADAM22 surface expression is mediated by phosphorylation-dependent interaction with 14-3-3 protein family members. J Cell Sci. 2006;119:3296–3230. doi: 10.1242/jcs.03065. [DOI] [PubMed] [Google Scholar]
- 35.Shmuel M, Nodel-Berner E, Hyman T, Rouvinski A, Altschuler Y. Caveolin 2 regulates endocytosis and trafficking of the M1 muscarinic receptor in MDCK epithelial cells. Mol Biol Cell. 2007;18:1570–1578. doi: 10.1091/mbc.E06-07-0618. [DOI] [PMC free article] [PubMed] [Google Scholar]
- 36.Ewing RM, Chu P, Elisma F, Li H, Taylor P, Climie S, McBroom-Cerajewski L, Robinson MD, O’Connor L, Li M, Taylor R, Dharsee M, Ho Y, Heilbut A, Moore L, Zhang S, Ornatsky O, Bukhman YV, Ethier M, Sheng Y, Vasilescu J, Abu-Farha M, Lambert JP, Duewel HS, Stewart II, Kuehl B, Hogue K, Colwill K, Gladwish K, Muskat B, Kinach R, Adams SL, Moran MF, Morin GB, Topaloglou T, Figeys D. Large-scale mapping of human protein-protein interactions by mass spectrometry. Mol Syst Biol. 2007;3:89. doi: 10.1038/msb4100134. [DOI] [PMC free article] [PubMed] [Google Scholar]
- 37.Laederich MB, Funes-Duran M, Yen L, Ingalla E, Wu X, Carraway KL, Sweeney C. The leucine-rich repeat protein LRIG1 is a negative regulator of ErbB family receptor tyrosine kinases. J Bio Chem. 2004;279:47050–47056. doi: 10.1074/jbc.M409703200. [DOI] [PubMed] [Google Scholar]
- 38.De Luca A, Santra M, Baldi A, Giordano A, Iozzo RV. Decorin-induced growth suppression is associated with up-regulation of p21an inhibitor of cyclin-dependent kinases. J Biol Chem. 1996;271:18961–18965. doi: 10.1074/jbc.271.31.18961. [DOI] [PubMed] [Google Scholar]
- 39.Viala E, Pouyssegur J. Regulation of tumor cell motility by ERK mitoen-activated protein kinases. Ann NY Acad Sci. 2004;1030:208–218. doi: 10.1196/annals.1329.027. [DOI] [PubMed] [Google Scholar]
- 40.Reddy KB, Nabha SM, Atanaskova N. Role pf MAP kinase on tumor progression and invasion. Cancer Metast Rev. 2003;22:395–403. doi: 10.1023/a:1023781114568. [DOI] [PubMed] [Google Scholar]