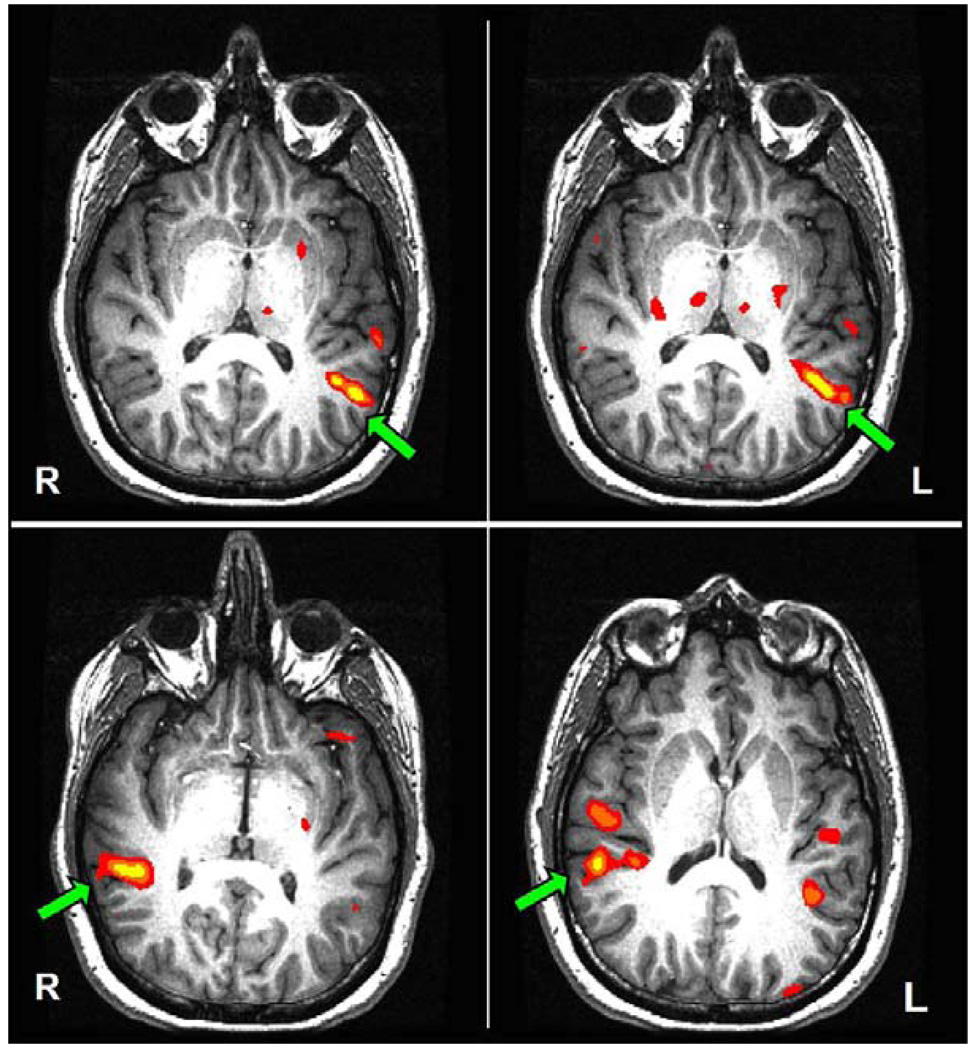
Figure 3.
Functional MRI activation maps of subject 8 (threshold at p < 10−4, uncorrected). Top left panel: antonym-generation. Top right panel: noun-categorization. Lower left panel: singing vs. rest. Lower right panel: piano music vs. pure tones. Green arrows outline the dominant activation in the posterior portion of the superior temporal gyrus (pSTG) for the various contrasts.

