Abstract
Objective
To propose a model-free method to show linear and nonlinear information flow based on time delayed mutual information (TDMI) by employing uni- and bi-variate surrogate tests and to investigate whether there are contributions of the nonlinear information flow in corticomuscular (CM) interaction.
Methods
Using simulated data, we tested whether our method would successfully detect the direction of information flow and identify a relationship between two simulated time series. As an experimental data application, we applied this method to investigate CM interaction during a right wrist extension task.
Results
Results of simulation tests show that we can correctly detect the direction of information flow and the relationship between two time series without a prior knowledge of the dynamics of their generating systems. As experimental results, we found both linear and nonlinear information flow from contralateral sensorimotor cortex to muscle.
Conclusions
Our method is a viable model-free measure of temporally varying causal interactions that is capable of distinguishing linear and nonlinear information flow. With respect to experimental application, there are both linear and nonlinear information flows in CM interaction from contralateral sensorimotor cortex to muscle, which may reflect the motor command from brain to muscle.
Significance
This is the first study to show separate linear and nonlinear information flow in CM interaction.
Keywords: Linear and nonlinear information flow, Time delayed mutual information, Surrogate tests, Corticomuscular interaction, Model-free connectivity measure
1. Introduction
Multi-variate time series analyses have been extensively used to investigate the relationship between simultaneously recorded neurophysiological signals, and to assess the interdependence between signals, giving insights into the function of the systems that produce them rather than features of a single signal itself (Pereda et al., 2005). Cross-correlation or coherence functions provide information on the linear correlation between two signals as a function of time or frequency. Cross-correlation was the most popular method to investigate the similarity and the time delay between two electroencephalogram (EEG) signals before the coherence method was introduced in the early 1960s (Shaw and Ongley, 1972). Coherence has been highly successful as a methodology for assessing functional coupling, information interaction, and temporal coordination between cortical regions in normal subjects (Gerloff et al., 1998; Leocani et al., 1997; Nagamine et al., 1996) and clinical populations (Holschneider et al., 1999; Thatcher, 1994a, b). The coherence method has also been adopted to characterize synchronization between oscillatory cortical motor and muscle activity confined to the beta frequency range (Kristeva et al., 2007; Mima et al., 2000). Although these methods give useful information in the study of interdependence between two signals, they have the intrinsic limitation that they cannot give the direction of information flow. Furthermore, they are linear methods, which mean that they mainly measure linear connectivity, although neural connectivity may be nonlinear. Thus linear methods are insufficient for the study of complex neurophysiological data (Lopes da Silva, 1991; Popivanov and Dushanova, 1999).
Nonlinear multivariate techniques mainly result from recent advances in information theory (Kraskov et el., 2004; Schreiber, 2000). Their aim is to address whether there is any common information between two time series, and this might be established by means of information-theoretic tools (Pereda et al., 2005). The main advantage of these measures is that they may capture both linear and nonlinear relationships between time series. Mutual information (MI) is useful to study the relationship between a stimulus and response in the literature of information theory (Borst and Theunissen, 1999; London et al., 2002). Since Xu et al. (1997) suggested that it is reasonable to study information transmission among the various parts of the human cerebral cortex by information theory, several researchers have employed MI based methods in their studies (Chen et al., 2000; Kraskov, 2004; Kreuz, 2004). Kraskov (2004) suggested that MI may be used as a good measure for seizure prediction as well as to localize the epileptic focus, and Chen et al. (2000) reported that the information content of the EEG decreased markedly prior to a seizure. Moreover, since MI is not an amplitude dependent measure, it may be more robust for estimation of the changes in brain electrical activity than a linear method of spectral power analysis which depends on amplitude, and it is suited to measure changes in synchronization of different neuronal electrical activities (Frasch et al., 2007; Stam, 2005).
In order to designate the direction of information flow, time delayed mutual information (TDMI) has been introduced and used to detect whether there are differences between control groups and groups of patients with various neurological disorders (Jeong et al., 2001; Na et al., 2002). Previous studies have examined the function or information transmission between brain areas during object and emotional recognition tasks (Ioannides, 2001, Ioannides et al., 2000), odor stimulation in subjects classified by occupation (Min et al., 2003), and the scientific hypothesis generation process in gifted or normal children (Jin et al., 2006a, b). Hinrichs et al. (2006, 2008) used directed information flow (DIF) as a model free approach of information flow to measure causal interactions in event related fMRI, EEG, and MEG experiments. They used a measure of information theoretic causality proposed by Saito and Harashima (1981), and this measure has a very similar theoretic background with TDMI. Although these previous studies have shown the direction of information flow, they do not give any information on whether the connectivity comes from a linear or nonlinear dependence because this measure includes both dependences simultaneously and does not play with surrogates.
In this study, we propose a potential model-free method based on TDMI with uni- and bi-variate surrogate testing to identify the relationship between two time series and determine whether their connectivity comes from linear or nonlinear dependence while maintaining the advantage of being able to detect the direction of information flow. To verify the validity of our method we apply it to simulated and experimental data as well. As a simulation test, three datasets generated from different dynamic systems were used to test whether our method would successfully detect the direction of information flow and identify their nature of dependence without a prior knowledge of the dynamics of their generating systems. As an experimental data application, we investigate CM interaction during a weak tonic contraction in order to investigate whether or not nonlinear information flow is involved in CM interaction.
2. Materials and Methods
2.1. Simulated data
As simulation tests, we used three different models, independent, linear and nontrivial models. Using these three models, we checked whether our method would successfully detect the direction of information flow and identify the relationship between two time series without prior knowledge of the dynamics of their generating systems.
Two independent time series X and Y were generated by the following processes, as a first model to test (Peguin-Feissolle and Terasvirta, 1999).
| (1) |
Secondly, as a linear model, we generated two time series by using the following formula (Diks and DeGoede, 2001). We can expect strong linear information flow from Y to X.
| (2) |
The last two time series as a nontrivial model were generated by the following model (Peguin-Feissolle and Terasvirta, 1999). In this model, mainly nonlinear information flows from Y to X, as Chavez et al. (2003) presented.
| (3) |
For all models, ut and vt represent two independent white noise processes with unit variance.
2.2. Experimental data
Seven right-handed healthy volunteers (2 females; Age: 29.6 ± 5.5 years) participated in the study. The protocol was approved by the Institutional Review Board and all volunteers gave written informed consent for the experiment.
The task was a weak tonic extension (20–30% of maximal strength) of their right wrist. Subjects performed repeated periods of maintained wrist extension for 10 seconds in response to auditory cues presented at random intervals, and they were instructed to keep their eyes fixed on a cross 3m in front of them during whole recording in order not to give them any visual feedback.
EEG signals were recorded from 29 surface electrodes mounted on a cap (Electro-Cap International, Inc., Eaton, OH, USA) using the international 10–20 system referenced to the right ear. Bipolar recordings of the vertical and horizontal electrooculogram (EOG) and surface electromyogram (sEMG) from extensor digitorum communis were simultaneously obtained. Signals from all channels were amplified (Neuroscan Inc., El Paso, TX, USA), filtered (DC-100Hz) and digitized with sampling frequency 1 kHz.
After sEMG onset was marked manually, epoching was done with a window of 1 sec after the onset of movement to 10 sec. We discarded the first 1 sec data from the onset of EMG, since the EMG firing pattern is different from the sustained tonic contraction. Linear trend was removed from the entire epoch and eye movement related artifacts were corrected using an auto-regressive exogenous input (ARX) model, in which the vertical and horizontal EOG signals were used as the exogenous inputs (Cerutti et al., 1988). All the sEMG data were rectified before subsequent calculation to enhance the motor neuron firing rate (Myers et al., 2003; Yao et al., 2007). Finally, 10 artifact-free epochs in each subject were obtained to calculate TDMI values. These preprocessing steps were performed by using the same home-made MATLAB (MathWorks, Natick, MA) scripts as used in Bai et al. (2005).
2.3. Time delayed mutual information (TDMI)
A central concept of information theory is entropy derived from Shannon and Weaver (1949) which characterizes the amount of information stored in a more general probability distribution. The observation of a system is regarded as a source of information, a stream of numbers which can be considered as a transmitted message (Kantz and Schreiber, 2004). MI is a measure of the amount of shared information gained about one system from the observation of another one. Let us consider time series X (t) and Y (t) (t = 1,…,T) at T discrete points. Each time series can be thought of as a random variable with underlying probability density function (PDF), p (X (t),n) ≡ p(X (t)) with n=1,…,bin, the index of sampling bins for the construction of approximated PDF. In this study, 16 bins were adopted for 4,000 samples. In order to quantify the degree of dependence one may compute MI as follows:
| (4) |
Where, p (X (t),Y (t)) is the joint PDF between X (t) and Y (t).
The mutual information function is strictly non-negative and has a maximum value when the two time series are completely identical. If one system is completely independent of the other, MI is zero because it is assumed that 0·log(0)=0. We took logarithm with base 2, so maximum MI in our study is 4 bits.
MI does not indicate the direction of information flow, because it is a symmetric measure. However, we can obtain asymmetric MI, called time-delayed mutual information (TDMI) by adding a time delay in one of the variables using the following equations (Kwapien et al., 1998; Jeong et al., 2001; Jin et al., 2006a, b; Min et al., 2003; Na et al., 2002; Nichols et al., 2006)
| (5) |
TDMI, which represents the mutual information as a function of time delay is used as a measure for mutual coupling or for information transmission between two time series. This measure may be thought of as a nonlinear cross-correlation function capable of capturing both linear and nonlinear correlations in time series (Nichols et al., 2006).
In real calculation of entropy and MI, we added a corrective term to compensate the effect of finite data and quantization on the PDF, since the calculated entropy and MI have a functional dependence on the amount of data and the quantization chosen (Roulston, 1999).
| (6) |
where BX and BY are the number of bins for which p (X) >0 and p (Y) >0, BXY is the number of bins for which p (X,Y) >0, and N is the size of the time series. MItrue is the corrected MI, which is accepted as a final MI value.
In order to evaluate the linearized version of TDMI (LTDMI), assume the two processes are Gaussian distributed function with zero-mean, and variance , i.e., . Then LTDMI between X and Y can be rewritten as
| (7) |
where ρ X (t)Y (t + τ) and ρY (t) X (t + τ) are a cross-correlation coefficient. These equations are referred to as the linearized information flow between the two processes X and Y and consider only second moments in the data (Nichols et al., 2006), whereas general TDMI eq. (5) considers higher statistics including second moments. This is an intrinsic difference between TDMI and LTDMI. We should note that it is meaningless to numerically compare TDMI value from eq. (5) with LTDMI value from eq. (7), because these values are calculated by two different equations with different assumptions on their distribution. LTDMI is used as an abbreviation for linearized version of TDMI in order to avoid ambiguity in linearized version of TDMI calculated from eq. (7) and linear TDMI obtained from our hypotheses tests (see Surrogate tests section).
Since TDMIXY and TDMIYX are not symmetric, the difference between them, NIXY, can show the net flux of information which may be interpreted as the information flow between them. We used the same definition as Hinrichs et al. (2006; 2008) employed. If NIXY is positive, then the information flows from X to Y, and vice versa. Fig. 1 demonstrates the information flow from X to Y and Y to X, and final net flux of information.
Fig. 1. Diagram showing information flow.
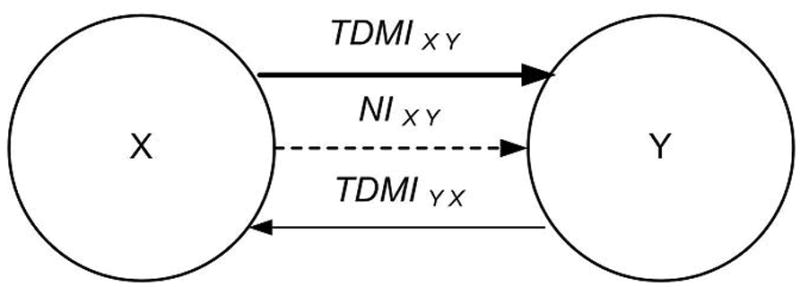
TDMIXY and TDMIYX indicate information flow from X to Y (bold arrow) and vice versa (arrow). If two systems X and Y mutually communicate with each other, there is information flow in each direction. The difference between TDMIXY and TDMIYX shows the net flux of information (NIXY, dotted arrow) which can indicate the direction and amount of information flow between them. In this paper, all information indicates net information flow.
As an experimental application, we calculated TDMI values from the beta power fluctuation time series of EEG and sEMG obtained by wavelet transformation. TDMI values calculated for 100 ms time delay. We chose sufficient time duration as a delay time to show the exchange of information between EEG and sEMG. In addition, X and Y in TDMIXY and TDMIYX correspond to EEG and sEMG, respectively.
Subsequently, we calculated weighted TDMI (wTDMI) and LTDMI (wLTDMI) values by summating all the statistically significant values for delay time at each EEG location to see the overall information flow.
2.4. Surrogate tests
Surrogate data come from manipulation of the original data by constructing additional time series that preserve specific statistical properties of the original data but are random with respect to other properties, presumably for the ones that are tested (Nichols et al., 2006). Among many methods to generate surrogate data, we used the method of Fourier-transformed surrogates (Prichard and Theiler, 1994; Schreiber and Schmitz, 2000; Theiler et al., 1992). First, a Fourier transform of the original data is computed to obtain complex amplitude at each frequency. Then the phase of the complex amplitude is randomized by adding the random phase variable ϕ which is chosen uniformly in the range [0, 2π) for each frequency, i.e., each complex amplitude is multiplied by eiϕ. Finally, the spectrum was transformed back to the time domain.
If one applies the uni-variate surrogate test to two time series, surrogate data keep the same mean, variance, and power spectrum as each time series whereas the coupling can be presumed to be destroyed, since phase randomization was independently applied to each time series. This process corresponds to two independent linear stochastic processes that oscillated with the same frequencies as the original series but asynchronously without any coupling between them (Alonso et al., 2007). On the other hand, bi-variate surrogate test can also be treated very much the same way as uni-variate surrogate test except for the phase randomization process. For bi-variate time series, the phase randomization process is synchronously applied to both signals to preserve all the linear autocorrelations and cross correlations between them (Prichard and Theiler, 1994). Thus, bi-variate surrogate data would preserve linear synchronization whereas uni-variate surrogate data would not. Figure 2 shows surrogate data generated by uni- (Fig. 2a) and bi-variate (Fig. 2b) processes.
Fig. 2.
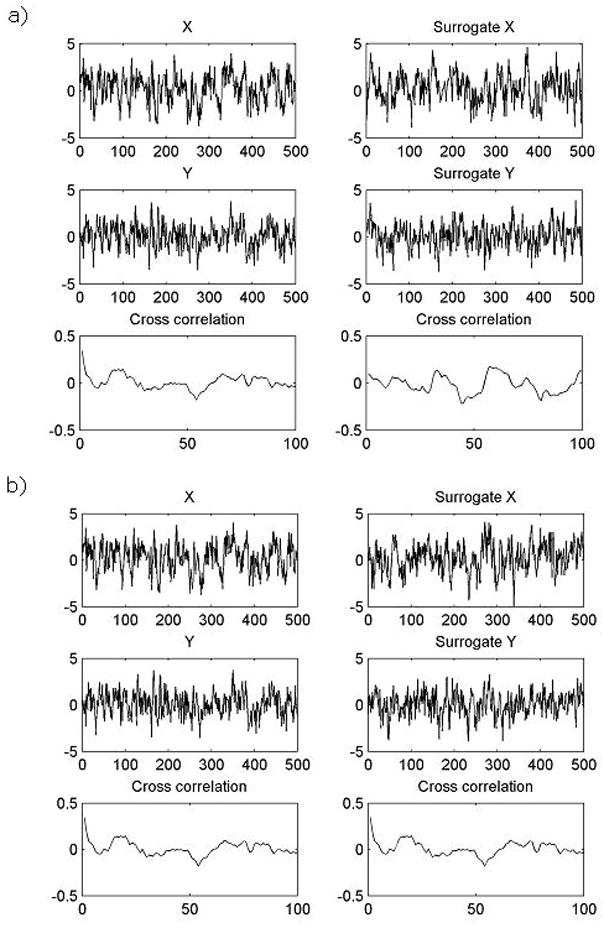
Original data X and Y and its cross correlation function over delay (Left panel) and surrogate data of X and Y and its cross correlation function over delay (Right panel) in uni- (Fig. 2a) and bi-variate surrogate tests (Fig. 2b). When the uni-variate surrogate test has been applied to original data X and Y cross correlation function of original data and surrogate data are different from each other (Fig. 2a.). However, when the bi-variate surrogate test has been applied to original data X and Y, cross correlation function of original data and surrogate data are identical (Fig. 2b.).
Based on the characteristics of uni- and bi-variate surrogate data, two kinds of null hypotheses were tested for.
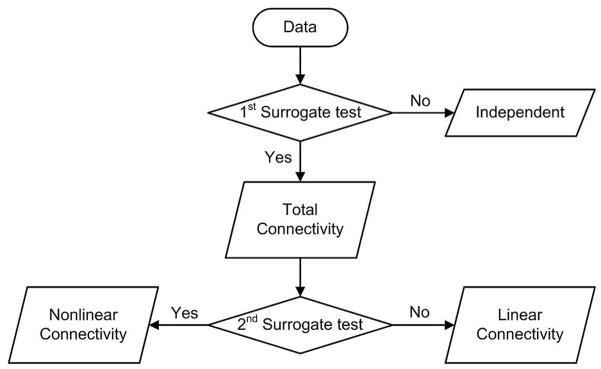
The 1st null hypothesis tested by uni-variate surrogate test is that the original data have no connectivity, that is, they are independent. If the 1st null hypothesis has not been rejected, we can suppose that the two time series are independent. Otherwise, we can suppose that there is connectivity including linear and nonlinear components even though their connectivity characteristics have not been differentiated. Since this connectivity includes both linear and nonlinear dependence, we call it total connectivity. Then, the second surrogate test is applied.
The 2nd null hypothesis is tested in order to assess whether the relationship between the original two time series can be accurately represented by a linear model or not. In other words, we assessed whether the original data has connectivity through uni-variate surrogate test, and if so, whether this connectivity comes from nonlinear dependence or not through bi-variate surrogate test. Thus, if the 2nd null hypothesis has been rejected, we can suppose that the original two time series has nonlinear dependence between them rather than linear one. Otherwise, we can suppose that the total connectivity which has passed the first surrogate test presumably results from their linear dependence, because the total connectivity would be either a linear or nonlinear one. Figure 3 demonstrates the hypotheses testing procedure.
Fig. 3. Hypotheses testing procedure.
1st and 2nd surrogate tests indicate uni- and bi-variate surrogate tests, respectively. If the 1st null hypothesis has not been rejected, we can conclude that the two time series are independent. Otherwise, we can conclude that the total connectivity includes linear and nonlinear connectivity. If the 2nd null hypothesis has been rejected, we can conclude that the original two time series have nonlinear connectivity between them rather than a linear one. Otherwise, we can conclude that the total connectivity which has passed the first surrogate test presumably results from their linear connectivity, because the total connectivity would be either a linear or nonlinear one.
For each surrogate test, the significance S is defined by
| (8) |
〈TDMIsurro〉 and σ (TDMIsurro) denote the mean value of TDMI of the surrogate data and its standard deviation, respectively (Shen et al., 2003). If the value of S was larger than 1.65, the hypothesis was rejected with a 0.95 level of significance. For LTDMI, the uni-variate surrogate test was applied. According to Schreiber and Schmitz (2000), at least 19 surrogate time series are needed to test with a 0.95 level of significance. Thus, we generated 19 surrogate data for each surrogate test.
To verify the validity of the hypotheses testing to identify the relationship between two time series without any prior information on their generating systems, we applied our method to simulated data obtained from independent, linear, and nonlinear models, respectively. All methods described in this paper were implemented by MATLAB.
After calculating TDMI value and testing our hypotheses, we can conclude that there is linear or nonlinear information flow. For example, if NIXY of two time series is positive and their connectivity comes from nonlinear connectivity, we suppose that the nonlinear information flows from X to Y.
2.5. Wavelet spectral estimation
Since beta band interaction has been observed during maintained contraction in EEG studies (Halliday et al., 1998; Kristeva-Feige et al., 2002; Mima et al., 2000), we make the power fluctuation time series using Morlet wavelet transformation. Fourier or wavelet transform based methods have been used to obtain time-frequency representation of a signal, with the wavelet transform particularly useful to analyze time-varying processes (Daubechies, 1990; 1992; Percival and Walden, 2000). Time-frequency representation was constructed from a Morlet wavelet decomposition which provides an optimal concentration in time and frequency (Tallon-Baudry et al., 1997; Qin et al., 2004; Qin and He, 2005). Morlet wavelets w(t, f) are given by:
| (9) |
where, σ f = 1/(2πσt), . The relation f / σf was set to 5.
The wavelet was convolved to the signal xq (t) from the qth epoch at time instant t and every frequency f. Then the square norm of the convolution was the time-varying energy [Exq(t, f)] of the signal at a specific frequency:
| (10) |
Beta (15 to 25Hz) and gamma (30 to 50Hz) power were chosen in the present study, and these beta and gamma power activities were created separately by averaging across epochs (here, 10) within each subject. Before applying Morlet wavelet transformation, EEG was down-sampled to 500Hz. After generating the beta and gamma power fluctuation time series using Morlet wavelet transformation, we calculated TDMI and LTDMI values between EEG and sEMG for a 100 ms delay time with steps of 2 ms.
Fig. 4 shows the whole procedure to be done to EEG and sEMG..
Fig. 4.
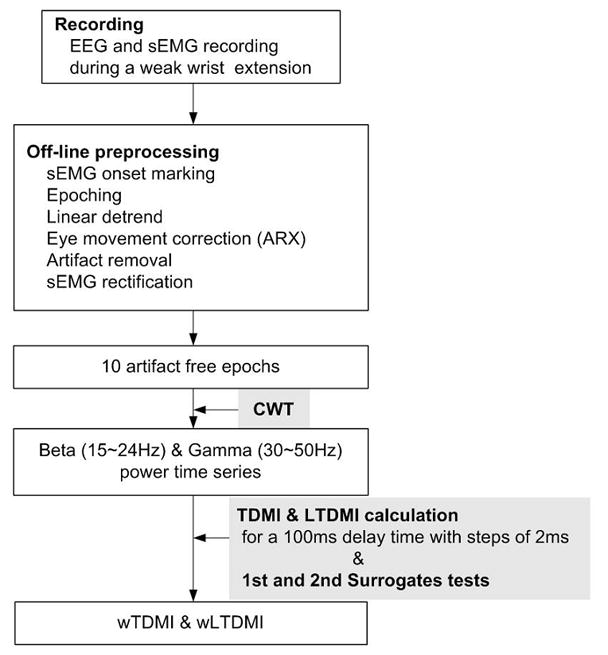
Schematic diagram. After collecting EEG and sEMG data, preprocessing was applied to get 10 artifact free epochs. CWT performed to obtain beta and gamma power time series. And then, TDMI and hypotheses tests were applied.
3. Results
3.1. Application to simulation data
TDMI values are shown in Fig. 5a as a function of time lag. There is no information flow between the two time series, because the two null hypotheses of both surrogate tests have never been rejected at any time lag. From this result we can suppose that these two time series are independent from each other. This result means that TDMI method successfully identify two time series generated from independent model. We can identify the relationship between two independent time series even in LTDMI values (Fig. 5b). Independent time series can be easily identified by not only TDMI but also LTDMI, because these two time series have no connectivity between them at all.
Fig. 5.
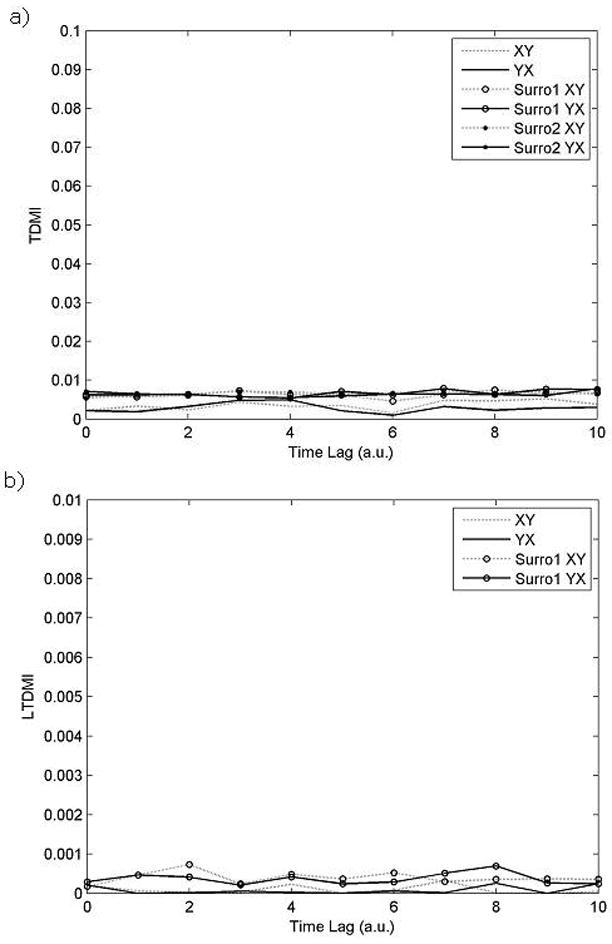
TDMI (Fig. 5a) and LTDMI (Fig. 5b) values as a function of delay from independent model. X-axis indicates time lag with arbitrary unit (a.u.), and y-axis indicates TDMI or LTDMI values. Surro1 and surro 2 correspond to uni- and bi-variate surrogate test, respectively. TDMIsurro1XY (YX) and TDMIsurro2XY (YX) indicate the threshold value of each surrogate test with a 0.95 level of significance. If TDMIXY (TDMIYX) value exceeds the TDMIsurro1XY (TDMIsurro1YX), we conclude that the 1st hypothesis is rejected. If TDMIXY (TDMIYX) value exceeds the TDMIsurro2XY (TDMIsurro2YX), we conclude that the 2nd hypothesis is rejected. No significant information flow has been detected either in TDMI (Fig. 5a) or in LTDMI (Fig. 5b). This imply that these two time series are independent each other.
Fig. 6a indicates TDMI values as a function of time lag from two time series generated from the linear model. As Fig. 6a shows, NIXY is negative; that is, the dominant information flows from Y to X in our linear model as expected. At some time lag, information flow from X to Y can be seen. However, information flow from Y to X is always larger than those from X to Y; thus, the net information flow NIXY is negative, which means that the main information flows from Y to X. In addition, TDMI values from Y to X have passed the first surrogate test but never passed the second surrogate test, which means that there is connectivity between two time series and this property comes from a linear connectivity between them rather than nonlinear one according to our hypotheses tests. Eventually, we can conclude that the linear information flows from Y to X in this example without any prior knowledge of dynamical relationship between these two time series.
Fig. 6.
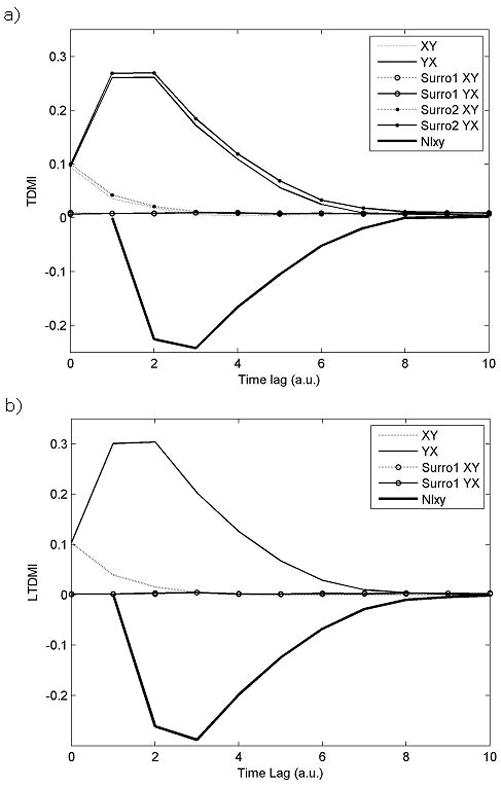
TDMI (Fig. 6a) and LTDMI (Fig. 6b) values as a function of delay from linear model. X-axis indicates time lag with arbitrary unit (a.u.), and y-axis indicates TDMI or LTDMI values. Surro1 and surro 2 correspond to uni- and bi-variate surrogate tests, respectively. NIXY is negative, and TDMI values from Y to X have passed the first surrogate test but never passed the second surrogate test. Thus, we can guess that the linear information flows from Y to X without any prior knowledge of dynamical relationship between these two time series. Although LTDMI can imply that there is linearized information flow from Y to X (Fig. 6b), it does not guarantee that there is no nonlinear information flow at all. However, our method shows that there is no nonlinear information flow. At zero delay, TDMIXY and TDMIYX are identical, because at this point TDMIXY and TDMIYX correspond to MIXY and MIYX.
Fig. 7a indicates TDMI values as a function of time lag from two time series generated from a nonlinear model. Fig. 7a demonstrates that NIXY is negative; that is, the dominant information flows from Y to X in our nonlinear model as expected. In addition, TDMI values from Y to X have passed both of the two surrogate tests, which means that nonlinear connectivity results from information flows from Y to X. Through these results, we conclude that the nonlinear information flows from Y to X in this case.
Fig. 7.
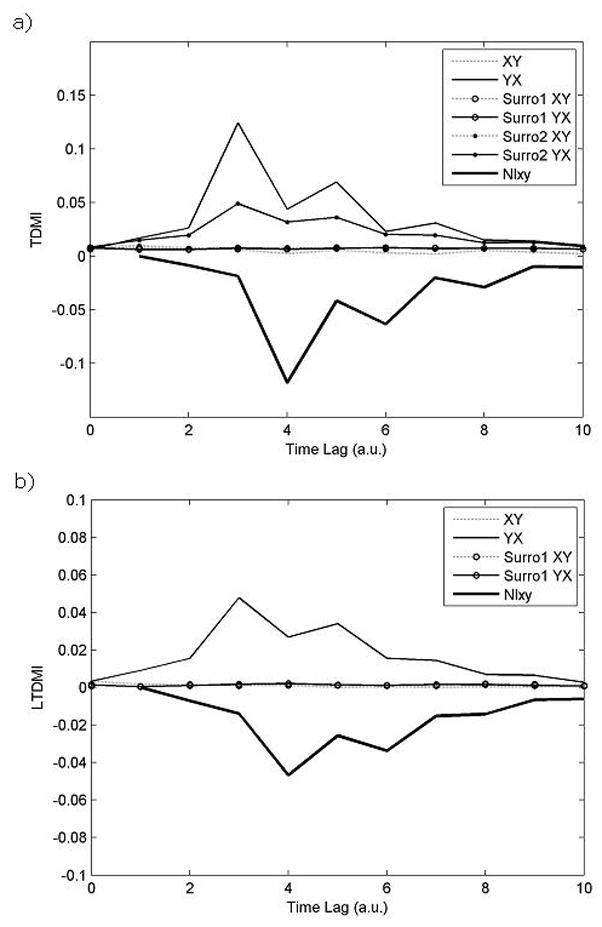
TDMI (Fig. 7a) and LTDMI (Fig. 7b) values as a function of delay from nonlinear model. X-axis indicates delay time with arbitrary unit (a.u.), and y-axis indicates TDMI values. Surro1 and surro 2 correspond to uni- and bi-variate surrogate tests, respectively. NIXY is negative, and TDMI values from Y to X have passed both of the two surrogate tests. Thus, we can guess that the nonlinear information flows from Y to X without any prior knowledge of dynamical relationship between these two time series. Although LTDMI can also imply the dominant information flow between two time series (Fig. 7b), it is not able to capture all information when a nonlinear connectivity is present.
3.2. Application to experimental data
Fig. 8 presents the TDMI curve as a function of delay. It is normalized by the maximum value. Overall, TDMI from EEG (C5) to EMG is larger than TDMI from EMG to EEG.
Fig. 8.
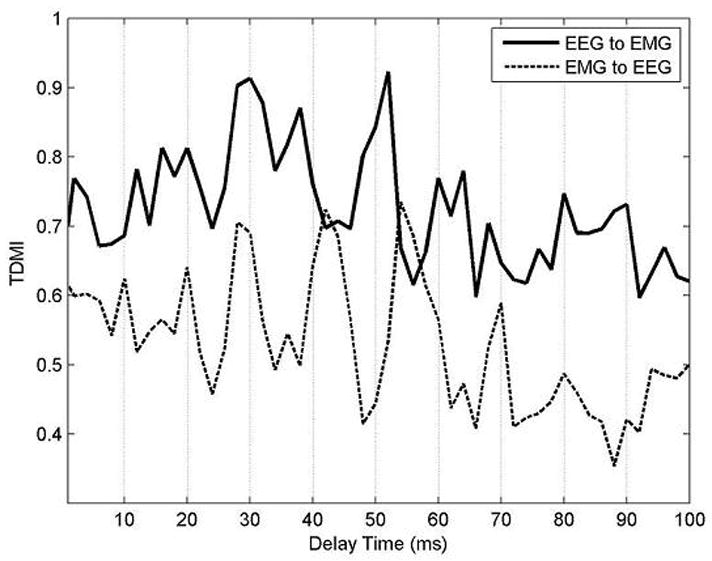
TDMI curve as a function of delay time. X-axis indicates delay time (ms) and y-axis indicates TDMI. It is normalized by the maximum value. Bold line corresponds to TDMI from EEG (here, C5) to sEMG and dotted line corresponds to TDMI from sEMG to EEG.
Fig. 9 shows grand averaged topographic map of wLTDMI. This map shows that all information flows from EEG to sEMG, because NIXY values of all EEG and sEMG couplings are positive. Particularly, the dominant information flows from contralateral sensorimotor area to sEMG in the beta band during right wrist extension task. This result is in line with the result reported by Mima et al. (2001) in terms of linearized information flow.
Fig. 9. Grand averaged topographic map of wLTDMI in beta band.
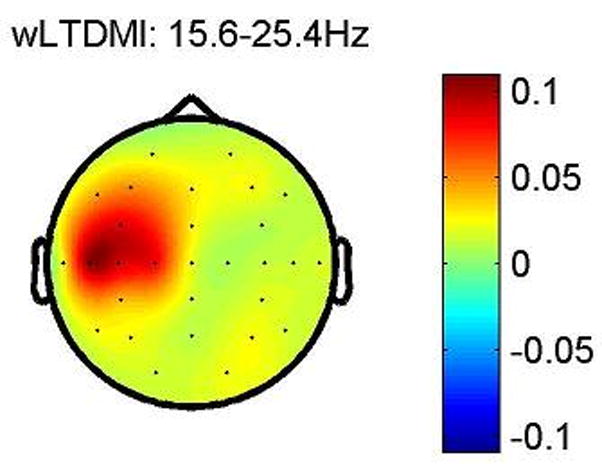
LTDMI values of beta power fluctuation time series of EEG and sEMG were calculated for 100 ms delay time with steps of 2 ms, and then, all the statistically significant LTDMI values were summed up at each EEG location to see the overall information flow. Scale bar indicates wLTDMI value of NIXY (Here, X and Y correspond to EEG and sEMG, respectively). As we can see, all NIXY at each EEG location are positive, which means that all significant information flows from EEG to sEMG. And dominant information flows from contralateral sensorimotor area to sEMG in beta band during right wrist extension task.
Grand averaged topographic maps of total, nonlinear and linear wTDMI are shown in Fig. 10. We can detect dominant information flow from mainly contralateral sensorimotor areas to sEMG in total wTDMI map. In addition, the information flow from some areas other than contralateral sensorimotor areas are resolved as well (Fig. 10a). However, almost all of these information flows included the nonlinear wTDMI map (Fig. 10b) except the strong linear information flow from contralateral sensorimotor areas to sEMG (Fig. 10c). These results suggest that there are linear and nonlinear information flows as well from contralateral sensorimotor cortex to muscle, whereas mainly nonlinear information flows from the rest of brain regions to muscle.
Fig. 10. Grand averaged topographic map of total (Fig. 10a), nonlinear (Fig. 10b), and linear wTDMI (Fig. 10c) in beta band.
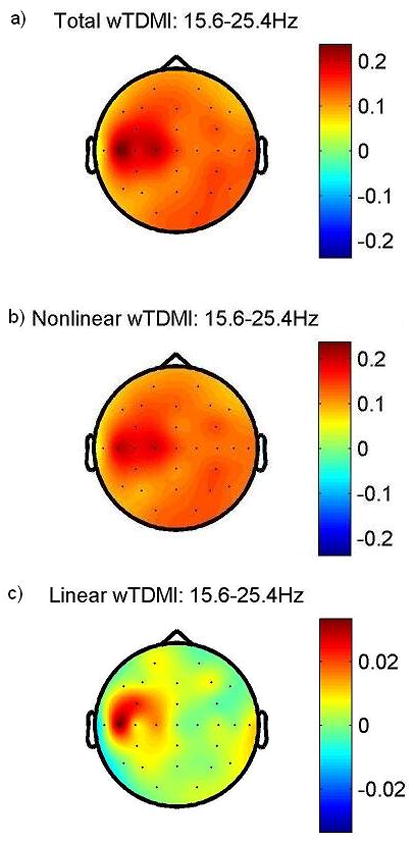
TDMI values of beta power fluctuation time series of EEG and sEMG were calculated for 100 ms delay time with steps of 2 ms, and then, all the statistically significant TDMI values were summed up at each EEG locations to see the whole feature of information flow. Scale bar indicates wTDMI value of NIXY (Here, X and Y correspond to EEG and sEMG, respectively). All NIXY are positive in total, nonlinear and linear wTDMI maps, which mean that all significant information flows from EEG to sEMG. And dominant information flows from contralateral sensorimotor area to sEMG in beta band during right wrist extension task, likewise, wLTDMI map shows. Information flow from areas other than contralateral sensorimotor areas are included the nonlinear wTDMI map (Fig. 10b) except the strong linear information flow from contralateral sensorimotor areas to sEMG (Fig. 10c). That is, information flow from contralateral sensorimotor areas to sEMG has nonlinear as well as linear information. Linear wTDMI map (Fig. 10c) obtained from our hypotheses tests is very similar with the wLTDMI map (Fig. 9) calculated from eq. (7). Symmetric scale bar is used in the rest of the figures to confirm the polarity of NIXY.
Another noticeable result is that the main locations that give strong information output in Fig. 10c are very similar with the main locations in Fig. 9. This is consistent with Mima et al. (2001)’s result. That is, linear information flow from contralateral sensorimotor cortex to muscle during a weak tonic contraction is observed either in LTDMI calculated from eq. (7) or in linear wTDMI obtained from our hypotheses tests, which mean that we can guess the linear information flow pattern by using our hypotheses tests even without exact calculation. On the other hand, we can not detect significant connectivity regarding gamma band connectivity.
4. Discussion
In the present study, we presented a model-free method to detect the direction of information flow between two time series and to determine whether the information flow comes from linear or nonlinear connectivity by using an information theoretic measure. The ability to detect linear and nonlinear information flow was tested on simulated data. Our method was able to correctly detect the direction of information flow and identify the relationship between two time series generated from distinct models, that is, independent, linear and nontrivial models without a prior knowledge of dynamics of their generating systems.
Many functional or effective methods have been introduced to address the connectivity issue. According to Friston et al. (1993a), functional connectivity is defined as the temporal correlation between spatially remote neurophysiological events, whereas effective connectivity is defined as a causal relation, that is, the influence that one neural system exerts over another either directly or indirectly (Friston et al., 1993b). Generally, effective connectivity depends on the chosen model, although they are able to detect causal relation in multivariate neurophysiological signals. Structural Equation Modeling (SEM) introduced by McIntosh and Gonzalez-Lima (1994) requires a prior specification of a predefined model, and Directed Transfer Function (DTF) proposed by Kaminski and Blinowska (1991) is based on multivariate autoregressive (MVAR) model. Although DTF can be used to estimate simultaneously the direction and spectral properties of the interaction between signals (Kaminski et al., 2001), that is, spectral information flow, it only provides linear information. Hinrichs et al. (2006) pointed that it would be preferable to have a model-free measure of temporally varying causal interactions that would permit the detection of linear as well as nonlinear connectivity. A promising measure from information theory known as directed information transfer (DIT), initially introduced by Saito and Harashima (1981), has been used to identify causal interactions in fMRI, EEG, and MEG studies (Hinrichs et al., 2006; 2008). As similar approaches, a model-free causality measure (Chavez et al., 2003) and a linear variant of the DIT measure (Liang et al., 2001) have been used to investigate connectivity. Although these previous studies provided a novel method as a measure of model-free causal interactions which include functional and effective connectivity, they could not distinguish linear and nonlinear information flows in the estimated connectivity patterns.
On the other hand, the direction of information flow including linear and nonlinear connectivity has been detected by using TDMI method. Conventional MI has the intrinsic limitation that it can not account for the direction of information flow, because it is a symmetric measure. TDMI method overcomes this shortcoming of MI by employing time in one of the variables to calculate MI, which makes it an asymmetric measure. TDMI has been used to investigate the flux of information in clinical (Jeong et al., 2001; Na et al., 2002) and cognitive research (Ioannides, 2001, Ioannides et al., 2000; Min et al., 2003; Jin et al., 2006a, b). Even though all of these studies have shown the direction of information flow, linear and nonlinear connectivity from total connectivity have never been distinguished since they did not play with surrogate tests.
Because our aim is to investigate linear and nonlinear information flow by using mutual information, we combine the pre-existing TDMI methods and surrogate tests. It makes to be able to detect the direction of information flow by an accepted TDMI method and distinguish linear and nonlinear connectivity by employing uni- and bi-variate surrogate tests without any prior knowledge of the dynamic systems generating the signals. Consequently, our method provides a tool to detect linear and nonlinear information flow between two time series. Thus, we suggest that it would be a viable model-free measure of temporally varying causal interactions that is capable of distinguishing the linear and nonlinear information flow. Although the individual methods are not a newly developed algorithm, the whole methodology proposed here has an importance in the field of information flow research.
As a result of application to simulation data, the TDMI method gave the plausible results. As for independent model, to identifying this model is able to be achieved either applying LTDMI or TDMI, since there is no connectivity at all. In case of linear model, LTDMI can imply linearized information flow from Y to X (Fig. 6b). One problem is that it does not guarantee that there is no nonlinear information flow at all, because mathematically, LTDMI takes care of only linear connectivity. However, we can verify that there is no nonlinear information flow between these two time series by using our hypotheses tests, since these two time series have passed the first surrogate test but never passed the second surrogate test. This fact enables us to conclude their relation. The one case needing special attention is where nonlinear information flow exists. We can see the information flows from Y to X from LTDMI results as well (Fig. 7b). However, we should be careful in interpreting this result, especially to conclude which characteristics comprise this connectivity. In other words, as Chavez et al. (2003) showed, since these two time series are not independent time series, LTDMI can be detected when we assume PDF of these two time series are Gaussian distributed. However, through LTDMI method, we never trace the nonlinear connectivity which might be present. Thus, LTDMI can potentially lead to a spurious conclusion that linear connectivity is the origin of the information flow, even though there is a large contribution of nonlinear connectivity in generating connectivity in this example. In other words, LTDMI can also identify the dominant information flow between two time series even without knowing the exact model generating them. However, it is not able to capture all the information when a nonlinear connectivity is present as we show here and Chavez et al. (2003) mentioned in their paper. On the other hand, our TDMI method employing uni- and bi-variate surrogate tests successfully provides a tool to detect the direction of net information and to identify whether it is linear or nonlinear information flow.
As an experimental application, we investigated CM interaction. Beta band coherence between contralateral sensorimotor cortex and hand muscles has been observed in humans during maintained contraction using MEG (Baker et al., 1997, 1999; Brown et al., 1998; Conway et al., 1995; Kilner et al., 2000; Salenius et al., 1997) and EEG (Halliday et al., 1998; Kristeva-Feige et al., 2002; Mima et al., 2000). As a well-known fact, coherence does not account for the direction of information flow. With respect to CM interaction, information flow from the contralateral sensorimotor cortex to muscle in beta band has been shown by Mima et al. (2001). Mima et al. (2001) reported that DTF from EEG to EMG is significantly larger than that from EMG to EEG at 19–30 Hz, and this CM directional information flow in beta band may reflect the motor control command from the cortex to the muscle during a weak tonic contraction. The authors employed a well-known effective connectivity measure, DTF based on MVAR model which can show spectral linear causal relation. Although their result was able to show information flow, it still had the limitation that it demonstrated only linear dependence which is insufficient for the study of complex and nonlinear neurophysiological dynamics (Lopes da Silva, 1991; Popivanov and Dushanova, 1999). We can expect that neuronal networks include nonlinear behavior owing to the physiological fact that individual neurons behave in a nonlinear fashion (Le Van Quyen et al., 2003). Thus, previous research has treated the brain as a deterministic nonlinear dynamical system (David et al., 2006; Stam 2005). Therefore, motor control may have both linear and nonlinear dynamical characteristics, which may explain the existence of linear and nonlinear information flow from contralateral sensorimotor cortex to muscle in order to command and maintain movement in the study. Our results are in line with the previous results reported by Mima et al. (2001) in terms of linear information flow in both LTDMI calculated from eq. (7) and linear wTDMI obtained from our hypotheses tests. In addition, we could show the nonlinear information flows from contralateral motor cortex to muscle as well. The contribution of the nonlinear information flow from other areas to muscle to maintain movement is not as large compared with the contribution of that from contralateral sensorimotor cortex, which may show that the contralateral sensorimotor cortex has the dominant role in motor control command during weak tonic contraction. Further study on the functional role of the nonlinear information flow from brain to muscle will be required in future work.
As for gamma band connectivity, we can not detect significant connectivity to report here. According to Brown et al.(1998), gamma (or Piper) rhythm can be seen during strong contraction rather than weak contraction like used in our study. Although Mima et al., (2001) reported that the DTF from EEG to EMG was significantly larger than that from EMG to EEG within 45–50Hz, in terms of information flow using our method gamma connectivity has not detected, unlikely we can get significant results in beta band.
Gross et al. (2002) reported a spatial separation of efferent drive from primary motor cortex to muscle and afferent input to sensory cortex during slow finger movements using directionality index (DI) which quantifies the direction of coupling between two oscillators. DI introduced by Resenblum and Pikovsky (2001) is derived from the phase relation between two oscillators, which shows both linear and nonlinear connectivity. However, in contrast to TDMI, it does not quantify the information flow and it is less suited for a time dependent analysis. Recently, Chen et al. (2008) reported the coupling between contralateral SM1 and sEMG during a self-paced finger lifting task using MEG. They proposed the TFCMI method as a model-free connectivity measure to exploit frequency dependent modulation between neuronal assemblies capturing both linear and nonlinear couplings of the temporal dynamics of signal power obtained from wavelet transformation. Even though their measure could detect connectivity, they did not distinguish linear and nonlinear information flows in the estimated connectivity patterns just as Hinrichs et al., (2006, 2008) could not. These authors point out that their method has the limitation that it is not designed to unravel the direction of information flow (Chen et al., 2008). However, we can address and resolve linear and nonlinear information flow between cortex and muscle as shown in Fig. 7 and 8, which include wLTDMI and total, nonlinear and linear wTDMI maps in beta band range. Altogether, our results are consistent with the previous findings in terms of connectivity between contralateral sensorimotor cortex and muscle, and supports the hypothesis that motor control command comes from the cortex to the muscle during weak tonic contraction.
TDMI is a well-know information theoretic measure similar to the transfer entropy (TE) proposed by Schreiber (2000). He commented that TE is designed to ignore static correlations due to the common history unlike mutual information. As the real data application of TE, they computed TDMI and TE for the bivariate time series of the breath rate and instantaneous heart rate of a sleeping human. Comparison TDMI with TE gives that TDMI shows no difference whereas TE indicates a stronger flow of information from heart rate to breath rate. As for this criticism to TDMI, it is better to note the difference between TDMI he used and introduced here. Main difference is that he just calculated TDMI with one delay time corresponding to temporal resolution. For instance, in Fig 4 (Schreiber 2000), delay time was 500ms since sampling frequency was 2Hz. However, we calculated TDMI for a 100 ms delay time with steps of 2 ms rather than calculating TDMI with single delay time. This means that we look at how the shared information by bivariate time series evolves as time goes by, which lead us to investigate information flow. If we applied the same type of TDMI as one he used in his work, it could have possibility to mislead us to determine the leading direction of information flow. However, since we accepted the long delay time, we could reduce the possibility. TE would be more proper measure to investigate the dynamic information transfer rather than static one. Comparison our TDMI with TE will take place in our future work.
In addition, we should note the limitations of the method. It is restricted to a bi-variate model, which means that it is focused on looking at the relationships between two time series although there are another time series may influence on the network. Since the neural system is composed of multiple complex circuits, multivariate analysis might be useful to investigate the relationship among these multiple components (Tsujimoto et al., 2009). This method requires relatively long stationary time series compared with the use of linear measures such as cross-correlation or coherence in order to obtain reliable PDF which is an important factor for calculation of entropy and MI. Even though in the calculation of entropy and MI we added a corrective term to compensate for the effect of finite data and quantization on the PDF according to Roulston (1999)’s suggestion, this is a major drawback of this measure because of the difficulty of recording long time series with maintenance of stationarity in real data acquisition. Therefore, if the main aim of the research is to distinguish linear and nonlinear information flow, researchers must consider the amount of data. Otherwise, it may be better to apply LTDMI method to be able to detect linear information flow even though it does not have the ability to detect nonlinear information flow. Despite the limitations, our method would be helpful in understanding information flow between two time series and has potential application to other research where both linear and nonlinear information flows are potentially important.
Acknowledgments
This research was supported in part by the Intramural Research program of the NINDS, NIH. S.H. Jin was supported by a Korea Research Foundation Grant funded by the Korean Government (MOEHRD) (KRF-2006-100358-H00006). The authors would like to thank Dr. Ou Bai for use of his MATLAB scripts (http://www.engineering.vcu.edu/eegbci/bci2vr_index.html) for preprocessing of our EEG and sEMG data.
Footnotes
Publisher's Disclaimer: This is a PDF file of an unedited manuscript that has been accepted for publication. As a service to our customers we are providing this early version of the manuscript. The manuscript will undergo copyediting, typesetting, and review of the resulting proof before it is published in its final citable form. Please note that during the production process errors may be discovered which could affect the content, and all legal disclaimers that apply to the journal pertain.
References
- Alonso JF, Mañanas MA, Hoyer D, Topor Z, Bruce EN. Evaluation of respiratory muscles activity by means of cross mutual information function at different levels of ventilatory effort. IEEE Trans Biomed Eng. 2007;54(9):1573–1582. doi: 10.1109/TBME.2007.893494. [DOI] [PubMed] [Google Scholar]
- Bai O, Mari Z, Vorbach S, Hallett M. Asymmetric spatiotemporal patterns of event-related desynchronization preceding voluntary sequential finger movements: a high-resolution EEG study. Clin Neurophysiol. 2005;116:1213–1221. doi: 10.1016/j.clinph.2005.01.006. [DOI] [PubMed] [Google Scholar]
- Baker SN, Olivier E, Lemon RN. Coherent oscillations in monkey motor cortex and hand muscle EMG show task-dependent modulation. J Physiol. 1997;501:225–241. doi: 10.1111/j.1469-7793.1997.225bo.x. [DOI] [PMC free article] [PubMed] [Google Scholar]
- Baker SN, Kilner JM, Pinches EM, Lemon RN. The role of synchrony and oscillations in the motor output. Exp Brain Res. 1999;128:109–117. doi: 10.1007/s002210050825. [DOI] [PubMed] [Google Scholar]
- Borst A, Theunissen FE. Information theory and neural coding. Nat Neurosci. 1999;2:947–957. doi: 10.1038/14731. [DOI] [PubMed] [Google Scholar]
- Brown P, Marsden CD. What do the basal ganglia do? Lancet. 1998;351:1801–1804. doi: 10.1016/s0140-6736(97)11225-9. [DOI] [PubMed] [Google Scholar]
- Cerutti S, Chiarenza G, Liberati D, Mascellani P, Pavesi G. A parametric method of identification of single-trial event-related potentials in the brain. IEEE Trans Biomed Eng. 1988;35:701–11. doi: 10.1109/10.7271. [DOI] [PubMed] [Google Scholar]
- Chavez M, Martinerie J, Le Van Quyen M. Statistical assessment of nonlinear causality: application to epileptic EEG signals. J Neurosci Methods. 2003;124:113–128. doi: 10.1016/s0165-0270(02)00367-9. [DOI] [PubMed] [Google Scholar]
- Chen CC, Hsieh JC, Wu YZ, Lee PL, Chen SS, Niddam DM, Yeh TC, Wu YT. Mutual-information-based approach for neural connectivity during self-paced finger lifting task. Hum Brain Mapp. 2008;29:265–280. doi: 10.1002/hbm.20386. [DOI] [PMC free article] [PubMed] [Google Scholar]
- Chen F, Xu J, Gu F, Yu X, Meng X, Qiu Z. Dynamic process of information transmission complexity in human brains. Biol Cybern. 2000;83:355–366. doi: 10.1007/s004220000158. [DOI] [PubMed] [Google Scholar]
- Conway BA, Halliday DM, Farmer SF, Shahani U, Maas P, Weir AI, Rosenberg JR. Synchronization between motor cortex and spinal motoneuronal pool during the performance of a maintained motor task in man. J Physiol. 1995;489:917–924. doi: 10.1113/jphysiol.1995.sp021104. [DOI] [PMC free article] [PubMed] [Google Scholar]
- David O, Cosmelli D, Friston KJ. Evaluation of different measures of functional connectivity using a neural mass model. Neuroimage. 2004;21:659–673. doi: 10.1016/j.neuroimage.2003.10.006. [DOI] [PubMed] [Google Scholar]
- David O, Kiebel SJ, Harrison LM, Mattout J, Kilner JM, Friston KJ. Dynamic causal modeling of evoked responses in EEG and MEG. Neuroimage. 2006;30:1255–1272. doi: 10.1016/j.neuroimage.2005.10.045. [DOI] [PubMed] [Google Scholar]
- Daubechies I. The wavelet transform time-frequency localization and signal analysis. IEEE Trans Inf Theory. 1990;36:961–1004. [Google Scholar]
- Daubechies I. Ten Lectures on Wavelets. Society for Industrial and Applied Mathematics. 1992 [Google Scholar]
- Diks C, DeGoede J. A general nonparametric bootstrap test for Granger causality. In: Broer H, Krauskopf B, Vegter G, editors. Global analysis of dynamical systems. London: IoP Publishing; 2001. pp. 391–403. [Google Scholar]
- Frasch MG, Walter B, Friedrich H, Hoyer D, Eiselt M, Bauer R. Detecting the signature of reticulothalamocortical communication in cerebrocortical electrical activity. Clin Neurophysiol. 2007;118:1969–1979. doi: 10.1016/j.clinph.2007.05.071. [DOI] [PubMed] [Google Scholar]
- Friston KJ, Frith CD, Frackowiak RSJ. Time-dependent changes in effective connectivity measured with PET. Hum Brain Mapp. 1993a;1:69–80. [Google Scholar]
- Friston KJ, Frith CD, Liddle PF, Frackowiak RSJ. Functional connectivity: the principal component analysis of large (PET) data sets. J Cereb Blood Flow Metab. 1993b;13:5–14. doi: 10.1038/jcbfm.1993.4. [DOI] [PubMed] [Google Scholar]
- Gerloff C, Richard J, Hadley J, Schulman AE, Honda M, Hallett M. Functional coupling and regional activation of human cortical motor areas during simple, internally paced and externally paced finger movements. Brain. 1998;121(Part 8):1513–1531. doi: 10.1093/brain/121.8.1513. [DOI] [PubMed] [Google Scholar]
- Gross J, Timmermann L, Kujala J, Dirks M, Schmitz F, Salmelin R, Schnitzler A. The neural basis of intermittent motor control in humans. PNAS. 2002;99(4):2299–302. doi: 10.1073/pnas.032682099. [DOI] [PMC free article] [PubMed] [Google Scholar]
- Grossmann A, Morlet J. Decomposition of Hardy function into square integrable wavelets of constant shape. SIAM J Math Anal. 1984;15:723–736. [Google Scholar]
- Halliday DM, Conway BA, Farmer SF, Rosenberg JR. Using electroencephalography to study functional coupling between cortical activity and electromyograms during voluntary contractions in humans. Neurosci Lett. 1998;241:5–8. doi: 10.1016/s0304-3940(97)00964-6. [DOI] [PubMed] [Google Scholar]
- Hinrichs H, Heinze HJ, Schoenfeld MA. Causal visual interactions as revealed by an information theoretic measure and fMRI. Neuroimage. 2006;31:1051–1060. doi: 10.1016/j.neuroimage.2006.01.038. [DOI] [PubMed] [Google Scholar]
- Hinrichs H, Noesselt T, Heinze HJ. Directed information flow-a model free measure to analyze causal interactions in event related EEG-MEG-experiments. Hum Brain Mapp. 2008;29:193–206. doi: 10.1002/hbm.20382. [DOI] [PMC free article] [PubMed] [Google Scholar]
- Holschneider DP, Waite JJ, Leuchter AF, Walton NY, Scremin OU. Changes in electrocortical power and coherence in response to the selective cholinergic immunotoxin 192 IgG-saporin. Exp Brain Res. 1999;126:270–280. doi: 10.1007/s002210050736. [DOI] [PMC free article] [PubMed] [Google Scholar]
- Ioannides AA. Real time human brain function: observations and inferences from single trial analysis of magnetoencephalographic signals. Clin Electroencephalogr. 2001;32:98–111. doi: 10.1177/155005940103200304. [DOI] [PubMed] [Google Scholar]
- Ioannides AA, Liu LC, Kwapien J, Drozdz S, Streit M. Coupling of regional activations in a human brain during an object and face affect recognition task. Hum Brain Mapp. 2000;11:77–92. doi: 10.1002/1097-0193(200010)11:2<77::AID-HBM20>3.0.CO;2-0. [DOI] [PMC free article] [PubMed] [Google Scholar]
- Jeong J, Gore JC, Peterson BS. Mutual information analysis of the EEG in patients with Alzheimer’s disease. Clin Neurophysiol. 2001;112:827–835. doi: 10.1016/s1388-2457(01)00513-2. [DOI] [PubMed] [Google Scholar]
- Jin SH, Kwon YJ, Jeong JS, Kwon SW, Shin DH. Differences in brain information transmission between gifted and normal children during scientific hypothesis generation. Brain and Cognition. 2006a;62:191–197. doi: 10.1016/j.bandc.2006.05.001. [DOI] [PubMed] [Google Scholar]
- Jin SH, Kwon YJ, Jeong JS, Kwon SW, Shin DH. Increased information transmission during scientific hypothesis generation: Mutual information analysis of multichannel EEG. Int J Psychophysiol. 2006b;62:337–344. doi: 10.1016/j.ijpsycho.2006.06.003. [DOI] [PubMed] [Google Scholar]
- Kaminski M, Blinowska K. A new method of the description of the information flow in the brain structures. Biol Cybern. 1991;65:203–210. doi: 10.1007/BF00198091. [DOI] [PubMed] [Google Scholar]
- Kaminski M, Ding M, Truccolo WA, Bressler S. Evaluating causal relations in neural systems: Granger causality, directed transfer function and statistical assessment of significance. Biol Cybern. 2001;85:145–157. doi: 10.1007/s004220000235. [DOI] [PubMed] [Google Scholar]
- Kantz H, Schreiber T. Nonlinear Time Series Analysis. Cambridge University Press; Cambridge: 2004. [Google Scholar]
- Kilner JM, Baker SN, Salenius S, Hari R, Lemon RN. Human cortical muscle coherence is directly related to specific motor parameters. J Neurosci. 2000;20:8838–8845. doi: 10.1523/JNEUROSCI.20-23-08838.2000. [DOI] [PMC free article] [PubMed] [Google Scholar]
- Kraskov A. Dissertation (Ph.D. Thesis) NIC-Directors; Jülich: 2004. Synchronization and interdependence measures and their applications to the electroencephalogram of epilepsy patients and clustering of data. Document publicly available at http://www.fz-juelich.de/nic-series/NIC-Series-e.html. [Google Scholar]
- Kraskov A, Stögbauer H, Grassberger P. Estimating mutual information. Phys Rev E. 2004;69:066138. doi: 10.1103/PhysRevE.69.066138. [DOI] [PubMed] [Google Scholar]
- Kristeva-Feige R, Fritsch C, Timmer J, Lucking CH. Effects of attention and precision of exerted force on beta range EEG–EMG synchronization during a maintained motor contraction task. Clin Neurophysiol. 2002;113:124–131. doi: 10.1016/s1388-2457(01)00722-2. [DOI] [PubMed] [Google Scholar]
- Kristeva R, Patino L, Omlor W. Beta-range cortical motor spectral power and corticomuscular coherence as a mechanism for effective corticospinal interaction during steady-state motor output. Neuroimage. 2007;36:785–792. doi: 10.1016/j.neuroimage.2007.03.025. [DOI] [PubMed] [Google Scholar]
- Kreuz T. Dissertation (Ph.D. Thesis) NIC-Directors; Jülich: 2004. Measuring synchronization in model systems and electroencephalographic time series from epilepsy patients. Document publicly available at http://www.fz-juelich.de/nic-series/NIC-Series-e.html. [Google Scholar]
- Kwapien J, Drozkz S, Liu LC, Ioannides AA. Cooperative dynamics in auditory brain respenses. Phys Rev E. 1998;58(5):6359–67. [Google Scholar]
- Le Van Quyen M, Chavez M, Rudrauf D, Martinerie J. Exploring the nonlinear dynamics of the brain. J Physiology Paris. 2003;97:629–639. doi: 10.1016/j.jphysparis.2004.01.019. [DOI] [PubMed] [Google Scholar]
- Leocani L, Toro C, Manganotti P, Zhuang P, Hallett M. Event-related coherence and event-related desynchronization/synchronization in the 10 Hz and 20 Hz EEG during self-paced movements. Electroencephalogr Clin Neurophysiol. 1997;104:199–206. doi: 10.1016/s0168-5597(96)96051-7. [DOI] [PubMed] [Google Scholar]
- Liang H, Ding M, Bressler SL. Temporal dynamics of information flow in the cerebral cortex. Neurocomputing. 2001;38–40:1429–1435. [Google Scholar]
- London M, Schreibman A, Hausser M, Larkum ME, Segev I. The information efficacy of a synapse. Nat Neurosci. 2002;5:332–340. doi: 10.1038/nn826. [DOI] [PubMed] [Google Scholar]
- Lopes da Silva F. Neural mechanisms underlying brain waves: from neural membranes to networks. Electroencephalogr Clin Neurophysiol. 1991;79:81–93. doi: 10.1016/0013-4694(91)90044-5. [DOI] [PubMed] [Google Scholar]
- McIntosh AR, Gonzalez-Lima F. Network interactions among limbic cortices, basal forebrain, and cerebellum differentiate a tone conditioned as a Pavlovian excitor or inhibitor: fluorodeoxyglucose mapping and covariance structural modeling. J Neurophysiol. 1994;72(4):1717– 1733. doi: 10.1152/jn.1994.72.4.1717. [DOI] [PubMed] [Google Scholar]
- Mima T, Steger J, Schulman AE, Gerloff C, Hallett M. Electroencephalographic measurement of motor cortex control of Muscle activity in humans. Clin Neurophysiol. 2000;111:326–337. doi: 10.1016/s1388-2457(99)00229-1. [DOI] [PubMed] [Google Scholar]
- Mima T, Matsuoka T, Hallett M. Information flow from the sensorimotor cortex to muscle in humans. Clin Neurophysiol. 2001;112:122–126. doi: 10.1016/s1388-2457(00)00515-0. [DOI] [PubMed] [Google Scholar]
- Min BC, Jin SH, Kang IH, Lee DH, Kang JK, Lee ST, Sakamoto K. Analysis of mutual information content for EEG responses to odor stimulation for subjects classified by occupation. Chem Senses. 2003;28:741–749. doi: 10.1093/chemse/bjg066. [DOI] [PubMed] [Google Scholar]
- Myers LJ, Lowery M, O’Malley M, Vaughan CL, Heneghan C, St Clair Gibson A, Harley YXR, Sreenivasan R. Rectification and non-linear pre-processing of EMG signals for cortico-muscular analysis. J Neuroscience methods. 2003;124:157–165. doi: 10.1016/s0165-0270(03)00004-9. [DOI] [PubMed] [Google Scholar]
- Na SH, Jin SH, Kim SY, Ham BJ. EEG in schizophrenic patients: mutual information analysis. Clin Neurophysiol. 2002;113:1954–1960. doi: 10.1016/s1388-2457(02)00197-9. [DOI] [PubMed] [Google Scholar]
- Nagamine T, Kajola M, Salmelin R, Shibasaki H, Hari R. Movement-related slow cortical magnetic fields and changes of spontaneous MEG- and EEG-brain rhythms. Electroencephalogr Clin Neurophysiol. 1996;99:274–286. doi: 10.1016/0013-4694(96)95154-8. [DOI] [PubMed] [Google Scholar]
- Nichols JM, Seaver M, Trickey ST. A method for detecting damage-induced nonlinearities in structures using information theory. J Sound and Vibration. 2006;297:1–16. [Google Scholar]
- Péguin-Feissolle A, Teräsvirta T. A general framework for testing the Granger noncausality hypothesis. Tech. Rep. 343, SSE/EFI Working Paper Series in Economics and Finance. 1999 [Google Scholar]
- Percival D, Walden A. Wavelet Methods for Time Series Analysis. Cambridge University Press; Cambridge, UK: 2000. [Google Scholar]
- Pereda E, Quian Quiroga R, Bhattacharya J. Nonlinear multivariate analysis of neurophysiological signals. Prog Neurobiology. 2005;77:1–37. doi: 10.1016/j.pneurobio.2005.10.003. [DOI] [PubMed] [Google Scholar]
- Popivanov D, Dushanova J. Non-linear EEG dynamic changes and their probable relation to voluntary movement organization. Neuroreport. 1999;10:1397–1401. doi: 10.1097/00001756-199905140-00003. [DOI] [PubMed] [Google Scholar]
- Prichard D, Theiler J. Generating surrogate data for time series with several simultaneously measured variables. Phys Rev Lett. 1994;73:951–954. doi: 10.1103/PhysRevLett.73.951. [DOI] [PubMed] [Google Scholar]
- Qin L, Ding L, He B. Motor imagery classification by means of source analysis for brain computer interface applications. J Neural Eng. 2004;1:135–41. doi: 10.1088/1741-2560/1/3/002. [DOI] [PMC free article] [PubMed] [Google Scholar]
- Qin L, He B. A wavelet-based time-frequency analysis approach for classification of motor imagery for brain-computer interface applications. J Neural Eng. 2005;2:65–72. doi: 10.1088/1741-2560/2/4/001. [DOI] [PubMed] [Google Scholar]
- Rosenblum M, Pikovsky AS. Detecting direction of coulping in interacting oscillators. Phys Rev E. 2001;64 (045202):1–4. doi: 10.1103/PhysRevE.64.045202. [DOI] [PubMed] [Google Scholar]
- Roulston MS. Estimating the errors on measured entropy and mutual information. Physica D. 1999;125:285–294. [Google Scholar]
- Saito Y, Harashima H. In: Recent Advances in EEG and EMG Data Processing. Yamaguchi N, Fujisawa K, editors. Elsevier/North-Holland Biomedical Press; New York: 1981. pp. 133–146. [Google Scholar]
- Salenius S, Portin K, Kajola M, Salmelin R, Hari R. Cortical control of human motoneuron firing during isometric contraction. J Neurophysiol. 1997;77:3401–3405. doi: 10.1152/jn.1997.77.6.3401. [DOI] [PubMed] [Google Scholar]
- Schreiber T. Measuring information transfer. Phys Rev Lett. 2000;85:461–464. doi: 10.1103/PhysRevLett.85.461. [DOI] [PubMed] [Google Scholar]
- Schreiber T, Schmitz A. Surrogate time series. Physica D. 2000;142:346–382. [Google Scholar]
- Shannon CE, Weaver W. The Mathematical Theory of Information. University Press; Urbana, Illinois: 1949. [Google Scholar]
- Shaw JC, Ongley C. The measurement of synchronization. In: Petsche H, Brazier MAB, editors. Synchronization of EEG Activity in Epilepsies. Springer-Verlag; Wien: 1972. pp. 204–216. [Google Scholar]
- Shen Y, Olbrich E, Achermann P, Meier PF. Dimensional complexity and spectral properties of the human sleep EEG. Clin Neurophysiol. 2003;114:199–209. doi: 10.1016/s1388-2457(02)00338-3. [DOI] [PubMed] [Google Scholar]
- Stam CJ. Nonlinear dynamical analysis of EEG and MEG: Review of an emerging field. Clin Neurophysiol. 2005;116:2266–2301. doi: 10.1016/j.clinph.2005.06.011. [DOI] [PubMed] [Google Scholar]
- Tallon-Baudry C, Bertrand O, Delpuech C, Pernier J. Oscillatory γ-band activity induced by a visual search task in humans. J Neurosci. 1997;17:722–34. doi: 10.1523/JNEUROSCI.17-02-00722.1997. [DOI] [PMC free article] [PubMed] [Google Scholar]
- Thatcher R. Psychopathology of early frontal lobe damage: dependence on cycles of development. Dev Psychopathol. 1994a;6:565–596. [Google Scholar]
- Thatcher R. Cyclic cortical reorganization origins of human cognitive development. In: Dawson G, Fischer K, editors. Human behavior and the developing brain. New York: Guilford; 1994b. [Google Scholar]
- Theiler J, Eubank S, Longtin A, Galdrikian B, Farmer JD. Testing for nonlinearity in time series: the method of surrogate data. Physica D. 1992;58:77–94. [Google Scholar]
- Tsujimoto T, Mima T, Shimazu H, Isomura Y. Directional organization of sensorimotor oscillatory activity related to the electromyogram in the monkey. Clin Neurophysiol. 2009;120:1168–73. doi: 10.1016/j.clinph.2009.02.177. [DOI] [PubMed] [Google Scholar]
- Xu J, Liu Z, Liu R, Yang Q. Information transmission in human cerebral cortex. Physica D. 1997;106:363–374. [Google Scholar]
- Yao B, Salenius S, Yue GH, Brown RW, Liu JZ. Effects of surface EMG rectification on power and coherence analyses: An EEG and MEG study. J Neurosci Methods. 2007;159:215–223. doi: 10.1016/j.jneumeth.2006.07.008. [DOI] [PubMed] [Google Scholar]


