

Abstract
Understanding the origins of localized substitution rate heterogeneity has important implications for identifying functional genomic sequences. Outside of gene regions, the origins of rate heterogeneity remain unclear. Experimental studies establish that chromatin compaction affects rates of both DNA lesion formation and repair. A functional association between chromatin status and 5-methyl-cytosine also exists. These suggest that both the total rate and the type of substitution will be affected by chromatin status. Regular positioning of nucleosomes, the building block of chromatin, further predicts that substitution rate and type should vary spatially in an oscillating manner. We addressed chromatin's influence on substitution rate and type in primates. Matched numbers of sites were sampled from Dnase I hypersensitive (DHS) and closed chromatin control flank (Flank). Likelihood ratio tests revealed significant excesses of total and of transition substitutions in Flank compared with matched DHS for both intergenic and intronic samples. An additional excess of CpG transitions was evident for the intergenic, but not intronic, regions. Fluctuation in substitution rate along ∼1,800 primate promoters was measured using phylogenetic footprinting. Significant positive correlations were evident between the substitution rate and a nucleosome score from resting human T-cells, with up to ∼50% of the variance in substitution rate accounted for. Using signal processing techniques, a dominant oscillation at ∼200 bp was evident in both the substitution rate and the nucleosome score. Our results support a role for differential DNA repair rates between open and closed chromatin in the spatial distribution of rate heterogeneity.
Keywords: substitution rate heterogeneity, molecular evolution, comparative genomics, chromatin, nucleosome, CpG, 5-methyl-cytosine
Introduction
Localized fluctuations in substitution rate are widely employed to draw inference concerning the phenotypic significance of genomic sequence. The concept that the magnitude of sequence divergence indicates biological importance arises from the suppressive influence of purifying natural selection on genetic variation. The relationship between primary sequence divergence and biological function is well illustrated by the “conservation” track of genome browsers which reveal, for instance, sharp transitions in substitution rate at the boundaries of exons and introns. The scrutiny by natural selection is held to be greater for exons than their flanking intron sequences due to the explicit encoding of molecular function by exons. The capacity for natural selection to underpin localized changes in substitution rate is thus firmly established for sequences spanned by annotated genes. Localized changes in evolutionary rate are also evident in nongenic parts of the genome where the role of natural selection is more ambiguous, suggesting a contribution from localized variation in mutation rate. The cause of spatial fluctuation in mutation remains an open question.
Analyses of rates of DNA lesion formation and re- pair in vitro establish chromatin structure as a potential contributor to fluctuations in mutagenesis. Chromatin is constructed from nucleosomes that consist of ∼147 nucleotides of DNA wrapped around a histone octamer. The degree of chromatin compaction depends on the extent of physical separation between adjacent nucleosomes, with the linker region between nucleosomes ranging in size from 10 to 80 bp (McGhee and Felsenfeld 1980; Luger et al. 1997). The degree of chromatin compaction is expected to affect integrity of the underlying DNA. DNA in high-ordered or compact chromatin is less accessible to damage agents than decondensed or free chromatin, as illustrated by the resistance of highly condensed mature spermatocyte DNA to benzpyrene-induced damage (Balhorn et al. 1984). Linker sites, on the other hand, are more accessible to attack by DNA-damaging agents as illustrated by the 6-fold difference in pyrimidine–pyrimidone photoproducts induced by UV exhibited by linker compared with nucleosomal DNA (Mitchell-Olds et al. 1995). Levels of DNA repair are also affected by chromatin compaction. DNA repair requires recruitment of proteins to interact with DNA, and it has been demonstrated that linker sites are more readily repaired than nucleosomal sites with efficiency increasing with distance from the center of nucleosomes (Boulikas 1992; Suter and Thoma 2002). The consequence of reduced accessibility to DNA repair systems is increased longevity of DNA lesions, increasing the likelihood of their conversion into a mutation during the next round of DNA replication. Chromatin compaction therefore retards both lesion formation and lesion repair rates. Despite their greater lesion rate, the relative accessibility of linker region DNA to repair systems should result in their exhibiting a comparatively lower mutation rate than flanking nucleosome-associated DNA (Boulikas 1992).
A nucleosome origin for mutation rate heterogeneity also suggests that nucleosome and linker regions will be further distinguished by their mutation type profile. Mutations arising from nucleotide misincorporation during DNA replication will affect all genomic sequence, whereas mutations arising from damage are localized. Accordingly, a nucleosome origin for rate heterogeneity predicts a periodic change in the type of substitution along the sequence. The exact nature of that change hinges on differences in the DNA replication/lesion mutation mechanisms. An excess of transition over transversion mutations from DNA replication has been argued based on the natural frequencies of base tautomers (Watson and Crick 1953; Topal and Fresco 1976; Sinha and Haimes 1981). In contrast, DNA damage processes differ in their tendency towards transition or transversion bias. For example, hydrolysis and UV damage predominantly induce transitions, whereas oxidative nucleotide damage typically produces transversions (Cheng et al. 1992). Estimates from humans suggest that a substantial excess of transitions is likely for mutations arising from DNA damage from the dominance of transitions within CpG dinucleotides alone (Cooper and Youssoufian 1988). If chromatin structure affects repair of DNA damage, then we conjecture that the ratio of mutations from DNA damage to those from replication errors will differ between nucleosome and linker positions and that this will cause the ratio of transition to transversion mutations to also differ. In other words, the profile of substitution types will vary with chromatin status.
Evidence consistent with an influence of chromatin structure on the total rate of substitution has been presented for both mammals and yeast. A comparison of substitution rates between regions annotated (relatively coarsely) in humans as open or closed chromatin indicated a negative correlation between chromatin openness and substitution rate for intergenic regions, but a positive correlation for 4-fold degenerate positions in genic regions (Prendergast et al. 2007). More recent analyses of yeast protein-coding genes contradict the latter, finding instead a lower substitution rate for exonic linker regions (Warnecke et al. 2008; Washietl et al. 2008). An effort to replicate the findings from yeast analyses on primates was unsuccessful (Washietl et al. 2008), further suggesting that important differences exist between these lineages.
The different results between mammals and yeast for intergenic/genic sequences may reflect confounding from the intragenomic heterogeneity of substitution and/or the multicellularity of mammals. Both gene density and substitution rate are positively correlated with GC% in mammals (Eyre-Walker and Hurst 2001). The results of Prendergast et al. (2007) for 4-fold degenerate positions may therefore arise from the increasing evolutionary rate with GC%. On the other hand, the greater diversity of cell types in mammals may have contributed to the failure to replicate findings from yeast in mammals (Washietl et al. 2008). Whereas heritable mutations are restricted to germ line cell lineages in mammals, chromatin survey experiments are typically conducted on somatic cell types. As cellular differentiation involves changes in chromatin, consistency in nucleosome placement between somatic and germ line cell types will be imperfect. The methodological approach used in the yeast studies, classifying nucleotide positions relative to annotated nucleosomes and concatenating equivalently indexed nucleotides from disjoint genomic locations (Warnecke et al. 2008; Washietl et al. 2008), is particularly sensitive to errors in nucleosome location coordinates. This methodological approach further assumes identical substitution processes between different nucleosomes, an assumption violated for mammals which exhibit a greater diversity in mutation processes across their genomes compared with yeast. The strategy of sampling single nucleotides has the added limitation for mammal DNA of preventing consideration of events affecting 5-methyl-cytosine (5mC), a hypermutable nucleotide functionally associated (and thus most abundant) with closed chromatin. This functional role and mutagenic propensity may thus potentially confound analyses of mammal sequences. The contribution of 5mC to chromatin-associated rate variation remains unknown. Although nucleosome localizations appear conserved across substantial evolutionary divergences for yeast (Washietl et al. 2008) and mammal species (Wilson et al. 2008), the relationship between individual nucleosomes and changes in evolutionary rate have not been demonstrated.
In this study, we address the influence of chromatin on the total rate and type of sequence substitutions in mammals at multiple scales and across region types. We considered two types of experimental classifications to represent open and closed chromatin: DHS sites along with their immediate flanking sites and nucleosomal and flanking linker sites. We then tested the following hypotheses: 1) chromatin structure affects the substitution rate; 2) chromatin structure affects the substitution type profile; and 3) individual nucleosomes leave detectable impressions in substitution rate and/or profile along the sequences. We find support for all three hypotheses along with evidence that the magnitude of these effects differs between genomic regions.
Methods
We used Ensembl release 50 for all annotations of gene, CpG island and repeat sequences, and the multiple genome sequence alignments. We sampled the ORTHEUS genomic multiple sequence alignments of the human, chimpanzee, and macaque genomes (Hubbard et al. 2009) using human genome coordinates (discussed below).
DHS Data
DHS NCBI35 assembly coordinates (Boyle et al. 2008) were downloaded from University of California Santa Cruz using the table browser and converted to NCBI36 assembly using the liftover tool (Karolchik et al. 2007). To minimize the proportion of potential regulatory elements within a DHS, and thus the influence of natural selection, only intronic and intergenic DHS with a length between 300 and 2,000 bp were selected. Additionally, only intergenic DHS that were more than 3 kbp away on both sides from annotated protein-coding genes were used.
Matching control regions for each selected DHS were obtained by extending both upstream and downstream, defining the Flank (non-DHS) region. For intronic regions, if the length of DHS was less than half of the length of the intron, then the Flank was sampled such that its total length matched that of the DHS region. If possible, the Flank was sampled so the lengths of the 5′-Flank and 3′-Flank were identical. For Flanks that spanned an exon, the exon was excluded and the length of the intronic side Flank expanded to maintain the equal length of DHS and Flank. Intronic DHS whose length was greater than half of the length of the intron were excluded.
Multiple sequence alignments from human, chimpanzee, and macaque were sampled based on the DHS and Flank coordinates of human sequences. The quality of the alignments was controlled by eliminating those with more than 10% gaps or Ns in the alignment. In addition, to avoid extreme compositional heterogeneity that may cause severe violation of the phylogenetic model, alignments with annotated CpG island sequence were excluded. This resulted in 6,705 intergenic and 7,150 intronic alignments, respectively.
Promoter Data with Nucleosome Annotations
The nucleosome mapping on human promoters was previously defined by Ozsolak et al. (2007). The coordinates of nucleosome placement were downloaded from Gene Expression Omnibus under accession number GSE6385, and coordinates were converted to the NCBI36 assembly using liftover. Nucleosome-associated promoters were then identified based on Ensembl gene annotations. Genes within 3 kbp of a protein-coding gene upstream were excluded. As the nucleosome data were derived from humans, we removed alignment columns that contained gaps in the human sequence. Alignments were obtained based on the annotated human transcription start site to 1,500 bp upstream. This resulted in 1,849 alignments of promoter regions. Note that this sample contained genes with annotated CpG islands.
Chip-seq Nucleosome Signals
Genome-wide nucleosome mapping through high-throughput sequencing was previously described for resting and activated T-cells (Schones et al. 2008). We selected data from the resting T-cell state as more representative of germ line chromatin status because T-cell activation involved stimulus by antibody treatment (Schones et al. 2008). Resting T-cell nucleosome scores for each chromosome were downloaded from http://dir.nhlbi.nih.gov/ papers/lmi/epigenomes/hgtcellnucleosomes.aspx. These nucleosome scores were calculated by counting the number of sequencing tags of upstream 80 bp on the “+” strand and downstream 80 bp on the “ − ” strand with a sliding window of 10 bp (Schones et al. 2008). A higher nucleosome score represents a higher probability of nucleosome occupancy.
Statistical Testing of Evolutionary Parameters
All evolutionary modeling was done using PyCogent version 1.3.0.dev (Knight et al. 2007). Evolutionary parameters were estimated using phylogeny-based maximum likelihood inference. We used the HKY substitution model (Hasegawa et al. 1985) in the standard phylogeny-based maximum likelihood framework (Felsenstein 2003). The HKY model was chosen as it incorporates a parameter (which we denote λ) that measures the relative rate ratio of transition to transversion substitution rates. Evolutionary rate parameters were compared between DHS and Flank using likelihood ratio (LR) tests. Substitution rate was measured for each branch as the expected number of substitutions per site on the unrooted tree “(human, chimpanzee, macaque),” and the set of the three branch lengths is denoted k. We used the sum of these three branch lengths (K = ∑k) to measure substitution rate. Parameter values are delineated between DHS and Flank using matching subscripts, for example, kDHS and kFlank are the set of branch lengths for DHS and Flank, respectively. For evaluating whether the substitution rate differed between the DHS and Flank regions, a standard likelihood function was defined, using the unrooted tree. The free parameters in the null model were the branch lengths (one k or kDHS = kFlank), λ, and the nucleotide frequencies (estimated as the average across all sequences in an alignment). The alternate model allowed different branch lengths between the regions (kDHS≠kFlank). For a single alignment, we first maximized the log-likelihood of the null using PyCogent's built-in numerical optimizers at default settings. The resulting model maximum likelihood estimates were then used as starting values for optimizing the alternate model. Because the null hypothesis is nested in the alternate hypothesis, the LR, computed from the resulting log-likelihoods as LR = 2(lnLalt − lnLnull), will be asymptotically χ32 (as the alternate model has three additional branch length parameters). We tested whether rate differences between DHS and Flank were consistent with the hypothesis of elevated mutation rate affecting Flank: DHS/Flank pairs nominally significant at the 0.05 level that satisfied the relation KFlank > KDHS were counted as a success and those satisfying KFlank < KDHS were counted as a failure. A one-tailed sign test was applied to the resulting counts. The same procedure was followed to assess whether differences between DHS and Flank in λ were consistent with the hypothesis of excess transition mutations affecting Flank.
To assess the extent to which λ substitutions were affected by transitions at CpG dinucleotides, we used a dinucleotide substitution model with context-dependent parameter CG.λ. In brief, we extended the HKY model to dinucleotides using the nucleotide frequency weighted model form (Lindsay et al. 2008). This model form has the property that, in the absence of any context parameter (such as CG.λ), the dinucleotide model is the nucleotide HKY model. The CpG transition term CG.λ was included in the instantaneous rate matrix for the CpG ↔ TpG and CpG ↔ CpA exchanges. The CG.λ term measures the ratio of transitions not accounted for by the common transition effect (λ) across all dinucleotides. We assessed whether CG.λ differed between DHS and Flank in a manner that was independent of their difference in λ with an LR test, contrasting a null hypothesis of equivalent CpG transition rate between DHS and Flank (CG.λDHS = CG.λFlank, λDHS≠λFlank) against the alternate of unequal such rates (CG.λDHS≠CG.λFlank, λDHS≠λFlank). Both null and alternate hypotheses allowed the common transition rate term to differ between DHS and Flank (λDHS≠λFlank). We further assessed whether differences in transitions between DHS and Flank were independent of differences in CpG transitions. In this case, the null (λDHS = λFlank, CG.λDHS≠CG.λFlank) and alternate (λDHS≠λFlank, CG.λDHS≠CG.λFlank) had a difference in CpG transition rate between DHS and Flank. Both these tests arrive at the same model parameterization, and the associated LR tests have the same degrees of freedom.
Measuring Spatial Variation in Substitution
Maximum likelihood phylogenetic footprinting (Wakefield et al. 2005), a sliding window method, was applied to measure evolutionary rate variation along sequence alignments. Using the HKY model, we first fit the model to the entire alignment. The spatial distribution of substitution was then measured using a 100-bp window that was moved progressively down the alignment in 5-bp steps. For each window, the value of λ in the HKY model was constrained to equal that estimated from the full alignment and then the standard PyCogent optimization routines were used to maximize the log-likelihood of the model. (This restriction on λ was adopted as it facilitated comparisons with the phylogenetic Hidden Markov Model [phylo-HMM].) The sum of the branch lengths leading to the human, chimpanzee, and macaque sequences is taken as an estimate of the total substitution rate K and was assigned to the coordinate corresponding to the middle of the window.
We also used a phylo-HMM for testing whether the spatial distribution of evolutionary rate was significantly larger than chance. The model was implemented using standard features of PyCogent (Knight et al. 2007). The null model used the HKY substitution model with Γ-distributed rate heterogeneity with two equiprobable bins, designated fast and slow. The alternate hypothesis allowed a site's rate class to be influenced by that of it's neighbor, a property affected by a new parameter, the probability of switching between site classes. The LR comparing these two models was taken as χ12. For the purpose of comparing the distribution of evolutionary rates as inferred under the phylo-HMM with those inferred from the footprinting, we used the posterior probability that a site belongs to the fast class (pfast) as an indicator of substitution rate variation.
Statistical Testing of Correlation between K and Nucleosome Score
For a given promoter, both the estimate of K and the nucleosome score (Schones et al. 2008) consist of a series of estimates that are not statistically independent of their neighbor values. Standard significance testing of the correlation coefficient is therefore not appropriate, and we employed a bootstrap procedure (Kunsch 1989) for estimating the probability that ρ≠0. Specifically, we generated randomized series of K (denoted Krand) by randomly sampling with replacement the equivalent of one footprinting window from the observed K until the Krand series length was the same as that of the observed data. If a random draw required a series that exceeded the length of the data, the draw was continued from the beginning. For each such randomly generated series of K, we computed its correlation coefficient (ρrand) with the observed nucleosome score series. This process was continued for 2,000 iterations, generating a distribution of ρrand that was used to estimate the probability that the observed ρ occurred by chance as the frequency of ρrand ≥ ρ. Because of the large number of promoters being considered, application of the multiple testing correction to the results from this analysis only identified loci for which no single ρrand was greater than the observed ρ, or, in the case of assessing negatively correlated loci, all ρrand were greater than observed ρ.
Signal Period Estimation
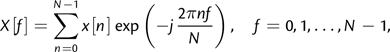
The Fourier transform is a well-known tool for characterizing periodic behavior in numerical signals and has also been used extensively in periodicity analysis of sequence data (Anastassiou 2001). For the computation of Fourier spectra from discrete signals such as the substitution rate signal K, the discrete Fourier transform (DFT) is appropriate. For a signal x[n] of length N and corresponding to K for the nth alignment window, the DFT is defined as
 |
(1) |
where f is the discrete frequency index corresponding to a period p = N/f. In many cases, it is desirable to estimate the dominant periodicity from the magnitude spectrum |X[f]| using the maximum likelihood estimator
| (2) |
To express some measure of confidence in the result, however, it is also desirable to measure the variance in the estimates  and
and  . For the frequency estimate , the Cramér–Rao bound (CRB) is a well-known result (Tretter 1985). For the period estimate, following the same assumptions as Tretter (i.e., a single sinusoid of amplitude A in additive white noise of variance σw2), the CRB has recently been shown to be (Epps J, Ying H, Huttley GA, unpublished data)
| (3) |
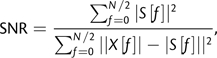
Consequently, the variance of the estimator employed in the preceding analyses is determined strongly by the period length p, the inverse of the signal-to-noise ratio (SNR = A2/σw2), and the signal length N. Retaining the assumption of a single (dominant) sinusoid in additive noise, we estimated the SNR as (Epps J, Ying H, Huttley GA, unpublished data)
 |
(4) |
where
| (5) |
Availability of Data and Software
All scripts used to undertake these analyses and the sampled data are available on request from the authors.
Results
DHS Regions Exhibit Distinct Substitution Types and Rate
Use of DHS regions annotated from somatic tissues will make our analyses conservative. DHS regions are caused by a long nucleosome-free region, noncanonical nucleosome structures (Jakobovits et al. 1980; Elgin 1981; Gross and Garrard 1988), or histone modifications that contribute to high accessibility to nuclease (e.g., histone acylation and chromatin remodeling; Steger and Workman 1997, Shimada et al. 2006). These features affect the operation of DNA repair processes and imply that DHS regions will have both lower total and transition mutations than their Flank (Gross and Garrard 1988). This effect will only extend to substitution processes if the DHS/Flank status exists in the germ line. There are two major types of DHS, constitutive and inducible. Constitutive DHS are independent of gene expression and exist in multiple cell lines (Gross and Garrard 1988; Vyas et al. 1992), whereas inducible DHS are induced by biological factors, for example, transcription factor binding, and are likely to be tissue specific. If an annotated T-cell DHS is inducible, no difference in rate or type of substitution is expected between the adjacent DHS and Flank regions as their germ line chromatin status are expected to be equal. Using annotated DHS from somatic cells therefore reduces our power to detect an influence of these chromatin states on substitution.
Our comparison of substitution rates led us to reject the null hypothesis KDHS = KFlank, finding instead that DHS sequences evolved slower than their flanks for both intergenic and intronic regions. We identified 897 intergenic alignments for which the LR test of equivalent evolutionary rates between DHS and Flank sites was nominally significant (P < 0.05). A significant majority of these alignments were consistent with the hypothesis that DHS regions evolve slower due to lower mutation rates (i.e., KDHS < KFlank; table 1). Similar observations were also found from intronic sequences: 878 regions were nominally significantly different with 610 showing the predicted slower rate in DHS regions. The fraction of intronic alignments supporting the hypothesis was highly significant (table 1). The general substitution rate inequality of KDHS < KFlank was robust to the lengths of the DHS + Flank regions considered. Significant support for this inequality was also observed for alignments stratified into 600–2,000 bp or 2,000–4,000 bp groups (results not shown).
Table 1.
Support for Differences in Total Rate and Substitution Type Profile between DHS and Flank Regions.
| Intronic | Intergenic | |||||
| Null Hypothesis | DHS < Flank | DHS > Flank | P | DHS < Flank | DHS > Flank | P |
| KDHS = KFlank | 610 | 268 | 1 × 10—31a | 639 | 258 | 2.6 × 10—38a |
| λDHS=λFlank | 238 | 192 | 0.015 | 252 | 173 | 7.4 × 10—5a |
| CG.λDHS = CG.λFlank; | 322 | 330 | 0.64 | 346 | 283 | 0.007a |
| λDHS≠λFlank | ||||||
| λDHS=λFlank; | 225 | 189 | 0.04 | 223 | 171 | 0.005a |
| CG.λDHS≠CG.λFlank | ||||||
NOTE.—Null hypothesis: the hypothesis examined by the LR tests; DHS < Flank (DHS > Flank): the number of alignments that exhibited a nominally significant difference between DHS and Flank regions where the evolutionary parameter (K, λ, CG.λ) was lower (greater) in DHS than Flank; P: probability from the sign test of observing DHS rate less than Flank rate.
Significant at the 0.05 level after applying the sequential Bonferroni correction for multiple tests (Holm 1979).
A lower relative rate of transitions in DHS regions compared with Flanks for both intergenic and intronic sequence indicates that substitution types were also affected by chromatin status. We assessed whether chromatin status affected the substitution type by comparing support for the null hypothesis that the relative rate ratio of transition to transversions was the same between DHS and Flank (λDHS = λFlank), against the alternate that they were allowed to differ (λDHS≠λFlank). Although ignoring rate differences between the regions may underestimate the value of λ, the basic pattern of variation should still hold (Wakeley 1994). An LR of these nested hypotheses identified 425 intergenic and 430 intronic alignments that were nominally significant at the 0.05 level. A significantly lower rate of transitions in DHS than Flanks was evident for both intergenic and intronic alignments, albeit with a weaker difference for intronic regions (table 1).
The operation of purifying natural selection on functional elements within DHS sequence could also account for a reduced rate of evolution, but the results after elimination of candidate functional elements suggest that natural selection is not the dominant cause of the reduced substitution rate. As experimentally identified functional sites within DHS regions are usually short motifs, for example, transcription factor binding sites, only a small fraction of DHS sites are expected to evolve under strong purifying selection. Because we were unable to obtain experimentally validated functional elements for the majority of DHS sequence, we used a classification as “conserved” from vertebrate comparisons (Siepel et al. 2005) as an indicator of potential function. After eliminating alignments containing these conserved regions, our inference of lower total and transition substitution rates in DHS compared with their Flanks remained unchanged for intergenic sequences (see supplementary table S1, Supplementary Material online).
Mutation of Methylated CpG Does not Completely Account for Different Substitution Type Profiles between DHS and Flank Regions
As a result of the functional role of 5mC in modifying chromatin, DNA in compacted chromatin exhibits a greater density of methylated CpG dinucleotides (Shiraishi et al. 2002). The difference in both evolutionary rate and transition rate between DHS and Flank sequence could therefore result from an increased abundance of hypermutable 5mC in Flank sequence. We examined whether the rate of CpG transition substitutions was identifiably distinct from the general pattern evident for transitions as a whole using dinucleotide substitution models (Lindsay et al. 2008). The CG.λ term measures the ratio of CpG transitions to all transitions. We tested this hypothesis (CpG transitions elevated in a manner independent of the mean transition effect) by specifying the null as λDHS≠λFlank, CG.λDHS = CG.λFlank and removing the latter constraint under the alternate. Our results suggest that 5mC transitions further distinguish the Flank substitution process, but only for intergenic regions. A substantial number of intronic and intergenic alignments exhibited nominally significant differences in CG.λ between DHS and Flank (654 intronic and 642 intergenic). Consistent with the conjecture that functionally associated enrichment of 5mC in the Flank would result in an elevated CpG transition rate, a significant majority of intergenic alignments exhibited CG.λDHS < CG.λFlank (table 1). This enrichment was not evident for intronic alignments. The same result was observed from alignments without the constrained elements (see supplementary table S1, Supplementary Material online).
We further investigated whether the difference in λ between DHS and Flank was independent of CpG transitions. Here, we specified a null hypothesis that had DHS and Flank regions with different CG.λ parameters, but the transition parameter was constrained to be equal (CG.λDHS≠CG.λFlank, λDHS = λFlank). The latter constraint was relaxed in the alternate hypothesis. Both the intron and the intergenic analyses were nominally significant, but only the intergenic analysis remained significant after correcting for multiple tests (table 1). Thus, allowing CpG transitions to differ between DHS and Flank sequence did not substantively alter the tendency of λ to differ between these segments. We conclude that a change in substitution composition between DHS and Flank is most pronounced for intergenic regions and that mutation of 5mC contributes to this difference but does not entirely account for it.
We further assessed the contribution of CpG substitutions to rate differences between the regions using the ad hoc approach of eliminating alignment columns containing a CpG dinucleotide in any species. Support for KDHS < KFlank remained highly significant for both intergenic and intronic alignments with/without the annotated conserved regions (all sign test P < 10 − 19, P < 10 − 3, respectively). This result confirms that CpG substitutions are not primarily responsible for rate differences between DHS and Flank.
Substitution Processes Are Significantly Heterogeneous along Promoter Sequences
Substitution heterogeneity between DHS and Flank raised the possibility that individual nucleosomes will substantially affect the underlying mutation process. DHS are held to be largely nucleosome free or to consist of delocalized nucleosomes. Differences in substitution between DHS and Flank thus putatively arise from distinct nucleosome organization between open and closed chromatin structure. If nucleosomes were consistently located on a genomic segment in the germ line since the divergence of the sampled primate species, a corresponding effect on the substitution process should be evident. We tested this hypothesis by comparison of evolutionary parameters between annotated nucleosome and adjacent linker sites.
We assessed whether there was evidence for a spatial distribution of substitution processes using a phylo-HMM (Siepel and Haussler 2004). Phylo-HMMs allow for LR tests of nested hypotheses, but the PyCogent implementation (Knight et al. 2007) assumes that sequence composition is homogeneous across the alignment, an assumption clearly violated for promoter sequences that include CpG islands. To test for the existence of spatial clustering of substitutions, we defined the null hypothesis as a standard rate heterogeneity model: Γ-distributed substitution rate heterogeneity with two equiprobable rate classes (slow and fast, see Methods) with sites evolving independently. The alternate hypothesis allowed a site's rate class to be influenced by that of its immediate neighbor. An LR from application of these two models to the individual promoter alignments identified 505 of 1,849 as nominally significant (P < 0.05), 37 of which were significant after correcting for multiple tests (Holm 1979). This analysis indicates that rate heterogeneity exists for many of the promoters, subject to the caveat that existence of spatial variation in sequence composition was not addressed by the phylo-HMM.
The Spatial Substitution Rate Distribution and Nucleosome Score Were Significantly Correlated for Some Loci
Phylogenetic footprinting (hereafter footprinting) was used to assess the spatial distribution of substitutions rather than phylo-HMMs because of the potential sensitivity of the latter to violation of the assumption of spatially homogeneous sequence composition. The footprinting approach has the advantage of assuming compositional homogeneity over a smaller spatial scale, making violation of the assumption less likely. Furthermore, it does not require prior specification of the frequency of fast/slow sites as per the phylo-HMM. We note here that the spatial distribution of K was typically highly correlated with the posterior probabilities classifying a site as “fast” from the phylo-HMM (fig. 1). For loci where the phylo-HMM analysis indicated nominally significant support for clustered substitutions, ∼44% showed strong correlations (ρ > 0.5) between the spatial distribution of K and pfast.
FIG. 1.

Comparison of the substitution signal estimated using phylogenetic footprinting and a phylo-HMM. Shown in the top row of panels is substitution rate variation from footprinting, measured as the sum of tree branch lengths (K), from the genes CDX2 and FGF5. The lower panel row shows the posterior probabilities a site was classified as fast (pfast), estimated from the phylo-HMM. Each horizontal line indicates a nucleosome inferred from one of seven cell lines where magenta represents one of the four cancer cell lines of A375, T47D, MCF7, and MALME; green represents IMR90 cell line; cyan represents PM cell line; and yellow represents the MEC cell line (Ozsolak et al. 2007).  is the estimated Pearson's correlation coefficient of the footprinting and phylo-HMM signals.
To evaluate whether a relationship exists between rate heterogeneity and nucleosome placement, we compared the measured substitution rates with the nucleosome score. For a promoter, we compared the nucleosome score distribution determined from a Chip-seq experiment on T-cells (Schones et al. 2008) with the estimate of K from footprinting. A bootstrap procedure revealed that of the 1,793 loci for which nucleosome data were available, 125 were nominally significant (P < 0.05) and of these five were significant after correcting for multiple tests (supplementary table S2, Supplementary Material online). The statistics for the two most positively correlated loci are shown in fig. 2.
FIG. 2.

Comparison of the spatial substitution signal with nucleosome score. Example genes exhibiting a positive correlation are shown in the left column, a negative correlation in the right column. x axis is the alignment position; y axis black label is the nucleosome score (Schones et al. 2008) with data shown as a blue histogram; y axis red label is the estimate of K from footprinting with data shown as the red line. Black, orange, and blue horizontal lines with diamond marks at the end represent CpG islands, DHS sites, and repeat sequences, respectively.
An excess of loci exhibited a negative correlation between nucleosome scores and K, indicative of out-of-phase signals. A quantile-quantile plot of the distribution of the probabilities from the bootstrap test against the quantiles from the uniform distribution showed departures at both ends of the distribution, but predominantly indicating an excess of  (Supplementary fig. S1, Supplementary Material online). There were numerous such nominally significant loci (276 with P > 0.95), 15 of which were significant after correcting for multiple tests (supplementary table S2, Supplementary Material online). The two most negatively correlated loci are shown in fig. 2. Loci with negatively correlated K and nucleosome score suggest that signal oscillations exist in both metrics but that they are out of phase. An assessment of the potential causes of the negative correlation indicated that, in some cases, nucleosome scores were missing or very low for specific sequence classes such as repeated elements (e.g., see PRELP panel, fig. 2), CpG islands, and DHS sites. The impact of repeat sequences on the nucleosome score likely arises from masking of sequences that match repetitive elements. For DHS sites, recall that only mutations arising in germ line chromatin are detectable by evolutionary analyses and that some DHS regions are likely to be tissue specific. Consequently, regions annotated as DHS from assessment of somatic cell types may not be so in the germ line and the substitution process will be discordant with the annotation.
In this section, we identified loci that exhibited the predicted significant positive correlation. The modest number of positively correlated loci raised questions about the generality of the relationship between rate heterogeneity and individual nucleosomes. This is not unexpected given the sensitivity of experimental techniques to repeat sequences and that nucleosomes from a somatic cell type may not accurately represent the location of nucleosomes in germ line cells. We therefore address in the next section whether an alternative approach that does not depend on knowing the coordinates of individual nucleosomes can establish the generality of the effect of nucleosomes on the substitution processes.
A ∼200-bp Oscillation in Both Substitution Rate and Nucleosome Score
The consistent sequence span associated with nucleosomes suggests that they will occur at regular intervals across the genome, giving rise to a measurable periodicity in nucleosome placement. The evidence reported above for the influence of chromatin status on substitution processes therefore suggests that a periodicity of the size of nucleosome plus linker, within the range of 157–227 bp, should be evident in the spatial substitution signal.
We use signal processing techniques to estimate the characteristic period in K and nucleosome score. The DFT is a projection of the signal of interest (e.g., K) onto a set of orthogonal (complex) sinusoidal basis functions, linearly spaced in frequency (the inverse of period). Here, the period of interest is measured in nucleotides. For a given frequency, the norm of the projection onto the corresponding basis function, referred to as the amplitude spectrum, is conventionally taken as an estimate of signal power. By examining amplitude across all frequencies of the amplitude spectrum, the relative strengths of constituent frequencies of the signal can be assessed. If a single peak dominates the amplitude spectrum, then the signal can be said to be dominated by a single periodic component at the frequency corresponding to the peak. On the other hand, if the main peak is only slightly greater than other peaks in the spectrum, then no frequency component is dominant. Establishing whether a signal has a dominant period hinges on the SNR, which describes the extent to which the largest amplitude frequency component is larger than other components within the signal. The variance of frequency estimate depends on the SNR (see eq. 4). However, because we are interested in period, rather than frequency, estimation there is one further aspect for consideration: For a given signal length, longer period estimates are more difficult to resolve than shorter ones. That is, two peaks in the amplitude spectrum at adjacent periods 100 and 101 are more likely to “blur” into a single peak than two adjacent peaks at 10 and 11, for example. This effect is captured in the lower bound for the variance of the maximum likelihood frequency (period) estimate, known as the CRB, presented in detail in Methods. The CRB can thus be employed to compare the confidence we have in period estimates for two different signals. Smaller values of CRB (variance in the estimate) will result from signals with higher SNRs and/or shorter periods.
We illustrate the factors that affect the estimation of periods with analysis of two loci, DUSP and FZD2 (fig. 3). For our analyses of amplitude spectra, we specified a CRB cutoff of 0.2, excluding estimated periods with a greater CRB. After applying the cutoff, the periods with the greatest and penultimate powers were selected as the main and secondary periods, respectively. (We illustrate the effect of other CRB cutoffs in Supplementary fig. S2, Supplementary Material online.) For FZD2, the largest peak from the DFT had a period of 700 bp with CRB of 0.649. This peak likely derives from the large amplitude peak of K spanning alignment positions ∼700–1000 bp and the peak spanning positions ∼100–300 bp. As one would expect from an alignment of 1,400 bp, where a period of 700 can be measured from only two peaks, the 700-bp period has high CRB and thus the uncertainty in this period estimate is high. The two peaks with the next highest power correspond to periods of 233 and 175 bp, respectively, both of which exhibit a CRB < 0.07. These peaks were then selected as the main and secondary periods, respectively, for FZD2. For the DUSP promoter spectrum, only a single period had CRB < 0.2, the dominant peak at ∼200 bp, so this was selected as the main period.
FIG. 3.

Signal analysis of substitution amplitude spectra from DUSP and FZD2 promoters. The plot columns correspond to the indicated loci. The upper plot row shows K, whereas the lower row its DFT-based amplitude spectrum. Periods of the footprinting signal appear as peaks of the amplitude spectrum. The first, second, and third highest peaks are annotated with a corresponding number of +, and their period lengths, and CRB are shown in the tables.
Analyses across 1,849 promoter regions indicate that evolutionary rates exhibit a dominant period of ∼200 bp across all promoters. Using promoters for which nucleosome scores were also available, we evaluated the main and secondary periods from both the experimental data and our evolutionary analysis of the same promoters. The periodicity in K and nucleosome score were in agreement—the 200-bp period bin (which spanned periods from 175 to 225 bp) was the mode of all distributions (fig. 4). Changing the CRB used to define main and primary periods did not substantively affect the consistency between the periods inferred from the experimental estimate of nucleosome position and the estimate of evolutionary rate (see supplementary fig. S2, Supplementary Material online). Overall, the results indicate that the periodicity estimated from the raw nucleosome positioning signal from the high-throughput sequencing data and that from our evolutionary analyses agree in the existence of a periodicity along DNA sequences, consistent with the spatial oscillation of K arising from nucleosome placements.
FIG. 4.

Evolutionary distance and raw nucleosome score exhibit a ∼200-bp period in primate promoters. Frequency histograms of the periods classified as main (upper row) and secondary (lower row) after eliminating periods with a CRB > 0.2. The left and right columns show the periods from the substitution spectra (K) and the nucleosome score (Schones et al. 2008), respectively.
Discussion
Our analyses support a substantial contribution from chromatin status to local variation in substitution rate, both in terms of rate and type of substitution. At the relatively coarse level of DHS and Flank, differences in total substitution rate were evident that were largely consistent between intronic and intergenic sequence regions. Flank sites also exhibited an elevation of transitions that was not entirely accounted for by CpG transitions, and the disparity with the DHS profile differed in magnitude between intergenic and intronic regions. These differences were evident even after eliminating putatively constrained DHS functional elements. An influence at the finer scale of individual nucleosomes was also evident. The spatial distribution of substitution rate and estimates of nucleosome locations from Chip-seq experiments were shown to both oscillate with an ∼200 bp frequency. For a number of gene promoters, highly significant positive correlations between these two independent measurements were evident. We argue that these results are most consistent with the predicted influence from differences in mutation rate, due most likely to repair differences.
The evolutionary dynamics of DHS and Flank regions were distinguished in both the totality and the type of substitutions, consistent with differences in DNA repair. For vertebrate genomes, changes in chromatin status are typically accompanied by altered density of the modified base 5mC. Given this association and the hypermutability of 5mC, we assessed whether changes in substitution type were due to confounding with 5mC processes. Our results demonstrated that for both intergenic and intronic regions, the increase in the common transition rate term (λ) was not entirely accounted for by transitions within CpG dinucleotides (table 1). We further note that although λ was significantly different for both intronic and intergenic regions, CpG transitions (CG.λ) were only significantly different for intergenic regions.
Differences between intronic and intergenic sequences are consistent with an effect of chromatin status on mutagenesis. The evolution of intronic regions are likely affected by the operation of transcription coupled DNA repair (Bohr et al. 1985; Green et al. 2003). Both the nucleotide and the base excision repair pathways are involved as subpathways of transcription coupled repair (TCR) and these repair systems target by-products of cellular metabolism such as deamination of cytosine (for review, see Hoeijmakers 2001). The tendency for expressed genes to have open chromatin and a low nucleosome density further distinguishes intronic and intergenic regions from each other. For genes expressed in the germ line, greater chromatin openness along with the additional scrutiny of DNA lesions by TCR seems likely to homogenize the signal in genic sequence. Differences in mutation may also contribute, however, as the association between chromatin openness and 5mC incidence means a reduced rate of lesion formation. This can also account for absence of a significant difference between DHS and Flank for CG.λ in introns (table 1).
Substitution rate differences between DHS and Flank are unlikely to be accounted for by processes putatively responsible for substitution differences between larger genomic regions. A positive correlation between GC% and substitution rate has been reported for larger genomic regions (for review, see Eyre-Walker and Hurst 2001). This relationship may originate from the association of biased repair of DNA mismatches (Brown and Jiricny 1988) with gene conversion and the mutagenicity of recombination (Eyre-Walker 1993; Filatov and Gerrard 2003). We assessed whether the association between GC% and substitution rate could account for our results by identifying loci where DHS GC% was significantly higher than Flank. If rate differences between DHS and Flank originated from the same mechanism as that purportedly responsible for larger scale genomic features, then KDHS > KFlank is expected. Instead, highly significant support for the opposite pattern was observed (intergenic 141/242, P≈0.006; intronic 166/297, P≈0.024), consistent with the broader phenomenon described in table 1.
Natural selection does not appear a strong candidate for differences in evolutionary dynamics between DHS and Flank. Two studies of the influence of nucleosome localization on evolution of yeast protein-coding genes came to conflicting conclusions, with one arguing a mutagenic (Washietl et al. 2008), the other selective (Warnecke et al. 2008), origin for the differences in rate heterogeneity. One challenge facing analysis of protein-coding sequences is the influence of natural selection on protein-coding content, particularly the tendency for spatial patterning of natural selection along a gene (e.g., Knight et al. 2007). In contrast to the estimate of over half the yeast genome being under the scrutiny of purifying natural selection, the proportion for vertebrate genomes is likely much smaller (∼3–8%) suggesting that the sampled intronic and intergenic regions will be evolving in a predominantly neutral manner (Siepel et al. 2005). On the basis of the small fraction of purifying sites alone, a role for selection in vertebrates seems less likely. Experimentally demonstrated regulatory elements are usually short protein-binding motifs. Besides purifying selection, regulatory elements exhibit such a high turnover rate that ∼50% of functional elements are unconstrained (Birney et al. 2007; Margulies et al. 2007). Our results from alignments without constrained elements further suggest that purifying selection is an unlikely cause of substitution rate heterogeneity between DHS and Flank. Moreover, we are unaware of any functional mechanism operating in non–protein-coding sequences that preferentially suppresses transition mutations. A mutagenic origin hypothesis, however, clearly postulates effects on the types of substitution, both those from 5mC and otherwise, that are supported by the results. This hypothesis also predicts a difference between intergenic and intronic regions that is qualitatively supported by our analyses. Invoking the influence of natural selection to explain the prevalence of loci with KDHS < KFlank thus seems unnecessary.
A role for natural selection in the cases where KDHS > KFlank cannot be ruled out. The operation of purifying selection on sequence positions that stabilize the association of DNA with nucleosomes could contribute to a reduced substitution rate in closed chromatin (Flank) regions. Current understanding of the nature of positioning signals implicates the occurrence of specific dinucleotides at ∼10-bp intervals as functionally important (e.g., Segal et al. 2006), suggesting the possibility that these positions may be subjected to purifying selection. Analyses of yeast did not detect a 10-bp period in substitution processes, instead revealing a smooth increase in rate from the nucleosome edge to the nucleosome center, irrespective of whether the nucleosome sequences were collected from strong positioning signals or not (Washietl et al. 2008). Another possibility is that many regulatory elements appear subjected to high levels of turnover (Dermitzakis and Clark 2002; Birney et al. 2007; Margulies et al. 2007). Given the enrichment of regulatory elements in DHS regions, an abundance of rapidly evolving functional elements may contribute to KDHS > KFlank. The relative contribution of these two alternatives to distinguishing the evolution of DHS and Flank remains an open question.
Significant positive correlations between nucleosome and evolutionary rate were evident for a number of loci, but the abundance of negatively correlated loci illustrates the challenges to understanding the influence of chromatin status on evolution in multicellular eukaryotes. After correction for multiple tests, a number of promoters exhibited significant positive correlations between the footprinting estimated distribution of K and nucleosome score estimated from T-cells. Three-fold more promoters, however, showed a significant negative correlation between these metrics. Many factors, including both biological activities and methodology artifacts, can impact on the accuracy of each of the statistics. Methodological issues affecting estimation of nucleosome scores include the challenge of correctly mapping short sequence reads that correspond to repeated and/or low-complexity sequences. This difficulty translates into underestimated density of nucleosomes for these sequence classes. The footprinting approach is not affected by the repeat sequence class but is affected by low-complexity sequence including CpG islands which, by being enriched for G + C nucleotide, make multiple sequence alignment difficult, potentially leading to underestimation of evolutionary divergence. For the current data, this appeared not to be a problem for the relatively closely related primate species examined here as oscillations in K were evident within CpG islands (fig. 2). By defining K as the sum of all branch lengths, the statistic will be affected by variation in chromatin status between the primate species. Perhaps, the most critical confounding factor is biological—the complexity arising from multicellularity with the existence of distinct soma and germ line cell lineages. Although experimental evidence supports the conserved localization of nucleosomes between even quite diverged biological lineages (Wilson et al. 2008), heritable mutations are restricted to those from germ line cell types; yet the nucleosome scores used here were derived from T-cells, a somatic cell type. Given cell type differences arise from changes in chromatin status, weak positive correlation between K and nucleosome scores derived from somatic tissue is not unexpected. An additional likely contributor to noise in the relationship between chromatin status and substitution processes is different chromatin states between male and female germ line cells.
Our prediction that the discrete length of DNA associated with nucleosomes would result in a ∼200-bp oscillation was borne out for both K and nucleosome score. We extended our assessment of the role of chromatin status in localized fluctuations of K by assessing the general prediction that the characteristic length of DNA sequence associated with nucleosomes would cause an oscillating signal. This approach has the advantage of not requiring direct estimation of nucleosome coordinates in the primate germ line, but the disadvantage of indirectly assessing the role of nucleosomes in the spatial distributions of K. As the exact separation between nucleosomes is variable, we compared the distributions of primary and secondary periods inferred using the DFT from both K and nucleosome score from matching promoters. Both K and the nucleosome score exhibited signal oscillation, and the modes of the two independent metrics were substantively concordant in their dominant periods (fig. 4). This correspondence was robust to choice of maximum variance in period estimate (Supplementary fig. S2, Supplementary Material online).
Together, the results indicate that a substantial proportion of variation in localized fluctuations in evolutionary rate arise from chromatin structure and that germ line chromatin status has an important influence on both the rate and the nature of mutagenesis within the primate genome. For the promoters exhibiting the strongest positive correlation, the square of the correlation coefficients (supplementary table S2, Supplementary Material online) suggest that variation in the nucleosome score can account for ∼50% of the variance in K. Given the different chromatin status between cell types, this is likely an underestimate. Together with the abundant evidence for the dominant contribution of 5mC mutation to genetic variation, our results suggest that epigenetic modifications more generally exert a profound influence on the distribution of variation in primates.
Supplementary Material
Supplementary tables S1, S2 and Supplementary figures S1, S2 are available at Molecular Biology and Evolution online (http://www.mbe.oxfordjournals.org/).
Supplementary Material
Acknowledgments
This project was supported by funding provided to G.A.H. by the Australian Research Council and the National Health and Medical Research Council; J.E., H.Y., and G.A.H. by a University of New South Wales Faculty of Engineering Early Career Research Grant for genomic signal processing, 2009; and R.W. by a National Health and Medical Research Council Peter Doherty Fellowship (307715).
Author contributions: G.A.H. conceived research; G.A.H. and H.Y. designed research with input from J.E. and R.W.; H.Y., G.A.H., and J.E. performed research; all authors analyzed the data; G.A.H., H.Y., and J.E. wrote the paper.
References
- Anastassiou D. Genomic signal processing. IEEE Signal Process Mag. 2001;18(4):8–20. [Google Scholar]
- Balhorn R, Weston S, Thomas C, Wyrobek AJ. DNA packaging in mouse spermatids. Synthesis of protamine variants and four transition proteins. Exp Cell Res. 1984;150(2):298–308. doi: 10.1016/0014-4827(84)90572-x. [DOI] [PubMed] [Google Scholar]
- Birney E, Stamatoyannopoulos JA, Dutta A, et al. 310 co-authors. Identification and analysis of functional elements in 1% of the human genome by the ENCODE pilot project. Nature. 2007;447(7146):799–816. doi: 10.1038/nature05874. [DOI] [PMC free article] [PubMed] [Google Scholar]
- Bohr VA, Smith CA, Okumoto DS, Hanawalt PC. DNA repair in an active gene: removal of pyrimidine dimers from the DHFR gene of CHO cells is much more efficient than in the genome overall. Cell. 1985;40(2):359–369. doi: 10.1016/0092-8674(85)90150-3. [DOI] [PubMed] [Google Scholar]
- Boulikas T. Evolutionary consequences of nonrandom damage and repair of chromatin domains. J Mol Evol. 1992;35(2):156–180. doi: 10.1007/BF00183227. [DOI] [PubMed] [Google Scholar]
- Boyle AP, Davis S, Shulha HP, Meltzer P, Margulies EH, Weng Z, Furey TS, Crawford GE. High-resolution mapping and characterization of open chromatin across the genome. Cell. 2008;132(2):311–322. doi: 10.1016/j.cell.2007.12.014. [DOI] [PMC free article] [PubMed] [Google Scholar]
- Brown TC, Jiricny J. Different base/base mispairs are corrected with different efficiencies and specificities in monkey kidney cells. Cell. 1988;54:705–711. doi: 10.1016/s0092-8674(88)80015-1. [DOI] [PubMed] [Google Scholar]
- Cheng KC, Cahill DS, Kasai H, Nishimura S, Loeb LA. 8-Hydroxyguanine, an abundant form of oxidative DNA damage, causes G-T and A-C substitutions. J Biol Chem. 1992;267(1):166–172. [PubMed] [Google Scholar]
- Cooper DN, Youssoufian H. The CpG dinucleotide and human genetic disease. Hum Genet. 1988;78(2):151–155. doi: 10.1007/BF00278187. [DOI] [PubMed] [Google Scholar]
- Dermitzakis ET, Clark AG. Evolution of transcription factor binding sites in mammalian gene regulatory regions: conservation and turnover. Mol Biol Evol. 2002;19(7):1114–1121. doi: 10.1093/oxfordjournals.molbev.a004169. [DOI] [PubMed] [Google Scholar]
- Elgin SC. DNAase I-hypersensitive sites of chromatin. Cell. 1981;27(3 Pt 2):413–415. doi: 10.1016/0092-8674(81)90381-0. [DOI] [PubMed] [Google Scholar]
- Eyre-Walker A. Recombination and mammalian genome evolution. Proc Biol Sci. 1993;252(1335):237–243. doi: 10.1098/rspb.1993.0071. [DOI] [PubMed] [Google Scholar]
- Eyre-Walker A, Hurst LD. The evolution of isochores. Nat Rev Genet. 2001;2(7):549–555. doi: 10.1038/35080577. [DOI] [PubMed] [Google Scholar]
- Felsenstein J. Sunderland. Sinauer Associates; 2003. Inferring phylogenies. (MA) [Google Scholar]
- Filatov DA, Gerrard DT. High mutation rates in human and ape pseudoautosomal genes. Gene. 2003;317(1–2):67–77. doi: 10.1016/s0378-1119(03)00697-8. [DOI] [PubMed] [Google Scholar]
- Green P, Ewing B, Miller W, Thomas PJ, Green ED. Transcription-associated mutational asymmetry in mammalian evolution. Nat Genet. 2003;33(4):514–517. doi: 10.1038/ng1103. [DOI] [PubMed] [Google Scholar]
- Gross DS, Garrard WT. Nuclease hypersensitive sites in chromatin. Annu Rev Biochem. 1988;57:159–197. doi: 10.1146/annurev.bi.57.070188.001111. [DOI] [PubMed] [Google Scholar]
- Hasegawa M, Kishino H, Yano T. Dating of the human-ape splitting by a molecular clock of mitochondrial DNA. J Mol Evol. 1985;22(2):160–174. doi: 10.1007/BF02101694. [DOI] [PubMed] [Google Scholar]
- Hoeijmakers JH. Genome maintenance mechanisms for preventing cancer. Nature. 2001;411(6835):366–374. doi: 10.1038/35077232. [DOI] [PubMed] [Google Scholar]
- Holm S. A simple sequentially rejective multiple test procedure. Scand J Stat. 1979;6(2):65–70. [Google Scholar]
- Hubbard TJP, Aken BL, Ayling S, et al. 51 co-authors. Nucleic Acids Res. 2009;37(Database issue):D690–D697. doi: 10.1093/nar/gkn828. Ensembl 2009. [DOI] [PMC free article] [PubMed] [Google Scholar]
- Jakobovits EB, Bratosin S, Aloni Y. A nucleosome-free region in SV40 minichromosomes. Nature. 1980;285(5762):263–265. doi: 10.1038/285263a0. [DOI] [PubMed] [Google Scholar]
- Karolchik D, Hinrichs AS, Kent WJ. Current protocols in bioinformatics. New York: John Wiley & Sons, Inc; 2007. The UCSC Genome Browser. Chapter 1, Unit 1.4. [DOI] [PubMed] [Google Scholar]
- Knight R, Maxwell P, Birmingham A, et al. 20 co-authors. PyCogent: a toolkit for making sense from sequence. Genome Biol. 2007;8(8):R171. doi: 10.1186/gb-2007-8-8-r171. [DOI] [PMC free article] [PubMed] [Google Scholar]
- Kunsch H. The jackknife and the bootstrap for general stationary observations. Ann Stat. 1989;17:1217–1241. [Google Scholar]
- Lindsay H, Yap VB, Ying H, Huttley GA. Pitfalls of the most commonly used models of context dependent substitution. Biol Direct. 2008;3:52. doi: 10.1186/1745-6150-3-52. [DOI] [PMC free article] [PubMed] [Google Scholar]
- Luger K, Mäder AW, Richmond RK, Sargent DF, Richmond TJ. Crystal structure of the nucleosome core particle at 2.8 A resolution. Nature. 1997;389(6648):251–260. doi: 10.1038/38444. [DOI] [PubMed] [Google Scholar]
- Margulies EH, Cooper GM, Asimenos G, et al. 76 co-authors. Analyses of deep mammalian sequence alignments and constraint predictions for 1% of the human genome. Genome Res. 2007;17(6):760–774. doi: 10.1101/gr.6034307. [DOI] [PMC free article] [PubMed] [Google Scholar]
- McGhee JD, Felsenfeld G. Nucleosome structure. Annu Rev Biochem. 1980;49:1115–1156. doi: 10.1146/annurev.bi.49.070180.005343. [DOI] [PubMed] [Google Scholar]
- Mitchell-Olds T, James RV, Palmer MJ, Williams PH. Genetics of Brassica rapa (syn. campestris). 2. Multiple disease resistance to three fungal pathogens: Peronospora parasitica, Albugo candida and Leptosphaeria maculans. Heredity. 1995;75(Pt 4):362–369. doi: 10.1038/hdy.1995.147. [DOI] [PubMed] [Google Scholar]
- Ozsolak F, Song JS, Liu XS, Fisher DE. High-throughput mapping of the chromatin structure of human promoters. Nat Biotechnol. 2007;25(2):244–248. doi: 10.1038/nbt1279. [DOI] [PubMed] [Google Scholar]
- Prendergast JGD, Campbell H, Gilbert N, Dunlop MG, Bickmore WA, Semple CAM. Chromatin structure and evolution in the human genome. BMC Evol Biol. 2007;7:72. doi: 10.1186/1471-2148-7-72. [DOI] [PMC free article] [PubMed] [Google Scholar]
- Schones DE, Cui K, Cuddapah S, Roh TY, Barski A, Wang Z, Wei G, Zhao K. Dynamic regulation of nucleosome positioning in the human genome. Cell. 2008;132(5):887–898. doi: 10.1016/j.cell.2008.02.022. [DOI] [PMC free article] [PubMed] [Google Scholar]
- Segal E, Fondufe-Mittendorf Y, Chen L, Thastrom A, Field Y, Moore IK, Wang JZ, Widom J. A genomic code for nucleosome positioning. Nature. 2006;442(7104):772–778. doi: 10.1038/nature04979. [DOI] [PMC free article] [PubMed] [Google Scholar]
- Shimada N, Matsudo H, Osano K, Arakawa H, Buerstedde JM, Matsumoto Y, Chayahara K, Torihata A, Ono M. Activation of the chicken Ig-beta locus by the collaboration of scattered regulatory regions through changes in chromatin structure. Nucleic Acids Res. 2006;34(13):3794–3802. doi: 10.1093/nar/gkl469. [DOI] [PMC free article] [PubMed] [Google Scholar]
- Shiraishi M, Oates AJ, Sekiya T. An overview of the analysis of DNA methylation in mammalian genomes. Biol Chem. 2002;383(6):893–906. doi: 10.1515/BC.2002.096. [DOI] [PubMed] [Google Scholar]
- Siepel A, Bejerano G, Pedersen JS, et al. 15 co-authors. Evolutionarily conserved elements in vertebrate, insect, worm, and yeast genomes. Genome Res. 2005;15(8):1034–1050. doi: 10.1101/gr.3715005. [DOI] [PMC free article] [PubMed] [Google Scholar]
- Siepel A, Haussler D. Combining phylogenetic and hidden Markov models in biosequence analysis. J Comput Biol. 2004;11(2–3):413–428. doi: 10.1089/1066527041410472. [DOI] [PubMed] [Google Scholar]
- Sinha NK, Haimes MD. Molecular mechanisms of substitution mutagenesis. An experimental test of the Watson-Crick and Topal-Fresco models of base mispairings. J Biol Chem. 1981;256(20):10671–10683. [PubMed] [Google Scholar]
- Steger DJ, Workman JL. Stable co-occupancy of transcription factors and histones at the HIV-1 enhancer. EMBO J. 1997;16(9):2463–2472. doi: 10.1093/emboj/16.9.2463. [DOI] [PMC free article] [PubMed] [Google Scholar]
- Suter B, Thoma F. DNA-repair by photolyase reveals dynamic properties of nucleosome positioning in vivo. J Mol Biol. 2002;319(2):395–406. doi: 10.1016/S0022-2836(02)00291-7. [DOI] [PubMed] [Google Scholar]
- Topal MD, Fresco JR. Complementary base pairing and the origin of substitution mutations. Nature. 1976;263(5575):285–289. doi: 10.1038/263285a0. [DOI] [PubMed] [Google Scholar]
- Tretter SA. Estimating the frequency of a noisy sinusoid by linear regression. IEEE Trans Inf Theory. 1985;31(6):832–835. [Google Scholar]
- Vyas P, Vickers MA, Simmons DL, Ayyub H, Craddock CF, Higgs DR. Cis-acting sequences regulating expression of the human alpha-globin cluster lie within constitutively open chromatin. Cell. 1992;69(5):781–793. doi: 10.1016/0092-8674(92)90290-s. [DOI] [PubMed] [Google Scholar]
- Wakefield M, Maxwell P, Huttley G. maximum likelihood phylogenetic footprinting. BMC Bioinformatics. 2005;6(1):130. doi: 10.1186/1471-2105-6-130. Vestige. [DOI] [PMC free article] [PubMed] [Google Scholar]
- Wakeley J. Substitution-rate variation among sites and the estimation of transition bias. Mol Biol Evol. 1994;11(3):436–442. doi: 10.1093/oxfordjournals.molbev.a040124. [DOI] [PubMed] [Google Scholar]
- Warnecke T, Batada NN, Hurst LD. The impact of the nucleosome code on protein-coding sequence evolution in yeast. PLoS Genet. 2008 doi: 10.1371/journal.pgen.1000250. 4(11):e1000250. [DOI] [PMC free article] [PubMed] [Google Scholar]
- Washietl S, Machne R, Goldman N. Evolutionary footprints of nucleosome positions in yeast. Trends Genet. 2008;24:583–587. doi: 10.1016/j.tig.2008.09.003. [DOI] [PubMed] [Google Scholar]
- Watson JD, Crick FH. Genetical implications of the structure of deoxyribonucleic acid. Nature. 1953;171(4361):964–967. doi: 10.1038/171964b0. [DOI] [PubMed] [Google Scholar]
- Wilson MD, Barbosa-Morais NL, Schmidt D, Conboy CM, Vanes L, Tybulewicz VLJ, Fisher EMC, Tavaré S, Odom DT. Species-specific transcription in mice carrying human chromosome 21. Science. 2008;322(5900):434–438. doi: 10.1126/science.1160930. [DOI] [PMC free article] [PubMed] [Google Scholar]
Associated Data
This section collects any data citations, data availability statements, or supplementary materials included in this article.