Abstract
A rapid and sensitive method was developed and validated using a liquid chromatographic method with tandem mass spectrometry detection (LC/MS/MS) for determination of veliparib (ABT-888) in plasma, bone marrow supernatant, and bone marrow cells. Sample preparation involved a single protein precipitation step by the addition of the sample with acetonitrile. Separation of veliparib and the internal standard, A620223.69, was achieved on a Atlantis™ dC18 column (100 × 2.1 mm, 3 μm) column using a mobile phase consisting of acetonitrile-ammonium acetate (2 mM) containing formic acid (0.1 %, v/v) using isocratic flow at 0.2 mL/min for 3 minutes. The analyte and internal standard were monitored by tandem-mass spectrometry with electrospray positive ionization. Linear calibration curves were generated over the range of 5 to 1000 nM. The values for both within day and between day precision and accuracy were well within the generally accepted criteria for analytical methods. This method was subsequently used to measure concentrations of veliparib in cancer patients receiving an oral daily dose of 10 mg with demonstration of drug accumulation in the marrow compartment and in the target leukemia bone marrow cells.
Keywords: ABT-888, PARP inhibitor, LC/MS/MS, Pharmacokinetics, veliparib
1. INTRODUCTION
Poly(ADP-ribose) polymerase 1 (PARP-1) is the most active member of a family of 19 DNA repair enzymes that are involved in replication, transcription, differentiation, and the overall preservation of the cellular genome [1, 2]. Evidence that inhibition of PARP-1 can sensitize tumor cells toward agents that cause DNA damage has lead to the rational design and development of agents that selectively target this enzyme [1, 3]. Increased levels of PARP found in cancer cells when compared to normal cells has been linked to both drug resistance and overall cellular survival in the face of genotoxic stress [4].
Veliparib (ABT-888), 2-[(2R)-2-Methylpyrrolidin-2-yl]-1H-benzimidazole-4-carboxamide (Figure 1), is an orally active PARP-1 and PARP-2 inhibitor that has been shown to potentiate the action of cisplatin, carboplatin, temozolomide, cyclophosphamide, and radiation treatment [5]. In preclinical lung cancer models, veliparib in combination with standard radiation therapy resulted in both delayed tumor growth and tumor cell apoptosis, leading to enhanced survival [6]. In animals, veliparib has an oral bioavailability of 56–92% and crosses the blood-brain barrier [5]. Veliparib undergoes minimal oxidative metabolism (<5% turnover) and is excreted predominantly in urine as the intact parent compound (~50%) and an inactive lactone metabolite, M8 (15%) [7]. In a phase 0 clinical study, veliparib target concentrations were achieved with inhibition of PARP in tumor tissues and peripheral blood mononuclear cells [8].
Figure 1.
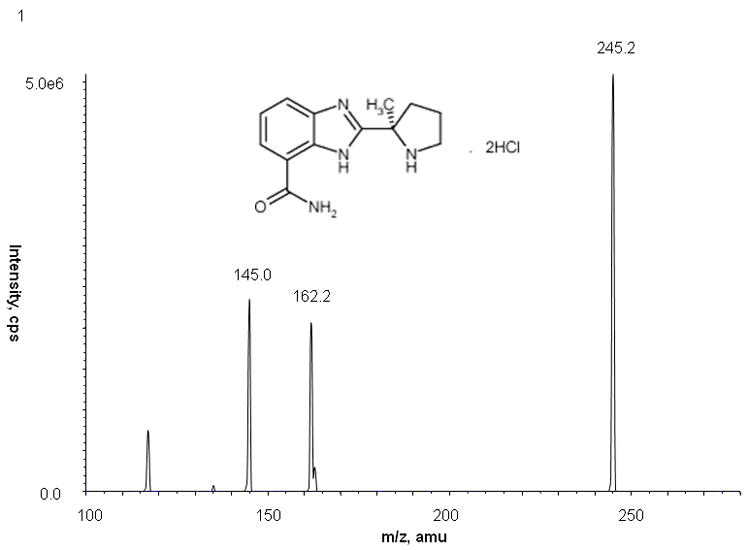
Full-scan product ion spectrum and chemical structure of veliparib with monitoring at m/z 245.2 → 162.2
Veliparib is currently being evaluated in multiple clinical trials including one in patients with relapsed and refractory acute leukemias or high-risk myelodyplasias and myeloproliferative disorders in combination therapy with topotecan and carboplatin. To comprehensively characterize the clinical pharmacokinetic (PK) profile of this drug, and to explore the relationship with pharmacodynamic (PD) effects, a specific, reproducible and accurate method for the quantitation of veliparib was necessary. Additionally, the assay was developed to explore whether veliparib penetrated into the bone marrow supernatant and cells. Several previous analytical methods have been described [9–11] but are insufficient for our needs. One LC/MS/MS method was in non-human primate plasma and cerebrospinal fluid and quantitated veliparib from 4 to 5000 ng/mL (16 to 205003 nM) using an unknown sample volume [9]. An HPLC with ultraviolet method with mass spectrum confirmation was utilized to monitoring human plasma and urine concentrations in the phase 0 clinical study [10, 12]. The analytical range was 100–5000 nM for plasma using a 0.1 mL aliquot and 1000–25000 nM for urine using an 1 mL aliquot [10]. A previously published LC/MS method quantitated veliparib from 10 to 1000 ng/mL (40.9 to 4093 nM) only in human plasma using a 0.2 mL aliquot with a run time of 25 minutes[11]. Here, we describe a more rapid, sensitive analytical method for the determination of veliparib concentrations in human plasma, bone marrow supernatant and bone marrow cells based on LC/MS/MS with electrospray positive ionization after a single protein precipitation with acetonitrile.
2. EXPERIMENTAL
2.1 Chemicals and reagents
Veliparib (Lot number 1357661–0, 99.9% pure by HPLC) and the internal standard, A620223.69 (Lot number 151120PPOORS, 99.9% pure by HPLC) were provided by Abbott Laboratories (Abbott Park, IL, USA) via the Developmental Therapeutics Program, Cancer Therapy Evaluation Program, National Institute of Health (Bethesda, MD, USA). Ammonium acetate was obtained from J.T. Baker (Philipsburg, NJ. USA). Formic acid (98%, v/v in water), methanol (HPLC grade) and acetonitrile (HPLC grade) were obtained from EM Science (Gibbstown, NJ, USA). Deionized water was obtained from a Milli-Q-UF system (Millipore, Milford, MA, USA) and used throughout, in all aqueous solutions. Drug-free (blank) human plasma was obtained from Strough (formerly Plasmacare) (Cincinnati, OH, USA). Drug-free (blank) bone marrow supernatant and cells were obtained from consenting patients with acute leukemia under Johns Hopkins Medical Institute Institutional Review Board approval.
2.2 Stock solutions
Stock solutions of veliparib were prepared in duplicate as 1 mM solutions in methanol. The area counts for each of the duplicated aliquots were checked in quintuplicate. If the mean value for area counts was within 5%, the stock solutions were then stored in glass vials at −20°C. A620223.69 was prepared as a 0.5 mg/mL solution in methanol and stored in a glass vial at −20°C.
2.3 Preparation of Calibration Standards and Quality Controls
2.3.1 Plasma
Veliparib stock solutions were diluted in acetonitrile-water (1:1, v/v) to spike blank human plasma on each day of analysis. The dilutions were used to prepare six calibration standards containing veliparib in duplicate at the following concentrations: 5, 10, 50, 100, 500 and 1000 nM. Quality control (QC) samples were prepared independently in blank plasma at four different concentrations of veliparib including: 5 nM, the lower limit of quantitation (LLOQ); 8 nM, the low QC (LQC); 80 nM, the medium QC (MQC); and 800 nM, the high QC (HQC). For long-term and freeze-thaw stability, QC samples were prepared as a batch and stored at −70°C.
2.3.2 Bone Marrow Supernatant and Cell Quality Controls
Veliparib stock solutions were diluted in acetonitrile-water (1:1, v/v) to spike blank human plasma, bone marrow supernatant (1:1, v/v), or bone marrow cells suspended in 0.1 mL of plasma (regardless of cell count). All of the concentrations and further preparations remained the same as the plasma QCs. The plasma calibration curve was used for all samples due to limited availability of bone marrow supernatant and bone marrow cells.
2.4 Sample Preparation
2.4.1 Plasma
Frozen plasma samples were thawed in a water bath at ambient temperature. A 100 μL aliquot of plasma was added to a borosilicate glass test tube (13×100 mm) containing 0.5 mL of acetonitrile solution and A620223.69 (0.5 μg/mL), which was used as internal standard. The tube was mixed vigorously for 30 seconds on a vortex-mixer, followed by centrifugation at 1200 × g for 10 minutes at ambient temperature. A volume of 450 μL of the top organic layer was transferred to a disposable borosilicate glass culture tube (13×100 mm) and evaporated to dryness under nitrogen at 40°C. The residue was dissolved in 100 μL of acetonitrile-water (1:5, v/v) by vortex mixing (30 seconds). The sample was transferred to a 250 μL polypropylene autosampler vial, sealed with Teflon crimp cap, and then centrifuged at 1200 × g for 10 minutes. A volume of 20 μL was injected into the LC/MS/MS instrument using an autosampling device operating at room temperature.
2.4.2 Bone Marrow Supernatant and Cells
Frozen bone marrow supernatant and cell samples were thawed in a water bath at ambient temperature. For the supernatant, the samples were diluted in human plasma (1:1, v/v). Bone marrow cells, regardless of cell number, were suspended in 0.1 mL of human plasma. The suspensions then followed the preparation steps outlined for plasma, starting with the addition of 100 μL of sample to acetonitrile containing internal standard.
2.5 Chromatographic and mass-spectroscopic conditions
Chromatographic analysis was performed using an Agilent 1100 Series HPLC (Agilent Technologies, Palo Alto, CA, USA). Separation of the analyte from potentially interfering material was achieved at ambient temperature using Atlantis™ dC18 column (100 × 2.1 mm i.d.) packed with a 3-μm dC18 stationary phase, protected by a Waters X-Terra MS guard column packed with 3.5 μm RP18 material (Milford, MA, USA). The mobile phase used for the chromatographic separation was composed of acetonitrile-ammonium acetate (2mM) (2:3, v/v) containing 0.1% formic acid, and was delivered isocratically at a flow rate of 0.2 mL/min. The column effluent was monitored using an API 3000 triple-quadruple mass-spectometric detector (Applied Biosystems, Foster City, CA, USA). The instrument was equipped with an electrospray interface in positive ion mode, and controlled by the Analyst version 1.2 software (Applied Biosystems). Samples were introduced to the interface through a Turbo IonSpray with the temperature set at 400°C. A high positive voltage of 5.0 kV was applied to the ion spray. Nitrogen was used as the nebulizer gas, curtain gas, and collision gas with the settings of 12, 6, and 8, respectively. Other optimal parameters including declustering potential (DP), focusing potential (FP), entrance potential (EP), collision energy (CE), and collision cell exit potential (CXP) are reported in Table 1. The spectrometer was programmed to allow the ion of veliparib at m/z 245.2 and that of A620223.69 at m/z 287.0 to pass through the first quadrupole (Q1) and into the collision cell (Q2). The major fragment observed for veliparib (m/z 162.2) and A620223.69 (m/z 124.2) were monitored in the third quadrupole.
Table 1.
Optimization parameters for veliparib and internal standard
| DP (V) | FP (V) | EP (V) | CE (eV) | CXP (V) | |
|---|---|---|---|---|---|
| Veliparib | 36 | 140 | 10 | 19 | 14 |
| A620223.69 | 61 | 140 | 10 | 41 | 6 |
2.6 Calibration curves
Calibration curves for veliparib were computed using the ratio of the peak area of analyte to the internal standard by using a least-squares linear regression analysis with 1/x weight. The parameters of each calibration curve were used to back-calculate concentrations and to obtain values for the QC samples and unknown samples by interpolation.
2.7 Method Validation
2.7.1 Specificity
The method specificity was tested using visual inspection of extracted human plasma, bone marrow cells, and bone marrow supernatant chromatograms from six different healthy donors per matrix for the presence of endogenous or exogenous interfering peaks. The interfering peak area needed to be less than 20% of the peak area for veliparib at the lower limit of quantitation in plasma, bone marrow cells or bone marrow supernatant.
2.7.2. Calibration curves and QCs
Method validation runs for calibrator standards and QCs were performed on three consecutive days and included a calibration curve processed in duplicate and QC samples, at four different concentrations, in quintuplicate, and a single plasma blank and zero-level standard (blank with internal standard). For the QCs, each matrix (human plasma, bone marrow supernatant, and bone marrow cells) was assessed on each validation day. Estimates of the between-run precision were obtained by one-way analysis of variance (ANOVA) as previously described [13]. The extraction efficiency of the assay was measured by comparison of the peak area ratio of veliparib extracted from plasma and an aqueous solution in triplicate at concentrations of the low, middle, and high QCs.
The stability of veliparib in plasma was tested at concentrations of the low and high QCs in triplicate after 3 freeze-thaw cycles. The short-term stability of veliparib in plasma was assessed in triplicate at room temperature (on the bench-top) at 2, 4 and 6 hours. The long-term stability of veliparib in plasma at −70°C and in methanol (1 mM) at −20°C was assessed at 3 month intervals. Stability of drug in neutral extracts was assessed on the autosampler.
2.8 Patient samples
The samples analyzed were from adult patients with refractory and relapsed acute myelogenous leukemia enrolled to a clinical trial where veliparib was administered orally at a dose of 10 mg twice daily. Blood samples were collected in heparinized tubes at baseline (pre-treatment) and at 0.25, 0.5, 1, 2, 4, 6 and 8 hours following administration of the first 10 mg dose of veliparib. Blood samples were immediately placed on ice or refrigerated then centrifuged at 4°C, 1000 g for 10 minutes. The resultant plasma was stored at −70°C until analysis. Bone marrow was aspirated and collected in preservative-free sodium heparin at baseline (pre-treatment) and at 4 to 7 hours following administration of the first 10 mg dose of veliparib. The bone marrow was centrifuged and the resultant effluent (bone marrow supernatant) was collected. The resultant pellet was re-suspended in RPMI 1640, and the suspension was sedimented by Ficoll density gradient centrifugation. Bone marrow blast cells were collected then washed in phosphate buffered saline (PBS), as washing with RPMI 1640 lead to interferences in preliminary experiments. The cells were then centrifuged to produce a pellet, and the PBS was removed. The cells were stored as dry pellets, and both the dry cell pellets and bone marrow supernatant were stored at −70°C until analysis. The clinical protocol was approved by the Johns Hopkins Medical Institute Institutional Review Board and all patients provided written informed consent before entering the study.
Plasma pharmacokinetic parameters after a single 10 mg dose of veliparib on day 1 were estimated using model-independent noncompartmental analysis as implemented in the computer software program WinNonlin (Version 5.2, Pharsight Corp.). The maximum plasma concentration (Cmax) and the time of Cmax after oral administration were obtained by visual inspection of the plasma concentration-time curve. The area under the plasma concentration-time curve (AUC) was calculated using the log-linear trapezoidal rule. The half-life was calculated as 0.693 divided the terminal disposition rate constant (λz), which was determined from the slope of the terminal phase of the concentration-time profile. Bone marrow supernatant and bone marrow cell concentrations were reported with descriptive statistics only.
3. RESULTS AND DISCUSSION
3.1 Detection and chromatography
The mass spectrum of veliparib showed a protonated molecular ion ([MH+]) at m/z 245.2. The major fragment observed was at m/z 162.2, which was selected for subsequent monitoring in the third quadrupole (Fig. 1). The mass spectrum of the internal standard, A620223.69, showed a [MH+] at m/z 287.0, and the high collision energy gave one major product ion at m/z 124.2 (data not shown).
3.2 Calibration Curve and LLOQ (lower limit of quantification)
The calculated peak area ratios of veliparib to A620223.69 versus the nominal concentration of the analyte displayed a linear relationship in the tested range of 5 to 1000 nM. After applying the peak area ratio in combination with a weighting factor of 1/x, a mean least-squares linear-regression correlation coefficient of greater than 0.99 was obtained in all analytical runs. This weighting factor was chosen compared to uniform weighting after evaluation of goodness-of-fit by assessment of the R2 value, intercept closest to a zero value, % recovery of calibrators and QCs, and assessment of residuals.
For each point on the calibration curves for veliparib, the concentrations back-calculated from the equation of the regression analysis were always within 9.5% of the nominal value (Tables 2 and 3). The distribution of the residuals showed random variation, was normally distributed, and centered on zero (data not shown).
Table 2.
Back-calculated concentrations from calibration curves over the concentration range of 5 to 1000 nM.a
| Nominal Concentration (nM) | Calculated Concentration (nM)b | Accuracy (%) | Precision (%) |
|
|---|---|---|---|---|
| Within-Run | Between-Run | |||
| 5 | 5.4 ± 0.3 | 107.0 | 5.8 | -c |
| 10 | 10.3 ± 0.6 | 102.7 | 5.7 | -c |
| 50 | 48.2 ± 1.8 | 96.4 | 1.4 | 3.8 |
| 100 | 95.6 ± 5.7 | 95.6 | 7.5 | -c |
| 500 | 467.7 ± 35.6 | 93.5 | 4.1 | 7.2 |
| 1000 | 1037.7 ± 45.4 | 103.8 | 4.3 | 0.5 |
Performed in duplicate on 3 separate days.
Values are mean ± standard deviation.
No significant variation was observed as a result of performing the assay in different runs.
Table 3.
Assessment of accuracy, precision, and recoverya
| Nominal Concentration (nM) | Accuracy (%) | Precision (%) |
Recovery (%) | |
|---|---|---|---|---|
| Within-Run | Between-Run | |||
| Plasma | ||||
| 5 | 99.5 | 5.5 | 9.5 | -b |
| 8 | 101.9 | 6.6 | 6.7 | 77.4 |
| 80 | 99.4 | 4.7 | 6.7 | 70.1 |
| 800 | 102.2 | 3.0 | 5.4 | 62.7 |
| Bone Marrow Supernatantc | ||||
| 5 | 104.1 | 2.2 | 8.8 | -b |
| 8 | 100.7 | 3.2 | 2.7 | 92.5 |
| 80 | 100.2 | 4.4 | -d | 100.5 |
| 800 | 102.4 | 4.0 | -d | 92.0 |
| Bone Marrow Cellse | ||||
| 5 | 103.8 | 2.4 | 6.0 | -b |
| 8 | 97.7 | 2.7 | 3.3 | 104.8 |
| 80 | 95.2 | 3.0 | 1.3 | 97.8 |
| 800 | 101.7 | 1.8 | 3.2 | 100.0 |
Performed in quintuplicate on three separate days
Not done
Sample diluted 1:1 (v/v) with plasma prior to extraction
No significant additional variation was observed as a result of performing the assay in different runs.
Sample suspended in 100μL of plasma prior to extraction.
The LLOQ for veliparib was established at 5 nM, which was associated with a mean (± standard deviation) signal-to-noise ratio for 15 observations of 34.4 ± 14.8 for plasma, and 78.2 ± 29.7 for bone marrow supernatant and 93.1 ± 23.1 for bone marrow cells.
3.3 Selectivity and specificity
No peaks were observed in the chromatograms of blank plasma from 6 donors when monitored for veliparib. Representative chromatograms of blank human plasma and plasma spiked with internal standard and veliparib are shown in Figures 2 and 3. The mean (± standard deviation) retention times for veliparib and A620223.69 under the optimal conditions were both 1.98 ± 0.40 minutes, with an overall chromatographic run time of 3 min. The selectivity for the analysis is shown by symmetrical resolution of the peaks, with no significant chromatographic interference around the retention times of the analyte and internal standard in drug-free specimens.
Figure 2.
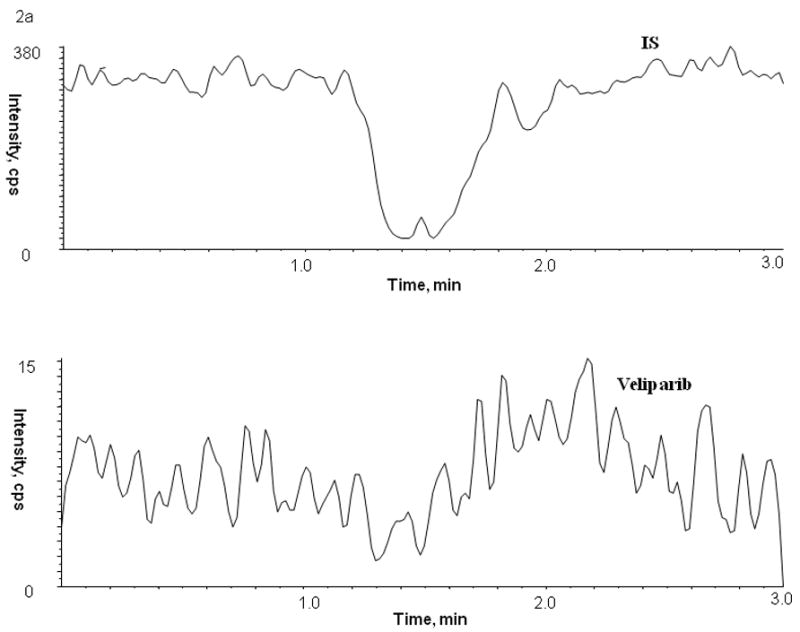
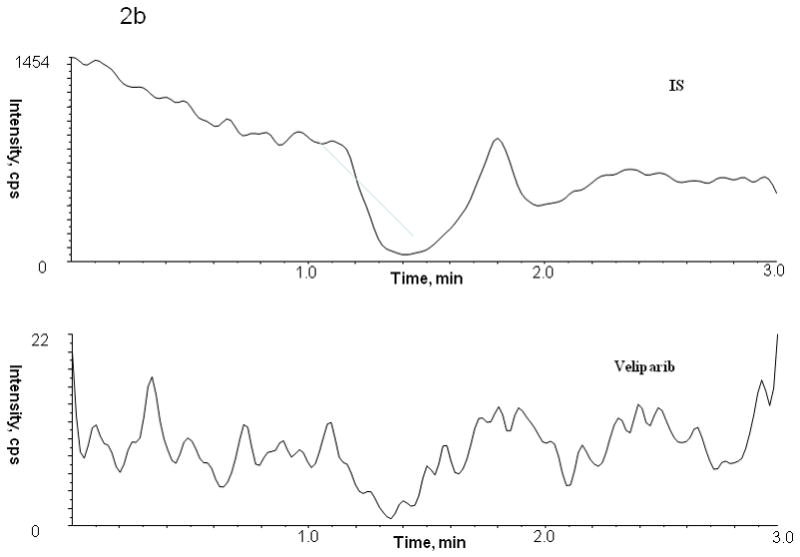
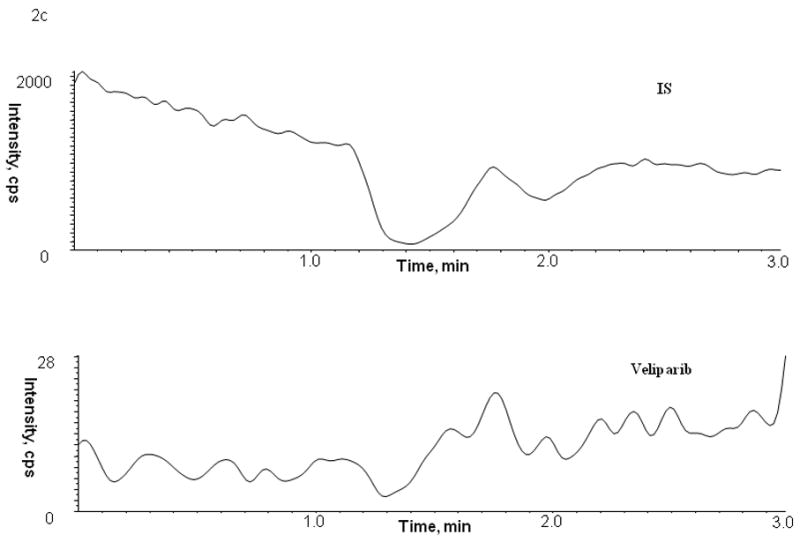
Chromatogram of blank human (A) plasma, (B) bone marrow supernatant and (C) bone marrow cells
Figure 3.
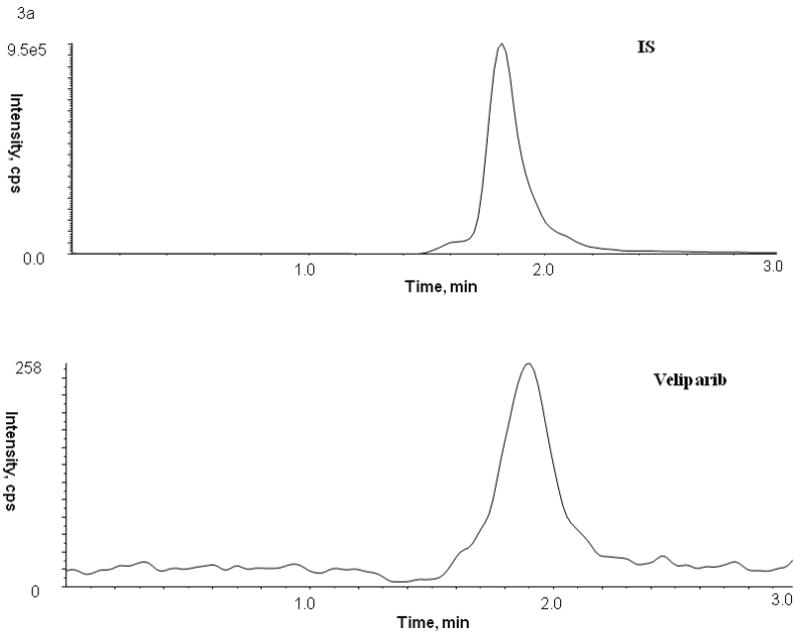
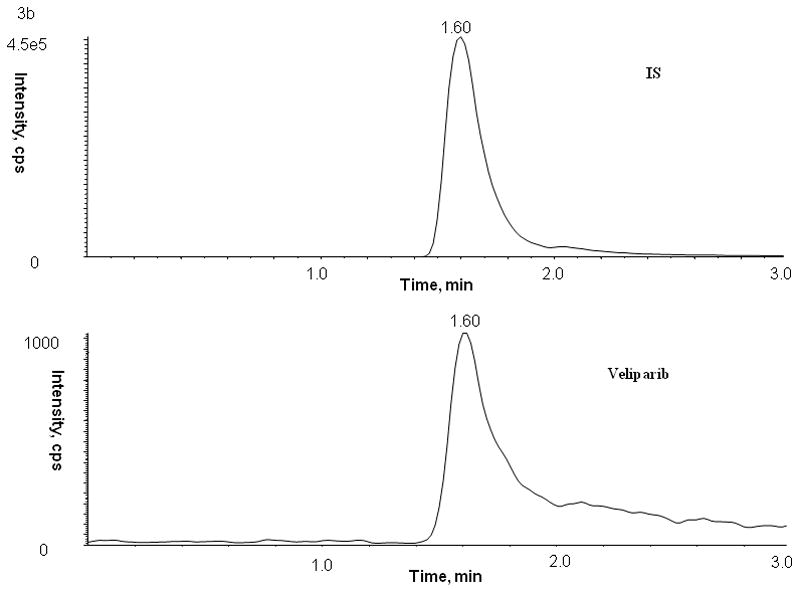
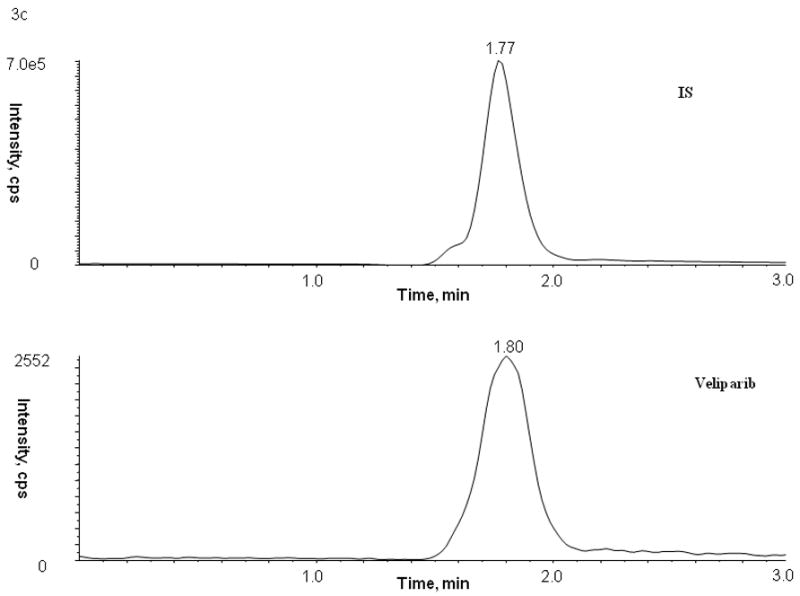
Chromatograms of internal standard (top panel) and veliparib (bottom panel) in blank (A) plasma, (B) bone marrow supernatant, and (C) bone marrow cells
3.4 Accuracy, precision, and recovery
For QC samples prepared by spiking human plasma, bone marrow supernatant and bone marrow cells with veliparib, the within-run and between-run variability (precision), expressed as the percentage relative standard deviations, were less than 9.5%. Likewise, the mean predicted concentration (accuracy) was less than 7.0% off the nominal value (Table 2). The relative recovery of veliparib from human plasma, bone marrow supernatant, or bone marrow cells is above 62.7%, 92.0%, and 97.8% (Table 3).
3.5 Analyte stability
QC samples prepared in human plasma undergoing three freeze-thaw cycles showed no significant degradation (< 3.4%) for veliparib. In neutral extracts, veliparib was stable up to 4.4 hours on the autosampler without any significant degradation, allowing for more than 80 samples to be analyzed simultaneously within a single chromatographic run. The long-term stability tests suggested that veliparib was stable in methanol (stock solution, 1 mM) at −20°C for at least 3 months, and stable in plasma at −70°C for at least 175 days, with degradation less than 15%.
3.6 Concentration-time profiles
The present LC-MS-MS method was successfully applied to study the pharmacokinetics of veliparib in adult patients with refractory and relapsed acute myelogenous leukemia receiving oral veliparib as a dose of 10 mg twice daily. A representative chromatogram from a patient receiving 10 mg of veliparib is shown in Figure 4. Following a single oral dose of veliparib 10 mg, the maximum plasma concentration achieved was 286 nM, which occurred at 1.0 hour with an AUC of 1446 nM*h (see Figure 5). The half-life was determined to be 3.64 hours. Veliparib was detected in bone marrow supernatant (39.7 nM) and bone marrow cells (0.32 nmol/106 cell) for this patient at 5.25 hours with a concomitant plasma sample of 116 nM after the veliparib dose.
Figure 4.
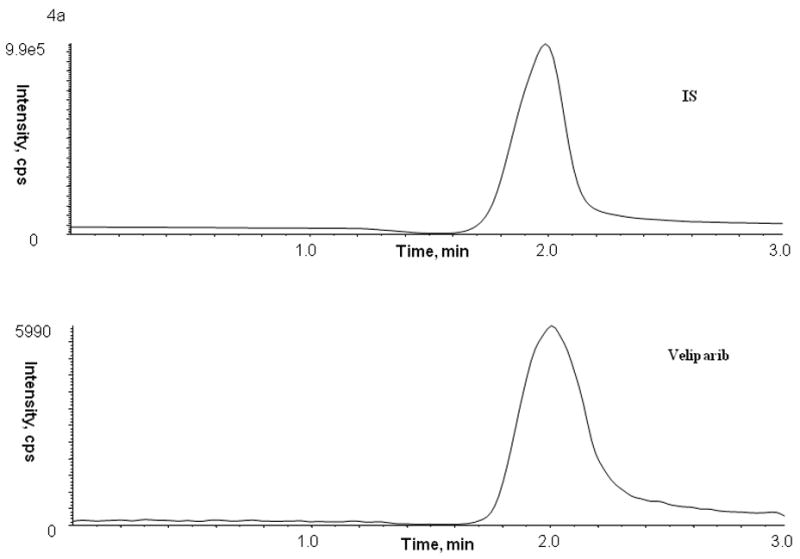
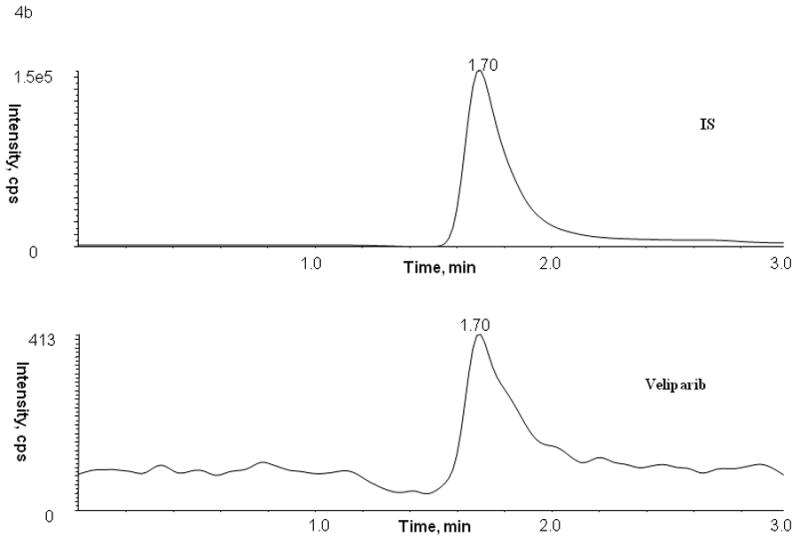
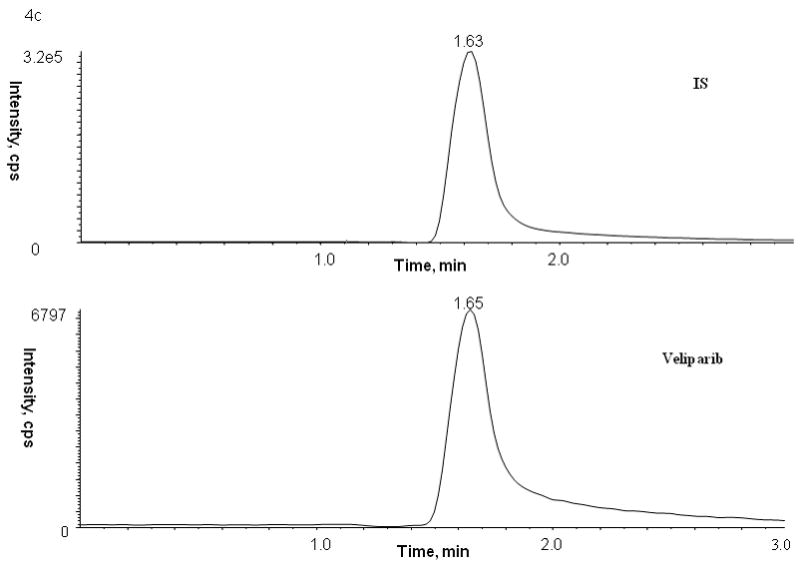
Representative patient chromatograms of internal standard (top panel) and veliparib (bottom panel) (A) plasma C1D1 8 hr after veliparib administration, (B) bone marrow cells C1D4 5.25 hr after veliparib administration with 28 × 106 cell count, and (C) bone marrow supernatant C1D4 5.25 hr after veliparib administration.
Figure 5.
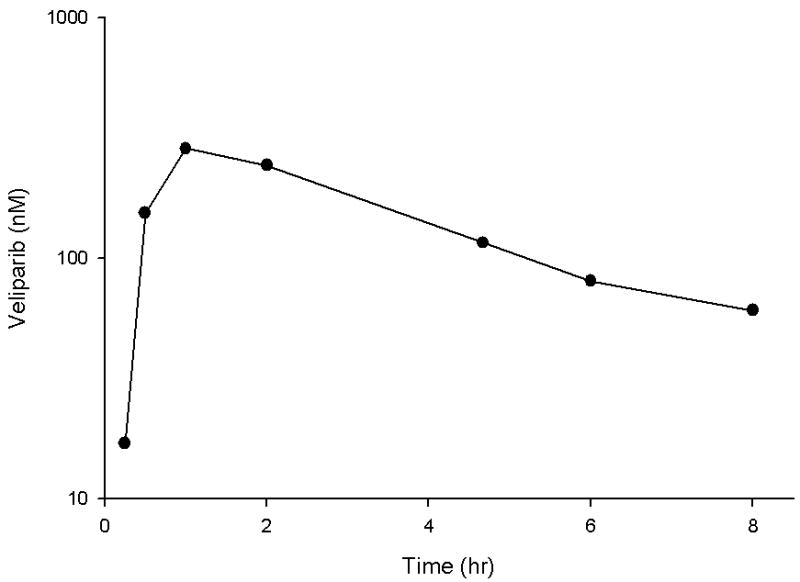
Veliparib plasma concentration-time profile on day 1 in a patient receiving the first dose of 10 mg orally.
4. CONCLUSION
In conclusion, we have developed and validated an assay for measuring veliparib in human plasma, bone marrow supernatant, and cells. In comparison to previously published methods, the current assay has a lower limit of quantitation of 5 nM (versus 16 nM [9], 40.93 nM [11], or 100 nM [10]), uses the same or less sample (100 μL [10] versus 200 μL [11] or unknown [9]) with similar sample preparation. These characteristics combined with an overall chromatographic run time of 3 minutes (versus 13 minutes [10], 25 minutes [11], or unknown time [9]) and validation in bone marrow supernatant and bone marrow cells, shows the advantages over previously published methods [9–11] and thus should be more widely applicable to a broader range of matrices. The described method for quantitation over the concentration range of 5 to 1000 nM is sufficient to allow plasma pharmacokinetic monitoring and detection in the critical tumor compartment (bone marrow supernatant) and target cells (bone marrow cells) of veliparib during daily, continuous administration. This method The is being used to characterize the plasma PK and PD of veliparib in combination therapy in cancer patients and in preclinical studies to further optimize veliparib treatment schedules for future clinical evaluation.
Table 4.
Assessment of stability in human plasmaa
| Condition | Veliparib | |
|---|---|---|
| 8 nM | 800 nM | |
| Freeze-thaw stability (−70°C)b | ||
| Cycle 1 | 97.6 | 102.1 |
| Cycle 2 | 96.6 | 102.9 |
| Cycle 3 | 97.0 | 102.0 |
| Short-term stability (room temperature)b | ||
| Time = 0.5 h | 97.8 | 101.0 |
| Time = 1 h | 101.8 | 102.0 |
| Time = 2 h | 100.2 | 98.9 |
| Time = 4h | 95.9 | 95.3 |
| Time = 6h | 91.7 | 98.0 |
| Autosampler stability (10°C)c | ||
| Time = 2 h | 99.3 | 105.0 |
| Time = 4.4 h | 94.5 | 104.0 |
| Long-term stability (−70°C)b | ||
| Time = 91 days | 102.1 | 103.5 |
| Time = 175 days | 91.4 | 85.9 |
Expressed as the mean percentage change from time zero (nominal concentration).
Performed in triplicate.
Performed repeatedly for 4.4 h with 1 sample.
Acknowledgments
This work was supported by National Institutes of Health grants P30CA069773 and U01CA70095.
Footnotes
Publisher's Disclaimer: This is a PDF file of an unedited manuscript that has been accepted for publication. As a service to our customers we are providing this early version of the manuscript. The manuscript will undergo copyediting, typesetting, and review of the resulting proof before it is published in its final citable form. Please note that during the production process errors may be discovered which could affect the content, and all legal disclaimers that apply to the journal pertain.
References
- 1.Curtin NJ. PARP inhibitors for cancer therapy. Expert Rev Mol Med. 2005;7:1–20. doi: 10.1017/S146239940500904X. [DOI] [PubMed] [Google Scholar]
- 2.Ame JC, Spenlehauer C, de Murcia G. The PARP superfamily. Bioessays. 2004;26:882–893. doi: 10.1002/bies.20085. [DOI] [PubMed] [Google Scholar]
- 3.Jagtap P, Szabo C. Poly(ADP-ribose) polymerase and the therapeutic effects of its inhibitors. Nat Rev Drug Discov. 2005;4:421–440. doi: 10.1038/nrd1718. [DOI] [PubMed] [Google Scholar]
- 4.Low J. Solicitation for preclinical studies (ABT-888 PARP inhibitor) CTEP rapid communication. 2005.
- 5.Donawho CK, Luo Y, Luo Y, Penning TD, Bauch JL, Bouska JJ, Bontcheva-Diaz VD, Cox BF, DeWeese TL, Dillehay LE, Ferguson DC, Ghoreishi-Haack NS, Grimm DR, Guan R, Han EK, Holley-Shanks RR, Hristov B, Idler KB, Jarvis K, Johnson EF, Kleinberg LR, Klinghofer V, Lasko LM, Liu X, Marsh KC, McGonigal TP, Meulbroek JA, Olson AM, Palma JP, Rodriguez LE, Shi Y, Stavropoulos JA, Tsurutani AC, Zhu GD, Rosenberg SH, Giranda VL, Frost DJ. ABT-888, an orally active poly(ADP-ribose) polymerase inhibitor that potentiates DNA-damaging agents in preclinical tumor models. Clin Cancer Res. 2007;13:2728–2737. doi: 10.1158/1078-0432.CCR-06-3039. [DOI] [PubMed] [Google Scholar]
- 6.Albert JM, Cao C, Kim KW, Willey CD, Geng L, Xiao D, Wang H, Sandler A, Johnson DH, Colevas AD, Low J, Rothenberg ML, Lu B. Inhibition of poly(ADP-ribose) polymerase enhances cell death and improves tumor growth delay in irradiated lung cancer models. Clin Cancer Res. 2007;13:3033–3042. doi: 10.1158/1078-0432.CCR-06-2872. [DOI] [PubMed] [Google Scholar]
- 7.Giranda V, Liu J, Bauch J, Mandli M, Roberts E, Masse S, Healan-Greenberg C, Morfitt S, Marsh K, Beconi M. Metabolism of the PARP inhibitor ABT-888 in rats and dogs and in vitro in humans. Proc Am Assoc Cancer Res. 2007;48 Abstract 1549. [Google Scholar]
- 8.Kummar S, Kinders R, Gutierrez M, Rubinstein L, Parchment RE, Phillips LR, Low J, Murgo AJ, Tomaszewski JE, Doroshow JH, Group NPW. Inhibition of poly (ADP-ribose) polymerase (PARP) by ABT-888 in patients with advanced malignancies: Results of a phase 0 trial. J Clin Oncol. 2007;25 doi: 10.1200/JCO.2008.19.7681. Abstract 3518. [DOI] [PMC free article] [PubMed] [Google Scholar]
- 9.Muscal JA, Thompson PA, Giranda VL, Dayton BD, Bauch J, Horton T, McGuffey L, Nuchtern JG, Dauser RC, Gibson BW, Blaney SM, Su JM. Plasma and cerebrospinal fluid pharmacokinetics of ABT-888 after oral administration in non-human primates. Cancer Chemother Pharmacol. 2009 doi: 10.1007/s00280-009-1044-3. Epub ahead of print. [DOI] [PMC free article] [PubMed] [Google Scholar]
- 10.Phillips LR, Hill KD, Majerova E, et al. Liquid chromatographic determination of NSC 737664 (ABT-888: an inhibitor of poly (ADP-ribose) polymerase (PARP)) in plasma and urine in a phase 0 clinical trial. J Liq Chromatogr Relat Technol. 2009;32:261–272. doi: 10.1080/10826070802603351. [DOI] [PMC free article] [PubMed] [Google Scholar]
- 11.Parise RA, Shawaqfeh M, Egorin MJ, Beumer JH. Liquid chromatography-mass spectrometric assay for the quantitation in human plasma of ABT-888, an orally available, small molecule inhibitor of poly(ADP-ribose) polymerase. J Chromatogr B Analyt Technol Biomed Life Sci. 2008;872:141–147. doi: 10.1016/j.jchromb.2008.07.032. [DOI] [PMC free article] [PubMed] [Google Scholar]
- 12.Kummar S, Kinders R, Gutierrez ME, Rubinstein L, Parchment RE, Phillips LR, Ji J, Monks A, Low JA, Chen A, Murgo AJ, Collins J, Steinberg SM, Eliopoulos H, Giranda VL, Gordon G, Helman L, Wiltrout R, Tomaszewski JE, Doroshow JH. Phase 0 clinical trial of the poly (ADP-ribose) polymerase inhibitor ABT-888 in patients with advanced malignancies. J Clin Oncol. 2009;27:2705–2711. doi: 10.1200/JCO.2008.19.7681. [DOI] [PMC free article] [PubMed] [Google Scholar]
- 13.Rosing H, Man WY, Doyle E, Bult A, Beijnen JH. Bioanalytical liquid chromatographic method validation. A review of current practices and procedures. J Liq Chromatogr Rel Technology. 2000;23:329–354. [Google Scholar]


