

Abstract
Ocular dominance plasticity (ODP) following monocular deprivation (MD) is a model of activity-dependent neural plasticity that is restricted to an early critical period regulated by maturation of inhibition. Unique developmental plasticity mechanisms may improve outcomes following early brain injury. Our objective was to determine the effects of neonatal cerebral hypoxia–ischemia (HI) on ODP. The rationale extends from observations that neonatal HI results in death of subplate neurons, a transient population known to influence development of inhibition. In rodents subjected to neonatal HI and controls, maps of visual response were derived from optical imaging during the critical period for ODP and changes in the balance of eye-specific response following MD were measured. In controls, MD results in a shift of the ocular dominance index (ODI) from a baseline of 0.15 to −0.10 (p < 0.001). Neonatal HI with moderate cortical injury impairs this shift, ODI = 0.14 (p < 0.01). Plasticity was intact in animals with mild injury and in those exposed to hypoxia alone. Neonatal HI resulted in decreased parvalbumin expression in hemispheres receiving HI compared with hypoxia alone: 23.4 versus 35.0 cells/high-power field (p = 0.01), with no change in other markers of inhibitory or excitatory neurons. Despite abnormal inhibitory neuron phenotype, spontaneous activity of single units and development of orientation selective responses were intact following neonatal HI, while overall visual responses were reduced. Our data suggest that specific plasticity mechanisms are impaired following early brain injury and that the impairment is associated with altered inhibitory neuronal development and cortical activation.
Introduction
The immature brain exhibits a unique capacity for large-scale anatomical rewiring of connections in response to changes in neuronal activity, a form of plasticity observed only during critical periods in development (Hensch, 2005). Such plasticity mechanisms have potential to contribute to recovery from early brain injury. Despite the existence of these forms of plasticity, neonatal brain injury often results in permanent, pervasive neurodevelopmental impairments (Ferriero, 2004). Recent evidence highlights a role for maturation of cortical inhibition in controlling the onset of critical period plasticity (Hensch and Fagiolini, 2005). During critical periods, sensory-driven neuronal activity refines cortical inputs into precise maps that reflect sensory experience. Before the critical period, immature circuits incorporate a transient neocortical cell population, subplate neurons, and are driven by spontaneous patterned activity (Feller and Scanziani, 2005). In the visual system, this endogenous activity arises in the retina in waves that are required for the development of precise topographic maps in visual cortex (Cang et al., 2005b, 2008). During this precritical period of cortical development (Feller and Scanziani, 2005), maturation of cortical inhibition is dependent upon the presence of subplate neurons (Kanold and Shatz, 2006) and is influenced by neuronal activity (Morales et al., 2002).
Subplate neurons are selectively vulnerable to neonatal hypoxia–ischemia (HI) (McQuillen et al., 2003). In this study, we investigate the effect of neonatal HI and consequent subplate neuron death during the precritical period on the development of visual cortical maps, cortical plasticity, and inhibitory neurons. This study focuses on one of the best-described models of cortical plasticity, visual system ocular dominance plasticity, in the setting of a standard translational rodent model of neonatal cerebral hypoxic–ischemic injury.
Materials and Methods
Animals
Timed pregnant Long–Evans rats (Simonsen) were allowed food and water ad libitum. Animals were placed together for <6 h in the morning with day of breeding designated embryonic day 0. All animal research was approved by the University of California San Francisco Committee on Animal Research and performed in accordance with standards for humane animal treatment as outlined in the Policy on Humane Care and Use of Laboratory Animals.
Hypoxia–ischemia
The Rice–Vannucci procedure was performed at postnatal day 2 (P2) as described previously (McQuillen et al., 2003). Pups were anesthetized with isoflurane and the right common carotid artery was electrocauterized. Pups were placed back with the mother for 1 h to recover from anesthesia and then placed in chambers temperature controlled by a circulating water bath to maintain a chamber temperature of 34°C and a rat skin surface temperature of 36.5–37°C. Chambers received a flow of 5.6% oxygen gas at a rate of 3 L per minute. Duration of hypoxia ranged between 2 and 2.5 h with the hypoxia period terminated if any animal appeared premorbid or the mortality for any individual litter reached 20%.
Determination of cortical injury severity
Animals were killed at weekly intervals or raised to P32 for optical imaging followed by perfusion fixation, sectioning, and histology. Injury severity was defined categorically (mild, moderate, or severe) as described previously (McQuillen et al., 2003) based upon postmortem histology of coronal sections stained with cresyl violet. Specifically, injury is graded as follows: (1) mild—asymmetry of the lateral ventricles with minimal loss of cells in the lower neocortical layers (Fig. 1A,D), (2) moderate—asymmetry with dilatation of the lateral ventricles, significant thinning of subplate (VIb) with more severe injury in entorhinal cortex (Fig. 1B, asterisk, D), or (3) severe—loss of cells in layer VIa and subplate with clear cyst formation laterally (Fig. 1C, asterisk, D). Histological injury grade was determined for all immunohistochemistry, optical imaging, and physiology experiments. Because histological assessment of injury is impossible in tissue prepared for immunoblots, animals were preselected for moderate injury 24 h after HI using magnetic resonance imaging (MRI) as described previously (Wendland et al., 2008). Diffusion-weighted MRI at 24 h following the Rice–Vannucci procedure reliably predicts caspase-3 activation, cell death, and histological grades of injury at 7 d (Wendland et al., 2008). Animals with mild injury have no detectable changes on MRI (Fig. 1A). Moderate injury produces enlargement of the lateral ventricle visible as a hypointense band below neocortex (Fig. 1B). Severe injury is detected by enlargement of the lateral ventricle with diffusion hyperintensity of overlying cortex (Fig. 1C). To provide an alternate, continuous measure of injury, the thickness of primary visual cortex surface (−5.88 mm with respect to bregma) was measured from the bottom of the cortical plate to the pial surface in 1-month-old animals (Fig. 1A–C, see boxed area for location of measurement). The mean ± SD area V1 cortical thickness measures 1332 ± 17 μm in unmanipulated animals. Following HI, V1 cortical thickness measurements by injury severity category were as follows: 1223 ± 83 μm (mild), 1118 ± 96 μm (moderate), and 857 ± 172 μm (severe).
Figure 1.
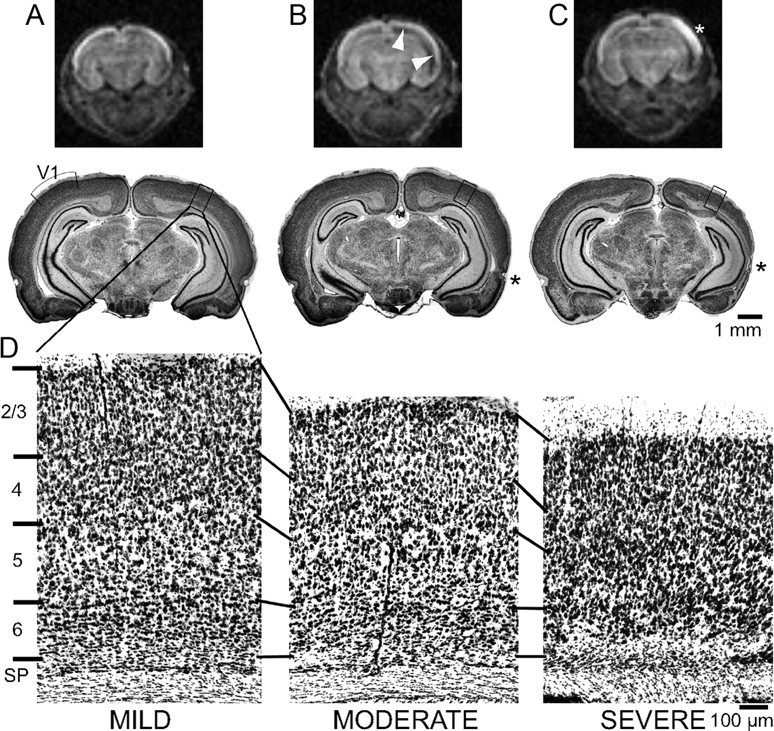
Categorical grade of injury. A–C, Diffusion-weighted MRI in the coronal plane at P3 and low-magnification images of cresyl violet stained coronal sections at the level of visual cortex at P32 following P2 HI demonstrate three grades of injury: mild (A), moderate (B), or severe (C). In the magnetic resonance images (top row) arrowheads indicate a hypointense band below neocortex in moderately injured animals (B). Severely injured animals show cortical hyperintensity (C, white asterisk). In severely injured animals, a cyst (black asterisk) may form laterally. D, Higher-magnification images from the boxed areas show specific injury to subplate and lower cortical layers with moderate to severe injury. V1, Primary visual cortex; SP, subplate.
Monocular deprivation
Rats received monocular deprivation (MD) to the contralateral eye (left) of the hemisphere subject to HI. MD lasted for 4–7 d during the peak of the critical period (P24–P36). Rats were anesthetized with isoflurane and eyelids were trimmed and sutured together with three mattress stitches. The eye was reopened and cleaned before imaging.
Intrinsic signal optical imaging
Rapid imaging of the intrinsic signal of cortical activity in response to a continuous-period stimulation was performed using minor modifications of a protocol described for mice (Kalatsky and Stryker, 2003).
Surgery.
To prepare the animal for imaging, isoflurane anesthesia was used at induction, and then one of two anesthesia regimens was used: (1) urethane [intraperitoneal 25% (w/v) urethane 0.5 ml/100 g body weight], or (2) pentobarbital/buprenorphine (intraperitoneal pentobarbital 2 mg/100 g and intramuscular buprenorphine hydrochloride 0.02 mg/kg). Both regimens included a preanesthetic dose of intramuscular chlorprothixene (0.2 mg/100 g), subcutaneous atropine (5 mg/kg), and dexamethasone (0.2 mg/100 g). Body temperature was maintained at 37.5°C and heart rate was monitored continuously. Supplemental intraperitoneal urethane (0.1 ml/100 g) or pentobarbital doses (1 mg/100 g) were administered as required. A tracheotomy was performed and oxygen supplied to a 1.5-mm-diameter glass tracheostomy tube. Animals were placed in a stereotaxic frame using ear bars and a craniotomy was performed to expose V1. Agarose 3% (w/v) and a glass coverslip were placed over the brain to prevent drying and to optimize optics during imaging. Agarose was sealed with liquid paper.
Imaging.
Temporally encoded intrinsic signal maps were recorded as described previously (Kalatsky and Stryker, 2003) and used to determine ocular dominance plasticity (Cang et al., 2005a). A high-refresh-rate monitor was placed 25 cm away from eyes of animal for periodic stimulus presentation. A Dalsa 1M30 CCD camera (Dalsa) was controlled by custom software to record intrinsic signals from V1 that was illuminated with red light (610 ± 10 nm). Cortical surface images were taken using green light (546 ± 10 nm). The camera was focused down 600 μm from pial surface before stimulus experiments. Periodic stimuli in the elevation directions (90° and 270°) were presented and averaged for both ipsilateral eye and contralateral eye individually to measure V1 response magnitude for each. The ipsilateral response map was used to template the region of interest when comparing response magnitudes for each eye. Response magnitudes were compared using Matlab to determine an ocular dominance index (ODI). An ODI is equal to the magnitude of response to contralateral eye (C) stimulation minus magnitude of response to ipsilateral eye (I) stimulation, over the summation of magnitude of responses [ODI = (C − I)/(C + I)]. Nasotemporal (azimuth) maps were also recorded in most animals (0° and 180°) but were not used for ODI calculations. Retinotopic map scatter, an index of map quality (Cang et al., 2005b), was determined using Matlab.
Histochemistry
Animals were killed with intraperitoneal pentobarbital (50 mg/kg) and transcardially perfusion fixed with 4% (w/v) paraformaldehyde in 0.1 m phosphate buffer. Brains were postfixed overnight and then allowed to sink in 25% (w/v) sucrose 0.1 m PBS. Brains were cut on a freezing-stage microtome at a width of 50 μm and stored in PBS and sodium azide at 4°C or in glycerol-based cryoprotectant at −20°C.
Peroxidase-DAB immunohistochemistry.
Sections were quenched in a 3% (v/v) hydrogen peroxide solution then blocked in 10% (v/v) donkey serum with 0.1% (v/v) Triton X-100 in PBS. Sections were incubated overnight in mouse anti-parvalbumin primary antibodies (Sigma-Aldrich) at a 1:1000 dilution at 4°C. Sections were washed with 0.1 m PBS with 0.1% (v/v) Tween 20 and then incubated in biotinylated donkey anti-mouse secondary antibodies (Jackson ImmunoResearch) at 1:500 dilution for 1 h at room temperature (RT). Sections were incubated in ABC solution (Vector Labs) and then stained in DAB solution with 1.2% (w/v) nickel ammonium sulfate per manufacturer's instructions.
Wisteria floribunda lectin.
Sections were quenched in 3% (v/v) peroxide solution and then blocked in 3% (w/v) BSA, 20 mm lysine, and 0.2% (v/v) Triton X-100 in PBS. Sections were incubated in 20 μg/ml lectin from Wisteria floribunda (Sigma-Aldrich, L-1766) overnight at 4°C. Sections were incubated in ABC solution and then stained in DAB solution per manufacturer's instructions. Washes in PBS–0.1% Tween 20 were performed between incubations.
Immunofluorescence.
Sections were incubated in mouse primary antibodies (anti-parvalbumin, Sigma-Aldrich, P3088, 1:1000; anti-calbindin, Swant, CB38, 1:2000; anti-calretinin, Swant, 7699/4, 1:2000) and/or 20 μg/ml lectin from Wisteria floribunda (Sigma-Aldrich, L-1766) overnight at 4°C. Sections were washed and then incubated in anti-mouse and anti-rabbit florescent secondary antibody (1:500) (Invitrogen) and florescent avidin for lectin (1:500) (Invitrogen, Avidin Oregon Green). Sections received bisbenzamide for a nuclear counterstain. Sections were mounted and coverslipped with Vectashield mounting medium (Vector Labs).
Analysis
Digital images of coronal sections stained for parvalbumin, calretinin, calbindin, and Wisteria floribunda agglutinin (WFA) were quantified using the Multi Wavelength Cell Scoring tool in MetaMorph 7.0 (Molecular Devices) to determine single- and double-labeled cell density. Data were collected for neocortex at three points in the brain, −0.36 mm (S1), −4.44 mm (V1), and −5.88 mm (V1) with respect to bregma (Paxinos and Watson, 2005). Mean cell density for each location was averaged and compared between hypoxia-alone and HI hemispheres.
Immunoblotting and densitometry
To confirm injury, protein extracts were analyzed for glial fibrillary acidic protein (GFAP) expression, a marker of injury and astrogliosis that persists for weeks in the HI hemisphere following neonatal Rice–Vannucci procedure (Sizonenko et al., 2008). GFAP is increased only in HI hemispheres (actin-normalized OD units ± SD in HI = 1.63 ± 0.04 vs H = 1.37 ± 0.05, p = 0.003; vs control = 1.34 ± 0.09, p = 0.009). Proteins were extracted from rat cortices and harvested with appropriate volume of cell lysis buffer [1× PBS, 1% NP-40, 0.5% sodium deoxycholate, 0.2% SDS, 1× Complete Mini Protease Cocktail (Roche)]. Extracts were spun at 13,000 rpm for 20 min at 4°C, and the supernatant containing the proteins was collected. Protein content was estimated with a BCA protein assay kit (Pierce) using a BSA-based standard curve. Equal amounts of protein were analyzed by SDS-PAGE and transferred to a polyvinylidene difluoride (PVDF) membrane using rapid semidry immunoblotting techniques (Bio-Rad). PVDF blots (Bio-Rad) were blocked using Superblock T20 blocking buffer (Thermo Scientific) for 1 h at RT and then washed three times for 10 min each in TBS with 0.05% Tween 20. Blots were then incubated in Superblock T20 with the appropriate dilution of primary antibody overnight at 4°C, including anti-GFAP (Sigma-Aldrich) at 4 μg/ml, anti-type II calcium/calmodulin-dependent protein kinase α (CaMKIIα) (Affinity BioReagents) at 0.75 μg/ml, anti-PSD-95 (Affinity Bioreagents) at 0.5 μg/ml, anti-GAD65/67 (Millipore Bioscience Research Reagents) at 0.5 μg/ml, anti-NR2A (Millipore) at 0.5 μg/ml, anti-VGLUT1 at 1:50,000 dilution, and anti-VGAT at 1:10,000 (Synaptic Systems). After being washed three times for 10 min in TBS with 0.05% Tween 20, blots were incubated for 2 h at RT with HRP-conjugated secondary antibody, including 0.1 μg/ml goat anti-rabbit (CalBioChem) for anti-GAD65/67 anti-VGLUT1, anti-VGAT and anti-NR2A, and 0.1 μg/ml goat anti-mouse (CalBioChem) for anti-CaM kinase IIα and anti-PSD-95. Blots were visualized using the SuperSignal West Pico chemiluminescent substrate (Thermo Scientific) and captured on autoradiographic films (GE Healthcare). For loading controls, all blots were incubated with anti-β-actin (Sigma) at 0.2 μg/ml overnight at 4°C, followed by incubation with HRP-conjugated goat anti-mouse as described for other antibodies. Films were digitized with an Epson Perfection 4490 Photo scanner, and band optical densities (ODs) were measured using ImageJ version 1.40 g (NIH). For each sample, we calculated the normalized ratio of protein to β-actin values, and these numbers were used to calculate the mean ± SD.
Visual cortical physiology
Single-unit recordings were made using experimental and analytical methods described previously (Niell and Stryker, 2008). Rats were anesthetized using the urethane regimen described above and secured in ear bars, and a small craniotomy was created above V1. A silicon 16-channel linear multielectrode (Neuronexus Technologies, model a1x16-3mm50-177) was inserted and allowed to stabilize before recording. Signals were acquired on a System 3 workstation (Tucker-Davis Technologies) and analyzed using Matlab. Single units were identified by clustering spike waveforms using the FastICA Matlab package and KlustaKwik (Harris et al., 2000). Units were classified as broad or narrow spiking based on trough-to-peak time. Of 106 successfully isolated units, 5 were narrow spiking and were excluded from subsequent analysis. Visual stimuli were generated using the Psychophysics Toolbox Matlab extensions (Brainard, 1997; Pelli, 1997) and included contrast-reversing checkerboards, drifting sinusoidal gratings, and contrast-modulated Gaussian noise movies. Responses to drifting gratings were used to construct an orientation tuning curve at the spatial frequency giving the maximal response. From this, we calculated the width of the tuned component and an orientation selectivity index (OSI), the ratio of the tuned versus unturned component of the response.
Statistics
Data that were normally distributed were initially analyzed graphically with scatter or box plots and summarized as mean and SD. Population difference testing was performed with unpaired, two-sided Student's t test or one-way ANOVA (normally distributed data) or Mann–Whitney U test. Multiple comparisons were corrected using the Bonferroni method. Association was tested by correlation or linear regression. Difference in cumulative probability was analyzed using the Kolmogorov–Smirnov test.
Results
Neonatal HI with mild to moderate cortical injury does not prevent the development of normal visual cortical maps
The response to visual stimulation was determined using optical imaging in rats that had received neonatal HI (n = 27, Rice–Vannucci model), in unmanipulated littermates (n = 21), or in hypoxia-alone rats (n = 4). The Rice–Vannucci model of neonatal HI performed at early ages (P0–P2) produces a range of injury in neocortex (Towfighi et al., 1997) that correlates with the extent of subplate neuron death and can be evaluated from routine histology (McQuillen et al., 2003). The model does not produce detectable injury to hippocampus or striatum. Thalamic injury is limited to the reticular nucleus of the thalamus (McQuillen et al., 2003).
In prior studies, we have shown with retrograde lipophilic dye labeling that visual thalamocortical connections persist following neonatal HI (McQuillen et al., 2003). These methods however are not sufficient to reveal organization or activation of visual cortex. Therefore we derived functional retinotopic maps of elevation (Fig. 2A, control phase map) and azimuth orientation (data not shown) using an optimized method of intrinsic signal optical imaging (Kalatsky and Stryker, 2003). The method employs a continuous, temporally periodic stimulus consisting of drifting horizontal (Fig. 2B) or vertical bars presented sequentially in both directions. The elevation map was used to determine the magnitude of eye-specific response (Cang et al., 2005a). Rodents typically show a stronger response to stimulation of the contralateral eye (Fig. 2A, control contralateral vs ipsilateral response maps). Animals were raised to the peak of the critical period for ocular dominance plasticity (P28–P32) (Fagiolini et al., 1994) before imaging (mean ± SD age at imaging 32.9 ± 3.5 d). Following imaging, animals that were subject to HI were killed and the severity of brain injury was graded. A minority of animals (n = 5/27, 19%) had developed severe neocortical injury with cyst formation of the lateral parietal–occipital lobe and these animals either lacked detectable response to visual stimulation (n = 2) or had very weak response (n = 3). These animals were not analyzed further. All other animals (n = 22) had either mild injury (n = 10/27, 37%) or moderate neocortical injury (n = 12/27, 44%). The appearance of retinotopic maps was unaltered by neonatal HI (Fig. 2A, HI phase map) or hypoxia alone (n = 2, data not shown). Neonatal HI did not alter the expected contralateral bias of response strength at baseline (Fig. 2A, HI contralateral vs ipsilateral response maps).
Figure 2.
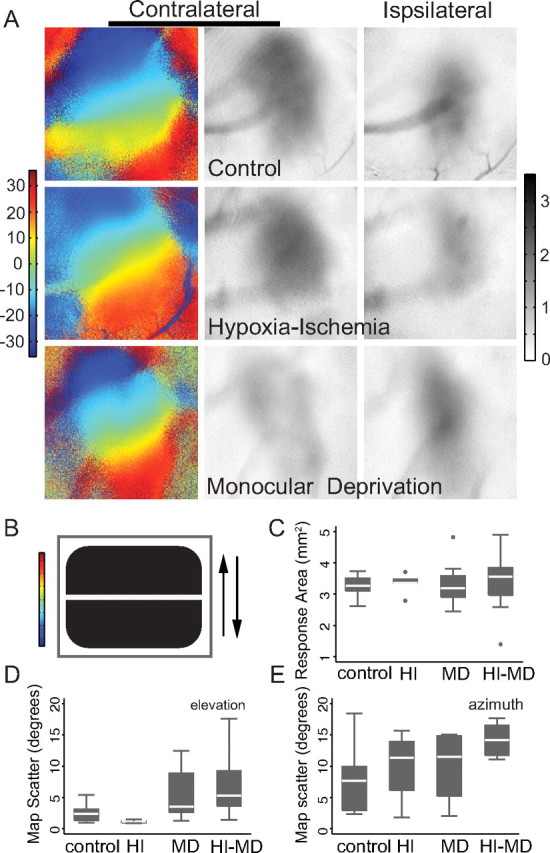
Normal visual cortical map formation following neonatal HI with mild or moderate injury. A, Representative color-coded retinotopic phase maps and gray-scale response magnitude maps for control baseline (unmanipulated), HI-treated baseline, or control monocularly deprived animals demonstrate normal retinotopic organization and response in all conditions. The color-coded phase maps represent stimulation of the contralateral eye with a drifting vertically aligned bar (B). Each position in visual space (−30° to 30° elevation) is assigned a color value and the map of visual space is reproduced in primary visual cortex. The response maps represent the magnitude of response (darker = stronger) to stimulation of either the contralateral eye (middle column) or the ipsilateral eye (right column). C, Box plot summary (median, quartiles, and outliers) of response area across condition. D, E, Map scatter (a measure of map quality; larger values = worse maps) for elevation (D) or azimuth directions (E) across condition.
A subset of both HI-treated (n = 17) and control (n = 9) animals received MD by eyelid suture. MD did not alter the appearance of retinotopic maps (Fig. 2A, monocular deprivation phase map). Brief MD during the critical period shifts the response strength in favor of the undeprived (ipsilateral) eye, representing ocular dominance plasticity (Fig. 2A, MD contralateral vs ipsilateral response maps). Neither HI, nor MD significantly alters the area of cortex that responds to visual stimulation (p = 0.7, one-way ANOVA) (Fig. 2C). Quality of the retinotopic maps can be assessed by smooth progression of the location of visual response to drifting bars (Cang et al., 2005b). Increasing scatter of the response location indicates degradation of the map. MD, but not HI, increases elevation map scatter (p = 0.005, ANOVA). This result is attributable to the expected decrease in response strength of the deprived eye. Azimuth map scatter tended to be worse in animals subjected to HI but this difference was not significant (Fig. 2E). Azimuth map quality appeared worse in general in this study using rats in comparison with prior studies in mice (Cang et al., 2005b).
Neonatal HI with moderate brain injury impairs ocular dominance plasticity
Having confirmed that neonatal cerebral HI with mild/moderate damage does not prevent the development of normal visual cortical response magnitude and organization, we next assessed the effect of neonatal hypoxia or HI on ocular dominance plasticity. To compare the change in eye-specific response following MD (Fig. 3A), we derived an ODI (see Materials and Methods) as described previously (Cang et al., 2005a) for each condition (Fig. 3C). A response driven entirely by the contralateral eye would result in an ODI of 1, while a response restricted to the ipsilateral eye would result in an ODI of −1. In unmanipulated control animals at baseline, the mean ± SD ODI is 0.15 ± 0.07 reflecting the response bias toward contralateral eye input. Neonatal HI does not significantly alter the ODI before induction of plasticity by MD (0.24 ± 0.1, p = 1.0, one-way ANOVA with Bonferroni correction). In littermate control animals without neonatal HI, MD of 5.9 ± 1.6 d was performed at a mean ± SD age of 28.3 ± 3.0 d, resulting in a shift in response in favor of the nondeprived (ipsilateral) eye (Fig. 3A) and a significant decrease in the ODI (−0.10 ± 0.12, p = 0.002, control baseline vs control MD, one-way ANOVA with Bonferroni correction). Animals receiving neonatal hypoxia alone followed by MD displayed a shift in the ODI in favor of the nondeprived eye of similar magnitude to control MD littermates (−0.09 ± 0.07, p = 1.0, one-way ANOVA with Bonferroni correction). In contrast, in animals exposed to neonatal HI resulting in moderate injury, MD failed to induce a shift in the response toward the open eye (Fig. 3B), with a mean ± SD ODI (0.14 ± 0.13) that was not different from control baseline (no HI, no MD) and was significantly different from the shift seen following MD in control animals not exposed to HI (p < 0.001, control MD vs HI MD, one-way ANOVA with Bonferroni correction) and no different from control baseline (no HI, no MD) animals (p = 1.0, control vs HI MD, one-way ANOVA with Bonferroni correction). The durations of MD were similar in the two groups (5.3 ± 1.7 vs 6.1 ± 1.5 d, control MD vs HI MD, p = 0.30, Student's t test). The blockade of cortical plasticity was present only in animals with moderate brain injury and was thus not a nonspecific result of the neonatal HI procedure, as animals treated with HI that developed undetectable or mild injury have a shift in the ODI of similar magnitude to deprived animals not exposed to neonatal HI (−0.20 ± 0.07, p = 0.48, control MD vs HI MD no injury, one-way ANOVA with Bonferroni correction). Imaging results did not differ between anesthesia regimens (urethane vs pentobarbital) (Fig. 3C).
Figure 3.

Neonatal HI with moderate cortical injury impairs ocular dominance plasticity. A, Strengthening (darker = stronger response) of the deprived eye (contralateral, right) and weakening of the undeprived eye (ipsilateral, left) are demonstrated by the response maps following MD in control animals. B, Neonatal HI prevents the shift in responsiveness induced by MD. C, The magnitude of ocular dominance plasticity is summarized as an ODI and represented across condition. Results are plotted on a reversed axis (up = more plasticity) for both urethane (circles) and pentobarbital (triangle) anesthesia regimens. The shaded area indicates the range of baseline ODI.
As an alternative to the categorical grading of injury, we analyzed the association between cortical thickness in area V1 as a continuous measure of injury and impaired cortical plasticity. Cortical thickness is negatively associated with ODI following MD (β = −0.001, p = 0.03, 95% confidence interval −0.002 to −0.00001, linear regression). Analyzing the difference in thickness between contralateral (hypoxia-alone) and ipsilateral (HI) hemispheres identifies an even stronger association between injury and ODI following MD (β = 0.003, p < 0.001, 95% confidence interval 0.002–0.005, linear regression). Impaired ocular dominance plasticity is not the result of a grossly delayed critical period, as brief MD (4–5 d) in mature animals (P60) exposed to neonatal HI did not result in a shift in the ODI toward the open eye (n = 3, mean ± SD ODI 0.20 ± 0.03).
Disrupted development of parvalbumin-expressing inhibitory neurons
Ocular dominance plasticity is known to be dependent upon the normal development of cortical inhibitory neurons [for review, see Hensch and Fagiolini (2005)] and inhibitory neuron development in turn is affected by premature loss of subplate neurons (Kanold and Shatz, 2006). As neonatal HI is associated with subplate neuron loss (McQuillen et al., 2003), we next examined the developmental expression of parvalbumin as a marker of one class of inhibitory interneurons (fast spiking, basket) to determine if the timing or extent of parvalbumin expression was altered by neonatal HI. Parvalbumin is not expressed at high levels in the first postnatal week (Fig. 4A, P7 control). By the second postnatal week, parvalbumin is expressed in all cortical layers, with prominent expression in layer V neuronal dendrites (Fig. 4A, P14 control). After the third postnatal week, parvalbumin-immunoreactive cell bodies are found in all cortical layers, with increased staining in the neuropil at older ages (Fig. 4A, P21, P28, P60 control). Neonatal hypoxia alone does not alter the development of parvalbumin immunoreactivity (Fig. 4A, hypoxia). Although neonatal HI does not alter the onset of parvalbumin expression, the magnitude of parvalbumin expression is decreased and is notably diminished in layer V dendrites at P14 (Fig. 4, P14, HI). At later ages the number of parvalbumin-expressing cell bodies appears reduced, suggesting a possible loss of inhibitory neurons; however, neuropil staining is similar or more intense (Fig. 4A, P21, P28, HI). Parvalbumin expression does not recover by immunohistochemistry after the critical period in mature animals exposed to neonatal HI (Fig. 4A, P60 HI).
Figure 4.
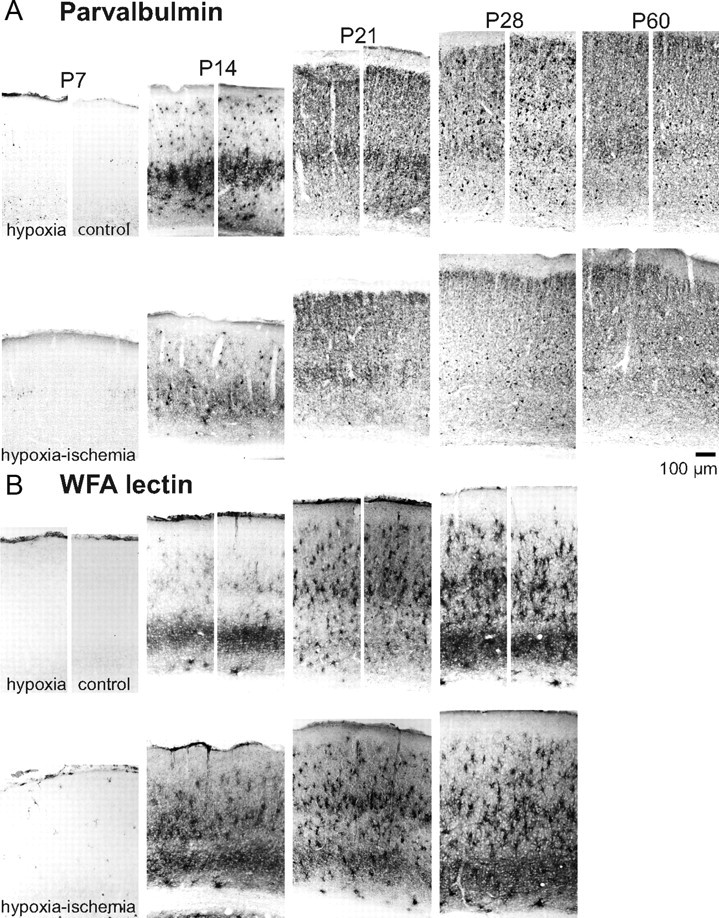
Summary of parvalbumin and perineuronal net development normally and following HI. A, Coronal images of representative parvalbumin immunohistochemistry at weekly postnatal intervals in control (unmanipulated), neonatal hypoxia-alone, and neonatal HI-treated neocortex. B, Coronal images of WFA lectin histochemistry at weekly postnatal intervals in control (unmanipulated), neonatal hypoxia-alone, and neonatal HI-treated neocortex.
Normal development of perineuronal nets following neonatal HI
Parvalbumin expression is regulated by neuronal activity (Jiao et al., 2006) raising the possibility that decreased parvalbumin-expressing cell bodies could represent either loss of cells or decreased expression of the marker. To investigate this possibility, we examined the development of perineuronal nets (PNNs) visualized by binding of the lectin WFA. WFA-labeled PNNs are known to surround parvalbumin-expressing inhibitory neurons (Härtig et al., 1992; Brauer et al., 1993), although a minority are also found surrounding excitatory neurons (Alpár et al., 2006). Like parvalbumin, WFA-labeled PNNs are also not observed in rat neocortex in the first postnatal week (Fig. 4B, P7 control). PNNs begin to form by P14 but do not reach the density seen in adult neocortex until P21. Neonatal HI results in the appearance of scattered cells with the appearance of activated microglia that are detected by WFA-lectin staining only in the first postnatal week (Fig. 4B, P7 HI). Neither neonatal hypoxia alone nor HI alters the timing of PNN development in cortex (Fig. 4B, P7–P28, hypoxia, HI). In contrast to parvalbumin, PNN expression is not diminished following neonatal HI.
No decrease in expression of excitatory markers following neonatal HI
Neocortical pyramidal neurons and excitatory synapses exhibit characteristic changes in the expression of proteins involved in glutamatergic neurotransmission during development (Petralia et al., 2005) and in response to neural activity (Cotrufo et al., 2003). These changes include switching of NMDA receptor subunits and alterations in the expression of presynaptic transporters and postsynaptic density (PSD) proteins. To explore whether the development of excitatory neurons and/or glutamatergic neurotransmission was altered by neonatal HI, we analyzed expression by immunoblot of CaMKIIα, NMDA receptor 2A (NR2A), PSD-95 and vesicular glutamate transporter 1 (VGluT1) at 2 and 4 weeks of age in unmanipulated animals and following hypoxia or HI (Fig. 5A). Consistent with prior reports (Petralia et al., 2005), expression of CaMKIIα, NR2A, and PSD-95 all increase from 2 to 4 weeks of age in unmanipulated animals. Following hypoxia alone or HI, CaMKIIα, NR2A, and VGluT1 levels do not differ from unmanipulated littermate controls, showing normal developmental upregulation. The only significant difference observed is an increase in PSD-95 expression at 4 weeks in both hypoxia and HI exposed hemispheres compared with unmanipulated control animals (actin-normalized OD units ± SD in control = 0.83 ± 0.12 vs H = 1.37 ± 0.17, p = 0.01; vs HI = 1.18 ± 0.18, p = 0.028). Unlike parvalbumin expression and ocular dominance plasticity, which are selectively decreased following HI but not hypoxia (Fig. 3C, 4A), the elevation of PSD-95 expression is observed in both hypoxia and HI hemispheres, making this change unlikely to account for impaired plasticity observed only following HI.
Figure 5.
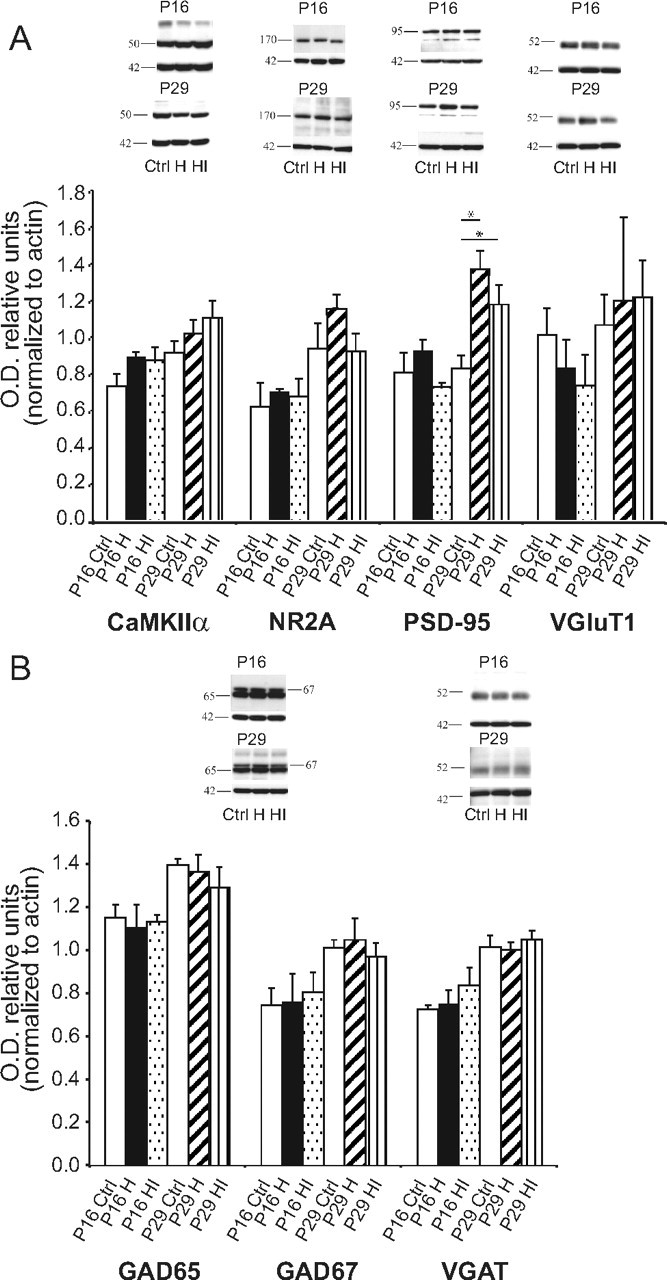
Expression of excitatory or inhibitory markers following HI. A, Summary histograms (mean ± SEM) and representative immunoblot images for expression of markers of excitatory neurons (CaMKIIα, VGluT1), glutamatergic neurotransmission (NR2A, PSD-95), and actin loading control (42 kDa) in control (unmanipulated, white bars), neonatal hypoxia (black bar, P16; diagonal striped bar, P29), and neonatal HI (dotted bar, P16; horizontal striped bar, P29) exposed hemispheres 2 or 4 weeks postinjury. B, Summary histograms (mean ± SEM) and representative immunoblot images for expression of markers of inhibitory neurons and GABAergic neurotransmission (GAD65, GAD67, and VGAT) and actin loading control (42 kDa). *p < 0.05. No changes in these markers were specific to HI.
No decrease in GABA biosynthetic enzymes or transporters
GABA biosynthetic enzymes and reuptake transporters are also developmentally regulated and sensitive to changes in activity (Cotrufo et al., 2003; De Gois et al., 2005). To examine the effect of neonatal HI on these proteins, we measured levels of the 65 kDa and 67 kDa isoforms of glutamic acid decarboxylase (GAD65, GAD67) and vesicular GABA transporter (VGAT) by immunoblot (Fig. 5B). In unmanipulated littermates, expression of GAD65, GAD67, and VGAT increase from 2 to 4 postnatal weeks. Neither hypoxia alone, nor HI alters levels of these proteins at 2 weeks. By 4 weeks, there is a trend to decreased expression of GAD65 and GAD67 in HI hemispheres that does not reach significance.
Decreased parvalbumin expression, not loss of inhibitory neurons
To determine whether parvalbumin-expressing cells were lost following neonatal HI or whether the reduction in parvalbumin immunoreactivity simply reflected decreased expression, we combined fluorescent detection of parvalbumin and WFA-labeled PNNs and quantified the density of cells with the two labels between the hemisphere receiving HI and the hemisphere exposed to hypoxia alone. Single-channel images reproduce the findings of peroxidase histochemistry (Fig. 4A,B): parvalbumin, but not WFA, expression is decreased in the hemisphere receiving HI (Fig. 6A). Although the overall density of WFA-expressing cells did not change, examination of the merged image reveals qualitatively more single-positive WFA-expressing cells (Fig. 6A, merge arrows). To quantify this observation, measurements were made in neocortex at three matched rostral caudal levels from parietal to occipital cortex and averaged (see Materials and Methods). Individual cells were identified by the bisbenzamide nuclear counter stain and determined to be expressing neither parvalbumin nor WFA, a single marker (parvalbumin or WFA) or both markers using an automated algorithm and MetaMorph software (see Materials and Methods). Consistent with limited neocortical damage following P2 HI, bisbenzamide cell densities were similar between hemispheres [1115 ± 78 vs 1144 ± 90 cells/high-power field (HPF), p = 0.46, Student's t test] (Fig. 6C). Parvalbumin-expressing cell density was significantly reduced in the HI hemisphere compared with hypoxia alone (23.4 ± 2.9 vs 35.0 ± 7.3 cells/HPF, p = 0.01, Student's t test) (Fig. 6C), while total (single plus double positive) WFA-expressing cell densities were similar between hemispheres (23.1 ± 2.2 vs 24.8 ± 5.4 cells/HPF, p = 0.55, Student's t test) (Fig. 6C). These results were due to loss of both parvalbumin single-labeled (14.7 ± 2.2 vs 21.7 ± 2.4 cells/HPF, p = 0.05, Student's t test) (Fig. 6B) and double-labeled cells (8.7 ± 1.0 vs 13.3 ± 0.5 cells/HPF, p < 0.001, Student's t test) (Fig. 6B). In contrast, WFA-labeled single-positive cells trended to an increased density in the hemisphere exposed to HI compared with hypoxia alone (14.4 ± 1.9 vs 11.4 ± 1.6 cells/HPF, p = 0.26, Student's t test) (Fig. 6C). Together, the decrease in parvalbumin-expressing cell density with maintenance of total (single- plus double-positive) WFA-expressing cell density supports the hypothesis that this class of inhibitory neurons has not been lost, but is simply expressing less parvalbumin.
Figure 6.

Loss of parvalbumin expression, not cell death. A, Single-channel parvalbumin (red), WFA (green), bisbenzamide (blue), and merged images of combined immunofluorescence in hypoxia- or HI-treated hemispheres. Increased numbers of single-positive WFA stained cells (arrows), despite maintenance of total (single- plus double-positive) WFA numbers, are shown in the HI hemisphere. B, Merged images from both hypoxia- and HI-treated hemispheres of parvalbumin (red), bisbenzamide (blue), and calretinin (green, left) or calbindin (green, right). C, Quantification of single-positive (white bars) and double-positive (gray bars) cell densities in hypoxia- or HI-treated hemispheres. D, Scatter plot of the ocular dominance index (y axis, reverse scale: increased plasticity = up) versus the between-hemisphere difference (hypoxia, HI, x axis) in parvalbumin cell density (closed circles = moderate injury, open circles = mild injury). **p < 0.01. Data plotted are from individual animals presented in A.
Subclasses of inhibitory neurons can be defined by their expression of neuropeptides and calcium binding proteins (Gonchar and Burkhalter, 1997; Markram et al., 2004). In addition to parvalbumin, inhibitory neurons may express calbindin or calretinin (Gonchar and Burkhalter, 1997). To examine whether the effect of neonatal HI was restricted to parvalbumin-expressing inhibitory neurons, or if other classes of inhibitory neurons were also affected, we quantified the density of calbindin and calretinin-expressing cells in adjacent sections from the same animals used for the analysis of parvalbumin and WFA (Fig. 6B). No significant differences were observed between hypoxia-alone and HI hemispheres in the density of calbindin (7.1 ± 2.7 vs 6.9 ± 0.4 cells/HPF, p = 0.9, Student's t test) (Fig. 6C) or calretinin-expressing cells (4.1 ± 0.8 vs 5.0 ± 1.2 cells/HPF, p = 0.1, Student's t test) (Fig. 6C).
Magnitude of parvalbumin loss is correlated with impaired ocular dominance plasticity
To determine whether the magnitude of loss of parvalbumin expression was associated with the magnitude of impaired ocular dominance plasticity, we examined the correlation between the ODI and the difference in parvalbumin cell density between hypoxia-exposed and HI-exposed hemispheres (Fig. 6C). Increasing loss of parvalbumin expression was significantly and linearly correlated with ODI shift in the moderately injured group (Fig. 6C, closed circles) (p = 0.0003, r = 0.99). Among the mildly injured animals, as with animals not exposed to neonatal HI, there was no significant difference in hemispheric parvalbumin density and these animals had intact ODP (Fig. 6C, open circles). Including these animals in the analysis reduces the correlation strength, but the relationship remains significant (p = 0.004, r = 0.82). Cortical thickness is also significantly associated with hemispheric parvalbumin difference (β = −0.04, p = 0.02, 95% confidence interval −0.07 to −0.008, linear regression), as is the difference in hemispheric thickness (β = 0.06, p = 0.01, 95% confidence interval 0.02–0.10, linear regression).
Quantitative analysis of single-unit recordings reveals unchanged, highly selective response properties despite diminished overall responsiveness following neonatal HI
To explore the functional consequences of altered parvalbumin expression following HI, we recorded 101 isolated single units from V1 in HI and unmanipulated animals using linear 16-channel multielectrodes (Fig. 7A). Animals exposed to neonatal HI were selected for a moderate pattern of injury on MRI at P3 (see Materials and Methods). Postrecording cortical thickness (mean ± SD = 1193 ± 109 μm) and hemispheric difference in parvalbumin cell density (mean ± SD = 10.5 ± 3.6 cells per HPF) were representative of the moderate injury group, although by histology two animals showed injury patterns that were more severe than typical. Electrodes were placed at a fixed depth spanning all cortical layers. Laminar localization was determined using current source density (CSD) analysis of the local field potential (LFP) recorded at each electrode site during presentation of a contrast reversing checkerboard pattern as described previously (Niell and Stryker, 2008). This allowed localization of layer 4, in which sensory input first arrives, spreading into layer 2/3. Visually responsive units were observed across all cortical layers.
Figure 7.
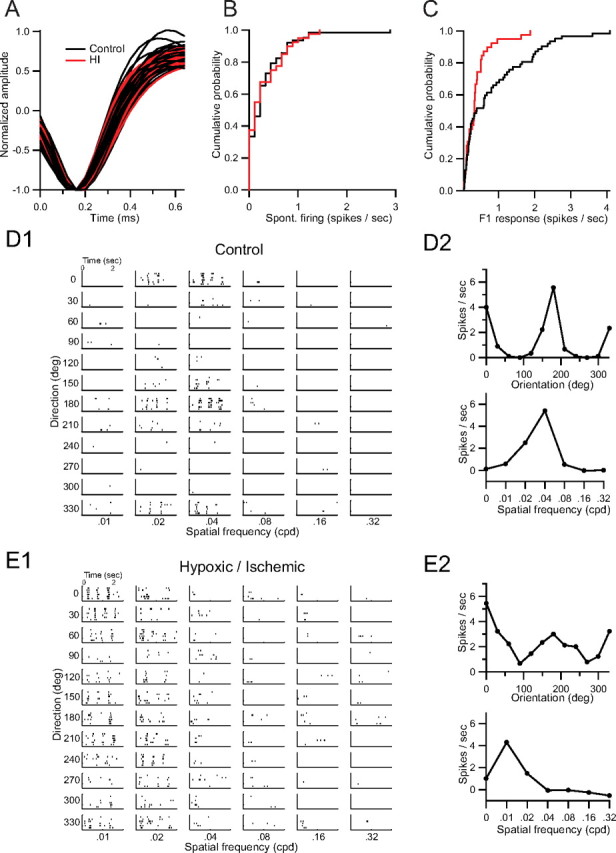
A, Aligned spike waveforms from control (black) and HI-treated (red) animals. B, Cumulative probability distribution of average spontaneous firing occurring during presentation of a blank stimulus. C, Cumulative probability distribution of peak firing rates in response to a contrast-modulated noise movie. D1, D2, Rasters (D1) and orientation and spatial frequency selectivity (D2) of a tuned, selective cell from a control animal. E1, E2, Rasters (E1) and orientation and spatial frequency selectivity (E2) of a tuned, selective cell from an HI-treated animal.
Fewer active units per electrode penetration were observed in HI animals (n = 39 units, 5 animals, 5 penetrations) than control animals (n = 62 units, 4 animals, 5 penetrations). To measure orientation and spatial selectivity we presented drifting sinusoidal gratings. Blank stimuli were included to measure spontaneous activity. Mean and distribution of spontaneous firing rates were the same for control and HI animals (mean ± SD control = 0.32 ± 0.46 spikes/s, HI = 0.27 ± 0.34 spikes/s) (Fig. 7B), indicating an absence of excitatory/inhibitory imbalance or widespread epileptiform activity in visual cortex of HI animals.
We calculated an orientation tuning curve at the spatial frequency yielding the highest response. Units were classified as visually responsive to gratings if the peak of the tuning curve exceeded 2 spikes/s. Response of individual units to drifting gratings was not qualitatively different between groups (Fig. 7D1, E1). Specifically, we found no evidence of prolonged discharge to visual stimulation. We observed a smaller proportion of visually responsive units in HI (30%; n = 12 units) than in control animals (56%; n = 36 units). However, the mean OSI (see Materials and Methods) of responsive units was not significantly different between control and HI animals (mean ± SD control = 0.56 ± 0.29, HI = 0.67 ± 0.34). Further, the half-width at half-maximum of the responsive component of the tuning curve was not different between groups (mean ± SD control = 29.78 ± 8.39°, HI = 32.35 ± 11.49°). This suggests that mechanisms leading to the development of well-tuned responses are intact in HI animals.
To further examine the response properties of units in V1, we next presented stimuli consisting of stochastic noise at a range of spatial and temporal frequencies (0.05–0.12 cycles per degree; 4 Hz). This “noise movie” was modulated sinusoidally from 0 to maximal contrast, leading to a periodic modulation of firing rate in visually responsive cells. The peak response of a unit occurred at the frequency of contrast modulation (F1, the first harmonic at 0.1 Hz). The distribution of peak responses was significantly shifted toward lower values in HI than control animals (Fig. 7C) (p = 0.006, Kolmogorov–Smirnov test). Next, we explored whether this population shift was due to overall reduced amplitude of responses in HI animals. Responsive units fire more with increasing stimulus contrast, leading us to classify a unit as responsive if its phase fell within ±30° of the mean phase for all units. Using these criteria, we deemed 16 of the control and 12 of the HI units not to be responsive to the stimulus. The average F1 response of the remaining phase-matched units was markedly reduced in HI animals (mean ± SD control = 1.09 ± 1.00, HI = 0.42 ± 0.37 spikes/s, p = 0.006, Mann–Whitney U test). The lower percentage of visually responsive units suggests diminished responsiveness of visual cortex following neonatal HI.
Discussion
Neonatal hypoxic ischemic brain injury often results in pervasive neurodevelopmental impairment even with the existence of unique plasticity mechanisms in the developing brain that might contribute to recovery from injury. Following injury, many aspects of cortical development proceed normally despite extensive subplate neuron loss, including the development of precise retinotopic maps, observed in the present study in all but the most severely injured animals, the upregulation of many activity-regulated proteins involved in excitatory or inhibitory neurotransmission and the establishment of highly selective visual responses. In this rodent model of neonatal HI, animals with moderate cortical damage exhibit impaired ocular dominance plasticity and this impairment is associated with defective development of parvalbumin-expressing inhibitory neurons. Despite this alteration of inhibitory neuron phenotype, baseline neuronal activity is unchanged and overall activation in visual cortex is diminished. These findings provide a link between a translational model of very early hypoxic–ischemic brain injury and emerging understanding of the maturation of cortical circuits involved in structural plasticity. The results may also provide insight into deficits noted in children suffering neonatal brain injury including cortical visual impairment and learning disability. Finally, these results suggest ocular dominance plasticity is an outcome measure for studies of early brain injury that may be useful for selecting and evaluating interventions aimed at repair and recovery.
Cortical inhibition is necessary for ocular dominance plasticity
During the initial postnatal weeks of cortical development, both glutamatergic (Arumugam et al., 2005; Luján et al., 2005) and GABAergic (Ben-Ari, 2002) signaling undergo major developmental changes manifested in alterations of the expression levels of many proteins in these pathways. In this dynamic period, a balance of excitation and inhibition is necessary for experience dependent cortical plasticity (Hensch, 2005). Appreciation of the unique role of cortical inhibition has emerged from experiments with genetically modified mice lacking the inducible isoform of the GABA biosynthetic enzyme, GAD65 (Hensch et al., 1998), overexpressing the neurotrophin BDNF (Hanover et al., 1999) or following pharmacologic manipulation of inhibition (Hata and Stryker, 1994; Hensch et al., 1998; Fagiolini and Hensch, 2000). These experimental models all disrupt activity-dependent cortical plasticity through separate manipulations of the development of inhibition or the balance of excitation and inhibition. The present results extend from a model not previously known to preferentially affect excitatory or inhibitory networks. The Rice–Vannucci procedure performed at postnatal day 3 or earlier leads to damage focused in the subplate and intermediate zone with loss of subplate neurons (McQuillen et al., 2003) and preoligodendrocytes (Back et al., 2002). Deep layers of neocortex (V/VI) are injured only in severely affected animals and superficial layers (I–IV) are thought to be unaffected (McQuillen et al., 2003; Sizonenko et al., 2003). We find not only that early cerebral HI impairs subsequent ocular dominance plasticity, but also that this impairment is tightly linked to decreased expression of the inhibitory neuron marker parvalbumin. In fact, in the moderately injured group, the loss of parvalbumin expression explains >95% of the variance in ocular dominance plasticity following HI and MD, providing evidence for a link between development of inhibition and experience-dependent plasticity in a translational model of human disease.
GAD65 knock-out mice display enhanced cortical activation in the form of prolonged discharges in response to visual stimuli (Hensch et al., 1998). Despite this defect, many aspects of visual cortical organization and function develop normally including retinotopy, baseline activity and orientation selectivity (Hensch et al., 1998). This normal development in GAD65 knock-out mice should not be surprising because there is little or no cortical expression of GAD65 before P6, during the period of map formation (Kiser et al., 1998). Although neonatal HI results in diminished parvalbumin expression, we do not find any evidence for excessive cortical activity resulting from diminished inhibition. Specifically, we did not observe prolonged discharges of single neurons, altered spontaneous activity or alterations in the expression of activity-regulated proteins. In fact, neonatal HI resulted in reduced visual cortical responses even to an optimal visual stimulus. Results from these two models indicate that impaired ocular dominance plasticity can be associated with alterations of cortical responsiveness in either direction.
Neonatal HI occurs during a developmental period when GABAergic signaling is depolarizing and involved in the maturation of cortical circuits, synapses and excitatory neurotransmission (for review, see Akerman and Cline (2007)]. GAD65 is not involved at this early stage of maturation. Following neonatal HI, we observed that both parvalbumin expression and cortical responsiveness are reduced. Neuronal activity is known to regulate parvalbumin expression (Jiao et al., 2006), suggesting that altered inhibition might result from a primary defect of cortical activation. However, this decrease in cortical activation is not severe enough to interfere with other aspects of activity-dependent visual cortical development including retinotopic organization, orientation selectivity and maturation of glutamatergic and GABAergic signaling pathways. Defects in the development of both cortical activation and inhibition have been observed following neonatal subplate neuron ablation.
Activity-dependent development of cortical inhibition: a role for subplate neurons?
Subplate neurons are incorporated into a transient circuit receiving innervation from and projecting to thalamus, as well as sending a recurrent collateral to layer IV (Allendoerfer and Shatz, 1994). A hypothesis for the function of this transient circuit is that subplate neurons may provide ‘gain control’ over nascent thalamocortical innervation and serve to strengthen developing thalamic inputs (Kanold and Shatz, 2006). During early postnatal weeks, cortical glutamatergic neurotransmission is immature and weak (Luján et al., 2005). Neocortical neurons are closely coupled by gap-junctions and are capable of spontaneous propagating network oscillations that arise in the subplate (Dupont et al., 2006). Neocortical gap junction downregulation is driven by increased signaling through the NMDA receptor (Arumugam et al., 2005) and a shift to NMDA-dependent network oscillations in neocortex coincides with the normal developmental disappearance of subplate neurons (Dupont et al., 2006). Premature loss of subplate neurons therefore would be predicted to diminish early cortical activity, a hypothesis confirmed by direct recordings of visually evoked single-unit activity in the present results. The alternative explanation that parvalbumin-expressing cells have died in response to HI appears unlikely in light of the facts that density of WFA-labeled perineuronal nets were unchanged following HI and that a majority of PNNs surround parvalbumin-expressing cells (Härtig et al., 1992).
Injections of the glutamatergic excitotoxin, kainic acid (Chun and Shatz, 1988) or a specific immunotoxin (Kanold et al., 2003) have been used to destroy subplate neurons in developing neocortex of kittens. When performed in the neonatal period, this manipulation dramatically reduces cortical responsiveness (Kanold et al., 2003) and prevents the segregation of ocular dominance columns (Ghosh and Shatz, 1992) and the refinement of orientation maps (Kanold et al., 2003), processes known to require neuronal activity (Stryker and Harris, 1986; Ruthazer and Stryker, 1996). Kanold and Shatz have demonstrated that neonatal subplate neuron ablation, which results in weak or absent visual responses, also shows defective development of the glutamatergic thalamic axon to layer IV synapse (Kanold et al., 2003) that includes diminished layer IV expression of a potassium-chloride cotransporter (KCC2) required for GABA-induced hyperpolarization and a specific GABA receptor subunit (GABAAα1) (Kanold and Shatz, 2006) essential for plasticity (Fagiolini et al., 2004). These changes lead to anatomical plasticity (Kanold and Shatz, 2006) of a form that could not be evaluated in the present study because rodents lack ocular dominance columns (Antonini et al., 1999). The removal of subplate neurons is more complete following kainic acid injection in kitten (Lein et al., 1999), compared with neonatal HI in rodent (McQuillen et al., 2003) and the reduction of cortical responsiveness and selectivity is much more dramatic (Kanold et al., 2003). Finally, neonatal HI produces a spectrum of injury and leads to death of other cell types than subplate neurons, including preoligodendrocytes (Back et al., 2002) and deep layer neurons in the more severe cases.
Limitations and clinical relevance of the model
A limitation of the present results relates to the inherent variability in the Rice–Vannucci model of HI that results in animals with a range of injury (Towfighi et al., 1997; McQuillen et al., 2003). To account for this variability, both categorical and continuous measurements of injury severity have been analyzed with similar conclusions drawn from each approach. This experimental weakness however, strengthens the translational value of the model as it reproduces variability observed in human neonatal HI (Ferriero, 2004). A minority of animals with severe injury had absent visual responses, a condition reminiscent of cortical visual impairment observed occasionally in premature infants with periventricular leukomalacia resulting from neonatal brain injury (Cioni et al., 1997; Lanzi et al., 1998). Disrupted plasticity observed in moderately injured animals may be a mechanism that limits recovery from injury, contributing to widespread impairments noted across multiple cognitive domains in newborns with extreme prematurity (Hack et al., 2002; van Baar et al., 2005).
In summary, we observed impaired ocular dominance plasticity in animals with moderate cortical injury following neonatal HI and the magnitude of impaired plasticity was tightly linked to a loss of parvalbumin expression. Despite altered inhibitory neuron phenotype, baseline neuronal activity and many physiologic characteristics of mature visual cortex were normal, while visually evoked activity was reduced. Together with the enhanced cortical activation observed in GAD65 knock-out mice (Hensch et al., 1998), these results suggest that ocular dominance plasticity may be uniquely dependent upon precise regulation of cortical activation. Impaired inhibitory neuron development and subplate neuron death seen in this model and the related cat kainate model suggest a specific disruption of a unique, transient developmental circuit. A goal of this translational investigation is to develop clinically relevant strategies that restore plasticity and improve outcome. Persistent disruption of ocular dominance plasticity following a different neonatal manipulation (alcohol exposure) has been reported in a ferret model (Medina et al., 2003, 2005; Medina and Ramoa, 2005). Importantly, in this model plasticity could be restored by a pharmacologic treatment (phosphodiesterase type 1 inhibitor) (Medina et al., 2006). Strategies to improve outcome by prevention of neonatal subplate neuron injury will be dependent upon identifying mechanisms of subplate neuron selective vulnerability, such as the expression of GluR2-lacking AMPA receptors (Talos et al., 2006). Alternatively, the present results suggest the paradoxical ideas that treatment with a use-dependent GABA agonist (e.g., diazepam) or interventions to augment cortical activation may be therapies worthy of further study to restore activity-dependent plasticity following injury.
Footnotes
This work was supported by National Institutes of Health Grants K02 NS047098 and 5R01NS060896 to P.S.M. J.C. was an Aventis Pharmaceuticals Fellow of the Life Sciences Research Foundation and was supported by a Knights Templar Eye Foundation Pediatric Ophthalmology Research Grant.
References
- Akerman CJ, Cline HT. Refining the roles of GABAergic signaling during neural circuit formation. Trends Neurosci. 2007;30:382–389. doi: 10.1016/j.tins.2007.06.002. [DOI] [PubMed] [Google Scholar]
- Allendoerfer KL, Shatz CJ. The subplate, a transient neocortical structure: its role in the development of connections between thalamus and cortex. Annu Rev Neurosci. 1994;17:185–218. doi: 10.1146/annurev.ne.17.030194.001153. [DOI] [PubMed] [Google Scholar]
- Alpár A, Gärtner U, Härtig W, Brückner G. Distribution of pyramidal cells associated with perineuronal nets in the neocortex of rat. Brain Res. 2006;1120:13–22. doi: 10.1016/j.brainres.2006.08.069. [DOI] [PubMed] [Google Scholar]
- Antonini A, Fagiolini M, Stryker MP. Anatomical correlates of functional plasticity in mouse visual cortex. J Neurosci. 1999;19:4388–4406. doi: 10.1523/JNEUROSCI.19-11-04388.1999. [DOI] [PMC free article] [PubMed] [Google Scholar]
- Arumugam H, Liu X, Colombo PJ, Corriveau RA, Belousov AB. NMDA receptors regulate developmental gap junction uncoupling via CREB signaling. Nat Neurosci. 2005;8:1720–1726. doi: 10.1038/nn1588. [DOI] [PubMed] [Google Scholar]
- Back SA, Han BH, Luo NL, Chricton CA, Xanthoudakis S, Tam J, Arvin KL, Holtzman DM. Selective vulnerability of late oligodendrocyte progenitors to hypoxia–ischemia. J Neurosci. 2002;22:455–463. doi: 10.1523/JNEUROSCI.22-02-00455.2002. [DOI] [PMC free article] [PubMed] [Google Scholar]
- Ben-Ari Y. Excitatory actions of gaba during development: the nature of the nurture. Nat Rev Neurosci. 2002;3:728–739. doi: 10.1038/nrn920. [DOI] [PubMed] [Google Scholar]
- Brainard DH. The Psychophysics Toolbox. Spat Vis. 1997;10:433–436. [PubMed] [Google Scholar]
- Brauer K, Härtig W, Bigl V, Brückner G. Distribution of parvalbumin-containing neurons and lectin-binding perineuronal nets in the rat basal forebrain. Brain Res. 1993;631:167–170. doi: 10.1016/0006-8993(93)91205-7. [DOI] [PubMed] [Google Scholar]
- Cang J, Kalatsky VA, Löwel S, Stryker MP. Optical imaging of the intrinsic signal as a measure of cortical plasticity in the mouse. Vis Neurosci. 2005a;22:685–691. doi: 10.1017/S0952523805225178. [DOI] [PMC free article] [PubMed] [Google Scholar]
- Cang J, Rentería RC, Kaneko M, Liu X, Copenhagen DR, Stryker MP. Development of precise maps in visual cortex requires patterned spontaneous activity in the retina. Neuron. 2005b;48:797–809. doi: 10.1016/j.neuron.2005.09.015. [DOI] [PMC free article] [PubMed] [Google Scholar]
- Cang J, Niell CM, Liu X, Pfeiffenberger C, Feldheim DA, Stryker MP. Selective disruption of one cartesian axis of cortical maps and receptive fields by deficiency in ephrin-As and structured activity. Neuron. 2008;57:511–523. doi: 10.1016/j.neuron.2007.12.025. [DOI] [PMC free article] [PubMed] [Google Scholar]
- Chun JJ, Shatz CJ. A fibronectin-like molecule is present in the developing cat cerebral cortex and is correlated with subplate neurons. J Cell Biol. 1988;106:857–872. doi: 10.1083/jcb.106.3.857. [DOI] [PMC free article] [PubMed] [Google Scholar]
- Cioni G, Fazzi B, Coluccini M, Bartalena L, Boldrini A, van Hof-van Duin J. Cerebral visual impairment in preterm infants with periventricular leukomalacia. Pediatr Neurol. 1997;17:331–338. doi: 10.1016/s0887-8994(97)00152-5. [DOI] [PubMed] [Google Scholar]
- Cotrufo T, Viegi A, Berardi N, Bozzi Y, Mascia L, Maffei L. Effects of neurotrophins on synaptic protein expression in the visual cortex of dark-reared rats. J Neurosci. 2003;23:3566–3571. doi: 10.1523/JNEUROSCI.23-09-03566.2003. [DOI] [PMC free article] [PubMed] [Google Scholar]
- De Gois S, Schäfer MK, Defamie N, Chen C, Ricci A, Weihe E, Varoqui H, Erickson JD. Homeostatic scaling of vesicular glutamate and GABA transporter expression in rat neocortical circuits. J Neurosci. 2005;25:7121–7133. doi: 10.1523/JNEUROSCI.5221-04.2005. [DOI] [PMC free article] [PubMed] [Google Scholar]
- Dupont E, Hanganu IL, Kilb W, Hirsch S, Luhmann HJ. Rapid developmental switch in the mechanisms driving early cortical columnar networks. Nature. 2006;439:79–83. doi: 10.1038/nature04264. [DOI] [PubMed] [Google Scholar]
- Fagiolini M, Hensch TK. Inhibitory threshold for critical-period activation in primary visual cortex. Nature. 2000;404:183–186. doi: 10.1038/35004582. [DOI] [PubMed] [Google Scholar]
- Fagiolini M, Pizzorusso T, Berardi N, Domenici L, Maffei L. Functional postnatal development of the rat primary visual cortex and the role of visual experience: dark rearing and monocular deprivation. Vision Res. 1994;34:709–720. doi: 10.1016/0042-6989(94)90210-0. [DOI] [PubMed] [Google Scholar]
- Fagiolini M, Fritschy JM, Löw K, Möhler H, Rudolph U, Hensch TK. Specific GABAA circuits for visual cortical plasticity. Science. 2004;303:1681–1683. doi: 10.1126/science.1091032. [DOI] [PubMed] [Google Scholar]
- Feller MB, Scanziani M. A precritical period for plasticity in visual cortex. Curr Opin Neurobiol. 2005;15:94–100. doi: 10.1016/j.conb.2005.01.012. [DOI] [PubMed] [Google Scholar]
- Ferriero DM. Neonatal brain injury. N Engl J Med. 2004;351:1985–1995. doi: 10.1056/NEJMra041996. [DOI] [PubMed] [Google Scholar]
- Ghosh A, Shatz CJ. Involvement of subplate neurons in the formation of ocular dominance columns. Science. 1992;255:1441–1443. doi: 10.1126/science.1542795. [DOI] [PubMed] [Google Scholar]
- Gonchar Y, Burkhalter A. Three distinct families of GABAergic neurons in rat visual cortex. Cereb Cortex. 1997;7:347–358. doi: 10.1093/cercor/7.4.347. [DOI] [PubMed] [Google Scholar]
- Hack M, Flannery DJ, Schluchter M, Cartar L, Borawski E, Klein N. Outcomes in young adulthood for very-low-birth-weight infants. N Engl J Med. 2002;346:149–157. doi: 10.1056/NEJMoa010856. [DOI] [PubMed] [Google Scholar]
- Hanover JL, Huang ZJ, Tonegawa S, Stryker MP. Brain-derived neurotrophic factor overexpression induces precocious critical period in mouse visual cortex. J Neurosci. 1999;19(RC40) doi: 10.1523/JNEUROSCI.19-22-j0003.1999. [DOI] [PMC free article] [PubMed] [Google Scholar]
- Harris KD, Henze DA, Csicsvari J, Hirase H, Buzsáki G. Accuracy of tetrode spike separation as determined by simultaneous intracellular and extracellular measurements. J Neurophysiol. 2000;84:401–414. doi: 10.1152/jn.2000.84.1.401. [DOI] [PubMed] [Google Scholar]
- Härtig W, Brauer K, Brückner G. Wisteria floribunda agglutinin-labelled nets surround parvalbumin-containing neurons. Neuroreport. 1992;3:869–872. doi: 10.1097/00001756-199210000-00012. [DOI] [PubMed] [Google Scholar]
- Hata Y, Stryker MP. Control of thalamocortical afferent rearrangement by postsynaptic activity in developing visual cortex. Science. 1994;265:1732–1735. doi: 10.1126/science.8085163. [DOI] [PubMed] [Google Scholar]
- Hensch TK. Critical period plasticity in local cortical circuits. Nat Rev Neurosci. 2005;6:877–888. doi: 10.1038/nrn1787. [DOI] [PubMed] [Google Scholar]
- Hensch TK, Fagiolini M. Excitatory-inhibitory balance and critical period plasticity in developing visual cortex. Prog Brain Res. 2005;147:115–124. doi: 10.1016/S0079-6123(04)47009-5. [DOI] [PubMed] [Google Scholar]
- Hensch TK, Fagiolini M, Mataga N, Stryker MP, Baekkeskov S, Kash SF. Local GABA circuit control of experience-dependent plasticity in developing visual cortex. Science. 1998;282:1504–1508. doi: 10.1126/science.282.5393.1504. [DOI] [PMC free article] [PubMed] [Google Scholar]
- Jiao Y, Zhang C, Yanagawa Y, Sun QQ. Major effects of sensory experiences on the neocortical inhibitory circuits. J Neurosci. 2006;26:8691–8701. doi: 10.1523/JNEUROSCI.2478-06.2006. [DOI] [PMC free article] [PubMed] [Google Scholar]
- Kalatsky VA, Stryker MP. New paradigm for optical imaging: temporally encoded maps of intrinsic signal. Neuron. 2003;38:529–545. doi: 10.1016/s0896-6273(03)00286-1. [DOI] [PubMed] [Google Scholar]
- Kanold PO, Kara P, Reid RC, Shatz CJ. Role of subplate neurons in functional maturation of visual cortical columns. Science. 2003;301:521–525. doi: 10.1126/science.1084152. [DOI] [PubMed] [Google Scholar]
- Kanold PO, Shatz CJ. Subplate neurons regulate maturation of cortical inhibition and outcome of ocular dominance plasticity. Neuron. 2006;51:627–638. doi: 10.1016/j.neuron.2006.07.008. [DOI] [PubMed] [Google Scholar]
- Kiser PJ, Cooper NG, Mower GD. Expression of two forms of glutamic acid decarboxylase (GAD67 and GAD65) during postnatal development of rat somatosensory barrel cortex. J Comp Neurol. 1998;402:62–74. [PubMed] [Google Scholar]
- Lanzi G, Fazzi E, Uggetti C, Cavallini A, Danova S, Egitto MG, Ginevra OF, Salati R, Bianchi PE. Cerebral visual impairment in periventricular leukomalacia. Neuropediatrics. 1998;29:145–150. doi: 10.1055/s-2007-973551. [DOI] [PubMed] [Google Scholar]
- Lein ES, Finney EM, McQuillen PS, Shatz CJ. Subplate neuron ablation alters neurotrophin expression and ocular dominance column formation. Proc Natl Acad Sci U S A. 1999;96:13491–13495. doi: 10.1073/pnas.96.23.13491. [DOI] [PMC free article] [PubMed] [Google Scholar]
- Luján R, Shigemoto R, López-Bendito G. Glutamate and GABA receptor signalling in the developing brain. Neuroscience. 2005;130:567–580. doi: 10.1016/j.neuroscience.2004.09.042. [DOI] [PubMed] [Google Scholar]
- Markram H, Toledo-Rodriguez M, Wang Y, Gupta A, Silberberg G, Wu C. Interneurons of the neocortical inhibitory system. Nat Rev Neurosci. 2004;5:793–807. doi: 10.1038/nrn1519. [DOI] [PubMed] [Google Scholar]
- McQuillen PS, Sheldon RA, Shatz CJ, Ferriero DM. Selective vulnerability of subplate neurons after early neonatal hypoxia–ischemia. J Neurosci. 2003;23:3308–3315. doi: 10.1523/JNEUROSCI.23-08-03308.2003. [DOI] [PMC free article] [PubMed] [Google Scholar]
- Medina AE, Ramoa AS. Early alcohol exposure impairs ocular dominance plasticity throughout the critical period. Brain Res Dev Brain Res. 2005;157:107–111. doi: 10.1016/j.devbrainres.2005.03.012. [DOI] [PubMed] [Google Scholar]
- Medina AE, Krahe TE, Coppola DM, Ramoa AS. Neonatal alcohol exposure induces long-lasting impairment of visual cortical plasticity in ferrets. J Neurosci. 2003;23:10002–10012. doi: 10.1523/JNEUROSCI.23-31-10002.2003. [DOI] [PMC free article] [PubMed] [Google Scholar]
- Medina AE, Krahe TE, Ramoa AS. Early alcohol exposure induces persistent alteration of cortical columnar organization and reduced orientation selectivity in the visual cortex. J Neurophysiol. 2005;93:1317–1325. doi: 10.1152/jn.00714.2004. [DOI] [PubMed] [Google Scholar]
- Medina AE, Krahe TE, Ramoa AS. Restoration of neuronal plasticity by a phosphodiesterase type 1 inhibitor in a model of fetal alcohol exposure. J Neurosci. 2006;26:1057–1060. doi: 10.1523/JNEUROSCI.4177-05.2006. [DOI] [PMC free article] [PubMed] [Google Scholar]
- Morales B, Choi SY, Kirkwood A. Dark rearing alters the development of GABAergic transmission in visual cortex. J Neurosci. 2002;22:8084–8090. doi: 10.1523/JNEUROSCI.22-18-08084.2002. [DOI] [PMC free article] [PubMed] [Google Scholar]
- Niell CM, Stryker MP. Highly selective receptive fields in mouse visual cortex. J Neurosci. 2008;28:7520–7536. doi: 10.1523/JNEUROSCI.0623-08.2008. [DOI] [PMC free article] [PubMed] [Google Scholar]
- Paxinos G, Watson C. The rat brain in stereotaxic coordinates. Boston: Elsevier Academic; 2005. [Google Scholar]
- Pelli DG. The VideoToolbox software for visual psychophysics: transforming numbers into movies. Spat Vis. 1997;10:437–442. [PubMed] [Google Scholar]
- Petralia RS, Sans N, Wang YX, Wenthold RJ. Ontogeny of postsynaptic density proteins at glutamatergic synapses. Mol Cell Neurosci. 2005;29:436–452. doi: 10.1016/j.mcn.2005.03.013. [DOI] [PMC free article] [PubMed] [Google Scholar]
- Ruthazer ES, Stryker MP. The role of activity in the development of long-range horizontal connections in area 17 of the ferret. J Neurosci. 1996;16:7253–7269. doi: 10.1523/JNEUROSCI.16-22-07253.1996. [DOI] [PMC free article] [PubMed] [Google Scholar]
- Sizonenko SV, Sirimanne E, Mayall Y, Gluckman PD, Inder T, Williams C. Selective cortical alteration after hypoxic-ischemic injury in the very immature rat brain. Pediatr Res. 2003;54:263–269. doi: 10.1203/01.PDR.0000072517.01207.87. [DOI] [PubMed] [Google Scholar]
- Sizonenko SV, Camm EJ, Dayer A, Kiss JZ. Glial responses to neonatal hypoxic-ischemic injury in the rat cerebral cortex. Int J Dev Neurosci. 2008;26:37–45. doi: 10.1016/j.ijdevneu.2007.08.014. [DOI] [PubMed] [Google Scholar]
- Stryker MP, Harris WA. Binocular impulse blockade prevents the formation of ocular dominance columns in cat visual cortex. J Neurosci. 1986;6:2117–2133. doi: 10.1523/JNEUROSCI.06-08-02117.1986. [DOI] [PMC free article] [PubMed] [Google Scholar]
- Talos DM, Fishman RE, Park H, Folkerth RD, Follett PL, Volpe JJ, Jensen FE. Developmental regulation of alpha-amino-3-hydroxy-5-methyl-4-isoxazole-propionic acid receptor subunit expression in forebrain and relationship to regional susceptibility to hypoxic/ischemic injury. I. Rodent cerebral white matter and cortex. J Comp Neurol. 2006;497:42–60. doi: 10.1002/cne.20972. [DOI] [PMC free article] [PubMed] [Google Scholar]
- Towfighi J, Mauger D, Vannucci RC, Vannucci SJ. Influence of age on the cerebral lesions in an immature rat model of cerebral hypoxia-ischemia: a light microscopic study. Brain Res Dev Brain Res. 1997;100:149–160. doi: 10.1016/s0165-3806(97)00036-9. [DOI] [PubMed] [Google Scholar]
- van Baar AL, van Wassenaer AG, Briët JM, Dekker FW, Kok JH. Very preterm birth is associated with disabilities in multiple developmental domains. J Pediatr Psychol. 2005;30:247–255. doi: 10.1093/jpepsy/jsi035. [DOI] [PubMed] [Google Scholar]
- Wendland MF, Faustino J, West T, Manabat C, Holtzman DM, Vexler ZS. Early diffusion-weighted MRI as a predictor of caspase-3 activation after hypoxic-ischemic insult in neonatal rodents. Stroke. 2008;39:1862–1868. doi: 10.1161/STROKEAHA.107.506352. [DOI] [PMC free article] [PubMed] [Google Scholar]