

Abstract
The biodistribution of approved gadolinium (Gd) based contrast agents (GBCA) is reviewed. After intravenous injection GBCA distribute in the blood and the extracellular space and transiently through the excretory organs. Preclinical animal studies and the available clinical literature indicate that all these compounds are excreted intact. Elimination tends to be rapid and for the most part, complete. In renally insufficient patients the plasma elimination half-life increases substantially from hours to days depending on renal function. In patients with impaired renal function and nephrogenic systemic fibrosis (NSF), the agents gadodiamide, gadoversetamide, and gadopentetate dimeglumine have been shown to result in Gd deposition in the skin and internal organs. In these cases, it is likely that the Gd is no longer present as the GBCA, but this has still not been definitively shown. In preclinical models very small amounts of Gd are retained in the bone and liver, and the amount retained correlates with the kinetic and thermodynamic stability of the GBCA with respect to Gd release in vitro. The pattern of residual Gd deposition in NSF subjects may be different than that observed in preclinical rodent models. GBCA are designed to be used via intravenous administration. Altering the route of administration and/or the formulation of the GBCA can dramatically alter the biodistribution of the GBCA and can increase the likelihood of Gd deposition.
Keywords: gadolinium, biodistribution, MRI, nephrogenic systemic fibrosis, retention
INTRODUCTION
Approximately 25–30% of all MRI scans today use some kind of non-specific gadolinium-based contrast agent (GBCA) (1). The contrast agent typically makes diseased tissue appear brighter (or in some cases darker) than the surrounding tissue. The first approved contrast agent, GdDTPA (gadopentetate dimeglumine, Magnevist®) appeared in 1988 and several other compounds followed. The first contrast agents were extracellular fluid (ECF) agents, followed by compounds designed for liver imaging and compounds given orally for gastrointestinal imaging. There are currently several compounds in clinical trials and one recently approved that are designed specifically to enhance MR angiography. At the preclinical stage there are exciting advancements in molecular imaging agents that also utilize gadolinium.
Route of Administration
All GBCA are administered intravenously. The studies that are described in this review all use intravenous (i.v.) administration. The route of administration has a major impact on biodistribution and safety. It is important to keep this in mind when considering alternative uses of GBCAs such as in labeling cells for cell tracking studies.
Dose and Exposure
“All things are poison and nothing is without poison, only the dose permits something not to be poisonous.” – Paracelsus
Most GBCAs are approved at a dose of 0.1 mmol Gd/kg. For MR angiography double and triple this dose are sometimes used. Newer agents like gadofosveset and gadoxetic acid are approved at lower doses (0.03 mmol/kg and 0.025 mmol/kg, respectively). The dose will obviously impact how much Gd the subject receives. Related to this is exposure and this depends on how fast the compound is eliminated. All the GBCAs exhibit biexponential plasma kinetics. There is a distribution (alpha) phase followed by an elimination (beta) phase. Figure 1 illustrates these differences. The solid line represents the plasma clearance of a hypothetical compound. If the dose is lowered by a factor of 3 (dotted line), the exposure is reduced as the area under the curve (AUC) for plasma elimination becomes smaller. If the dose remains the same but the elimination and distribution half-lives become longer (dashed line) then the AUC will increase. Increased half-life and greater AUC occurs in renally impaired subjects.
Figure 1.
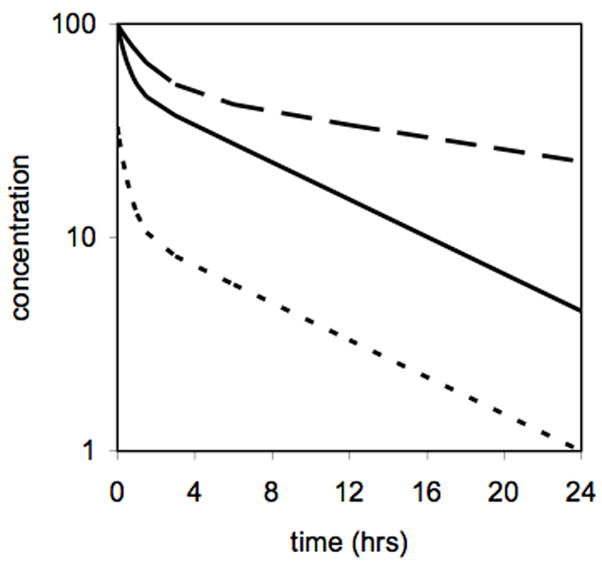
Illustration of effect of dose and half-life on exposure. The dotted line represents a compound administered at 1/3 the dose of for the same compound represented by the solid line resulting in a reduced area under curve (AUC). The dashed line shows the effect of a 3-fold longer half-life, for example in a renally impaired patient, compared to the same dose that produces the solid line.
BIODISTRIBUTION OF APPROVED CONTRAST AGENTS
Figure 2 illustrates potential distribution sites and excretion pathways relevant for soluble metal complexes, i.e. GBCA. An intravenously administered chelate rapidly equilibrates in the intravascular and interstitial (space between cells) fluid compartments; these are referred to collectively as the extracellular compartment. Depending on its structure, the complex may also be distributed into various intracellular environments (including that of liver and kidney) by passive diffusion or specific uptake processes. Clinically available contrast agents are targeted primarily by their distribution: extracellular fluid agents (ECF agent, also called ECS agents – extracellular space), liver agents, and intravascular or blood pool agents.
Figure 2.

Principle distribution sites and excretion pathways for intravenously administered soluble metal complexes
For clinically approved GBCA, there is generally no intracellular distribution apart from the liver in some cases. After intravenous injection, the concentration of GBCA in plasma (Cp) can be described by a biexponential function, equation 1:
| [1] |
From these fitted parameters, secondary pharmacokinetic parameters can be extracted after assuming some sort of model, in this case a two-compartment model and taking into account the dose, usually expressed as mmol Gd per kg body weight. The most common parameters are: 1) the total clearance rate of the GBCA from the blood, Cltot, which has units of mL per min per kg body weight; 2) the distribution half-life coming from the rate constant a in eqn 1, typically denoted α1/2 or tα which has units of time (hr or min); 3) the elimination half-life, β1/2 or tβ from rate constant b in units of time; 4) the area under the serum concentration curve AUC0-t from administration to time t. This is usually extrapolated to t=∞, AUC0-∞, and has units of concentration multiplied by time, e.g. mM·hr, or μmol·min/L; 5) the volume of distribution at steady state or equilibrium distribution volume, VSS, expressed as L/kg. For ECF agents, this number is in the 0.25 L/kg which reflects the extracellular volume. For a true intravascular agent would about 0.07 L/kg, the plasma volume. Large volumes of distriubution (> 0.3 L/kg) would suggest an intracellular distribution.
Extracellular Fluid Agents
The first approved GBCAs were extracellular fluid (ECF) agents. There are several ECF agents approved in the US and Europe and these all behave in a very similar manner, so much so that they are typically referred to simply as “gadolinium” or “gado”. Figure 3 shows the chemical structures of these approved ECF agents.
Figure 3.

Chemical structures, chemical names, tradenames, and generic names of approved extracellular fluid (ECF) contrast agents. All 6 are approved for use in the EU, but gadobutrol and gadoterate are not available in the USA. Approval/availability in other countries may vary.
Chemically, these compounds exhibit three similar features: they all contain Gd, they all contain an 8-coordinate ligand binding to Gd and they all contain a single water molecule coordination site to Gd. The multidentate ligand is required for safety (2). The ligand encapsulates the gadolinium resulting in a high thermodynamic stability and kinetic inertness with respect to metal loss. This enables the contrast agent to be excreted intact – an important property since these contrast agents tend to be much less toxic than their substituents. For example, the DTPA ligand and gadolinium chloride both have a LD50 of 0.5 mmol/kg in rats (LD50 = dose that causes death in 50% of the animals), while the Gd-DTPA complex has nearly a factor of 20 higher safety margin, with a LD50 of 8 mmol/kg for the Gd-DTPA complex (3). The high magnetic moment of the gadolinium ion and the presence of a rapidly exchanging coordinated water molecule are essential to providing contrast. The extracellular agents have very similar properties and these are summarized in Table 1. They are all very hydrophilic complexes with similar relaxivities (4,5), excellent safety profiles, and can be formulated at high concentrations.
Table 1.
Properties of approved gadolinium-based contrast agents
| Trade name | Plasma relaxivity 1.5T, 37 °C (mM−1s−1)a | Standard dose (mmol/kg) | Formulation concentration | Osmolality (Osm/kg H2O) | Formal charge | |
|---|---|---|---|---|---|---|
| r1 | r2 | |||||
| Magnevist | 4.1 | 4.6 | 0.1 | 0.5 M | 1.96 | 2- |
| Omniscan | 4.3 | 5.2 | 0.1 | 0.5 M | 0.79 | 0 |
| Optimark | 4.7 | 5.2 | 0.1 | 0.5 M | 1.11 | 0 |
| Dotarem | 3.6 | 4.3 | 0.1 | 0.5 M | 1.35 | 1- |
| Prohance | 4.1 | 5.0 | 0.1 | 0.5 M | 0.63 | 0 |
| Gadovist | 5.2 | 6.1 | 0.1 | 1.0 M | 1.60 | 0 |
| Eovist | 6.9 | 8.7 | 0.025 | 0.25 M | 0.69 | 2- |
| Primavistb | ||||||
| Multihance | 6.3 | 8.7 | 0.1 | 0.5 M | 1.97 | 2- |
| gadofosveset | 27.7 | 72.6 | 0.03 | 0.25 M | 0.82 | 3- |
Upon injection, ECF agents quickly and freely distribute to the extracellular space. The terminal half-life for blood elimination is about 1.5 hrs for all these compounds when administered to subjects with normal renal function (6–12). The steady state volume of distribution from various pharmacokinetic studies ranges from 210 to 280 mL/kg consistent with an extracellular distribution. These compounds are eliminated almost exclusively via the kidneys. Because of this, the rate of elimination of ECF agents is reduced in patients with renal disease (11,13,14). Renal function is often assessed using the creatinine clearance rate. The blood elimination half-life of the contrast agent and the clearance rate both show good correlations with creatinine clearance as may be expected for compounds renally excreted. In moderately renally impaired subjects (creatinine rate 30 – 60 mL/min) the contrast agent half-life is increased to 4 – 8 hrs. In severely renally impaired subjects (creatinine < 30 mL/min) the mean half-lifes reported range from 18 to 34 hrs. In these pharmacokinetic studies, recovery of contrast agent from the urine is usually complete by 7 days for subjects with normal and moderately impaired renal function. For normal subjects the compound is >90% recovered after 12 hrs. For subjects with severe renal impairment the percent recovery of Gd goes down with increasing elimination half-life. For instance gadobutrol was 76% recovered after 5 days in patients with creatinine under 10 mL/min (11).
Because of their common extracellular distribution, administration of any of these agents yields the same diagnostic information. One exception is in cartilage where the distribution of anionic agents like [GdDTPA]2= is lower than neutral agents like [GdHP-DO3A] because of repulsion from the negatively charged glycosoaminoglycans (GAGs). This has been exploited in so-called delayed gadolinium enhanced MRI of cartilage (dGEMRIC) where joints with lower GAG content because of e.g. osteoarthritis will appear brighter following GdDTPA administration than joints with normal GAG content (15–17). This has been used to quantify GAG content in vivo.
Another consequence, besides NSF, of delayed elimination of ECF agents in subjects with renal insufficiency is that the contrast agent may be able to access different deep compartments. There have been several reports of the cerebrospinal fluid in the subarachnoid space enhancing on images taken 24–48 hrs following Gd administration to renally insufficient subjects despite no underlying pathology in the brain (18–20). This is presumably due to slow diffusion of the contrast agent that remains circulating for extended periods. Studies detailing Gd deposition in tissue are discussed below.
Gadobenate and Gadoxetate: ECF + Liver Agents
The ECF agents, like x-ray contrast agents, are cleared almost exclusively renally by glomerular filtration. It was recognized early on that altering the excretion pathway could allow liver imaging. The gadolinium based compounds Gd-BOPTA (gadobenate dimeglumine, Multihance®) (21) and Gd-EOB-DTPA (gadoxetic acid disodium, sold as Primovist® in Europe, Eovist® in USA), Figure 4, are taken up by hepatocytes (22) and cleared intact via the hepatobiliary system. Both compounds are based on the stable GdDTPA core and contain a benzyl group that helps target hepatocytes. These gadolinium complexes provide positive contrast (T1 weighted) of the hepatobiliary system. These compounds were originally designed for liver imaging and both show significant hepatobiliary clearance in rats. However in humans gadobenate is only 2–4% hepatically eliminated compared to 50% for gadoxetate; the remainder is renally excreted via glomerular filtration like the ECF agents. The dual elimination pathway renders these agents useful as ECF agents and for liver imaging.
Figure 4.

Approved agents with hepatic and ECF distribution
Both compounds show volumes of distribution consistent with extracellular distribution (210 – 280 mL/kg). The aromatic ring confers some weak plasma protein binding to these compounds, although the fraction protein-bound is only about 10%. The weak protein binding results in increased relaxivity compared to ECF agents but does not appear to impact plasma clearance. Gadobenate has a terminal blood half-life on the order of 1.5 – 2 hrs in healthy subjects. For gadoxetic acid the blood half-life is shorter, about 1 hr, and this is probably due to the significant liver uptake of the compound. In patients with hepatic impairment there is little impact on the pharmacokinetics. In patients with renal impairment, the Multihance package insert states that the blood half-life is 6.1 ± 3.0 hrs in moderately impaired subjects (30 < creatinine clearance < 60 mL/min) and 9.5 ± 3.1 hrs in severely renally impaired subjects (10 < creatinine clearance < 30 mL/min). The Eovist/Primovist package insert states in patients with moderate renal impairment a “moderate increase” in terminal half-life was observed compared to healthy volunteers with normal renal function. For patients with end stage renal failure the terminal half-life was prolonged about 12-fold.
Gadofosveset - Blood Pool Agent
Gadofosveset trisodium (MS-325, Vasovist®), Figure 5, was approved in the European Union and the USA for peripheral MR angiography. Gadofosveset (23,24) is a based on the GdDTPA core and contains a lipophilic biphenylcyclohexyl group that binds reversibly to serum albumin. Albumin is the most abundant protein in plasma, and its concentration is high enough (600–700 μM) to reversibly bind most of the contrast agent after injection. Albumin binding affinity is moderate (Kd = 85 μM) such that the fraction bound to albumin will depend on the concentrations of albumin and the contrast agent (24,25). Immediately following injection, when the concentration of the contrast agent is high relative to albumin, there will be a greater free fraction. As the concentration of the contrast agent begins to stabilize (at ~0.5 mM) the fraction bound will become constant.
Figure 5.

Structure of the angiography agent gadofosveset (MS-325) showing components which impact its biodistribution and MR signal properties.
The phosphodiester linkage in gadofosveset was shown to limit the hepatic clearance of this compound and as a result gadofosveset is mainly renally excreted (26). Because albumin binding restricts this compound to the intravascular space, the steady state volume of distribution is 148 ± 16 ml/kg, lower than for the ECF agents. However there is some extravasation and this compound is not 100% confined to the vascular compartment. According to the European Medicines Agency’s scientific discussion document (27), the terminal plasma half-life of gadofosveset in subjects with normal renal function was 18.5 hrs which is considerably longer than other approved agents and is a result of the albumin binding and lack of hepatic clearance. Gadofosveset was predominantly eliminated in the urine with a small percentage (5%) in the feces. 94% of the urinary excretion occurred within the first 72 hrs of a 14 day collection period. In subjects with moderate and severe renal impairment, the terminal plasma half-life increased 2- and 3-fold, respectively (27).
GADOLINIUM DEPOSITION
Deposition of Gadolinium in Humans
These approved compounds were all designed to be completely excreted after injection. The pharmacokinetic studies in humans noted that recovery of gadolinium decreased in patients with severe renal insufficiency. From studies on NSF patients it is clear that some gadolinium is retained. Several reports show Gd to be present in skin biopsies of NSF patients (28–38). Recently Kay et al. (28) described a case report of a female patient who died with NSF. Gadolinium was found in all tissues surveyed and there were very high levels of Gd reported in the kidney and the heart. Swaminathan et al. (29) also noted high concentrations of Gd in the heart and vessels on postmortem analysis of NSF subjects. It is not yet established whether Gd is also retained in patients with renal impairment but who do not develop NSF. It is still not established what the form of Gd is in these patients. For instance, is the Gd still part of the contrast agent? Is it present as some insoluble inorganic deposit like the carbonate or phosphate salt, since these are very insoluble. Or is the Gd removed from the chelate but bonded to the calcium binding site of a calcium binding protein since it is known that gadolinium can replaced calcium in proteins. If the Gd is released from the contrast agent, what is the mechanism for release? Frenzel et al. (39) recently reported the serum stability of approved contrast agents and found that about 20% of Gd was released from gadoversetamide and gadodiamide after 15 days in human serum at pH 7.4, 37 °C compared to <2% release for the linear ionic chelates, while the macrocyclic chelates showed no detectable Gd release. Gd release in serum was increased when phosphate concentration was increased (39). This would suggest that in renally insufficient patients where the plasma half-life increases to days, there would be significant Gd release from gadodiamide and gadoversetamide. Factors influencing Gd release are the presence of metals that have high affinity for the Gd-binding ligand like Zn2+, Cu2+, or Fe3+ and/or the presence of ligands with high affinity for Gd such as phosphate and carbonate. Another potential mechanism for Gd release would be low pH in a lysosome if the contrast agent is taken up intracellularly, e.g. in the renal proximal tubules. It is well established that the rate of Gd release increases with decreasing pH.
Gibby and coworkers compared Gd levels in the bone of patients that were scheduled for hip transplant following a contrast enhanced MRI (40,41). Bone was taken about 4 days after Gd administration. Patients received either gadodiamide (N=9) or gadoteridol (N=10) at the standard 0.1 mmol/kg dose. They found 4-fold higher levels of Gd in the bone of subjects who received gadodiamide (1.77±0.704 μg Gd/g bone) than for those who received gadoteridol (0.477±0.271 μg Gd/g bone). Assuming a similar distribution to all bone and depending on the fractional weight of bone in the individual, this would equate to about 1 – 2% of the injected dose of gadodiamide being present in the bone after 4 days. This study did not identify whether the Gd was still associated as the contrast agent. However since both gadodiamide and gadoteridol have similar clearance rates, the excess Gd remaining after gadodiamide injection is presumed to be dissociated Gd. It is unknown how fast the Gd will clear from the bone. In animal studies (see below), bone levels of Gd decreased with time after contrast agents were injected. For “free” Gd, which localizes mainly to liver and bone, elimination of Gd was on the order of 1–3% per day in rodents.
On the one hand it is straightforward to detect and quantify Gd in biopsy or autopsy samples. Since Gd is not an essential element and is not ubiquitous in the environment, there is no background signal to contend with. Elemental analysis techniques like inductively coupled plasma (ICP) with mass spectrometry (MS) or optical detection are sensitive means to quantify Gd. However this is a destructive technique that reports only on the elemental composition and not on form of the Gd, i.e. whether it is still present as contrast agent. Scanning electron microscopy (SEM) with x-ray spectroscopy is also used. This can detect Gd and can also indicate the distribution of other heavy elements that are spatially localized with the Gd. However SEM cannot indicate in what form the Gd exists in tissue. There is also potential bias in the SEM technique because this technique is sensitive to heavy atoms. For instance a microcrystalline deposit of gadolinium phosphate, with its high local concentration of Gd and P atoms, would be much more visible than a diffuse distribution of Gd still present as contrast agent or Gd bound to calcium-binding proteins. There remains a need for additional biophysical studies to determine the speciation of Gd in skin and other organs.
Although the ECF agents generally behave very similarly, there are some differences among their physical properties. The diamide complexes gadodiamide and gadoversetamide have considerably lower thermodynamic stability (log K~17 vs log K >21 for other Gd complexes) (42,43). The linear complexes tend to be more reactive to metal substitution (transmetallation) or decomplexation. The incidence of NSF seems to reflect these physical chemistry findings. Most cases have been reported with gadodiamide, the least stable and least inert compound. Other cases have been reported with gadopentetate and gadoversetamide, while no non-confounding cases have yet been reported with the other contrast agents. In terms of market share, gadopentate > gadodiamide > gadoteridol > other agents.
Deposition of Gadolinium in Animals – Approved Agents
There have been concerns about Gd deposition in tissue since Gd-based contrast agents were first reported. A fundamental product criterion was full elimination of the Gd. In rodent studies the bone and the liver are target organs for Gd deposition. Tweedle and colleagues published a series of studies comparing Gd retention in rats and mice after injection of GdDTPA, GdHP-DO3A, GdDOTA, and GdDTPA-BMA as well as some other compounds, including “free Gd” administered as GdCl3 or gadolinium acetate (44–47). When “free Gd” is administered i.v. most of the dose is deposited in the liver and the bone of rodents. Very little is excreted and clearance has been reported to be on the order of 1 to 3% per day. When contrast agents are administered, the biodistributions of GdDTPA, GdHP-DO3A, GdDOTA, and GdDTPA-BMA are very similar for the first 24 hrs. At 7 and 14 days the data begins to separate. The organs with remaining Gd are kidney, liver, and bone. In a direct comparison of 4 compounds the order of tissue retention was GdDTPA-BMA > GdDTPA ~ GdDOTA ~ GdHPDO3A (47). There was no statistical analysis performed in that study but it is apparent from the values and standard deviations reported that there is significantly more Gd remaining in the whole body, liver, or femur of mice or rats treated with GdDTPA-BMA compared to the other agents. This difference was interpreted as being due to greater Gd release from the chelate. This hypothesis is supported by a double label study by Kosokat and Urich who used [153Gd] and [14C] labeled GdDTPA in rats and found a 153Gd:14C ratio of 6:1 in liver and 9:1 in bone (48). Tweedle et al. (47) also noted that formulated Omniscan which is a mixture of gadodiamide with 5% sodium caldiamide (Na[CaDTPA-BMA]) showed less whole body retention than gadodiamide injected alone. Animal studies with MS-325, GdEOB-DTPA, and GdBOPTA all showed very low values of Gd in bone at 7 or 14 days post injection similar to those reported for GdDTPA (49–52).
In renally impaired patients the exposure to Gd is increased; the longer plasma half-life results in a large AUC. Since the terminal plasma half life in rats is 15–20 min compared to about 90 minutes in healthy humans for ECF agents, one way to mimic the increased Gd exposure in renally compromised subjects is to administer high doses of agent daily to rats. Sieber and colleagues recently reported a series of studies taking this approach. They administered formulated Omniscan, Optimark, Magnevist, Multihance, Gadovist, or Dotarem at 2.5 mmol/kg daily (except weekends) for four weeks to rats (53). This daily dose is 25 times the standard 0.1 mmol/kg dose and resulted in a cumulative dose of 50 mmol/kg. They examined Gd levels in the skin, liver and femur at the end of the study. In all three organs the order of Gd deposition was the same with Omniscan > Optimark > Magnevist > Multihance ~ Gadovist ~ Dotarem in terms of how much Gd was deposited. Although there were differences among the contrast agents, Sieber et al.(53) only reported statistical analysis to show the amount of Gd deposited after Omniscan injection was significantly higher compared to the other contrast media. No other comparisons were made. Interestingly the relative concentrations of Gd in the skin, liver, and femur differed. For instance there was about 8 times more Gd in the skin following Omniscan compared to Magnevist, but about 3 times more in the femur or 2 times more in the liver. Interestingly liver levels were similar for the linear Magnevist complex and the macrocycles Dotarem and Gadovist, although there were clear differences in the skin or the bone (Magnevist higher).
In this same repeat dose model, Sieber et al. (54) also investigated the influence of excess ligand. Formulated Omniscan contains gadodiamide and 5% excess ligand as the calcium complex (caldiamide) while Optimark contains gadoversetamide and 10% excess ligands. They repeatedly gave either the gadolinium complex (gadodiamide or gadoversetamide), gadolinium complex + 5% excess ligand, or gadolinium complex + 10% excess ligand for 20 days to rats. The Gd concentration in the skin was significantly higher after treatment of the gadolinium complex alone compared with 5% excess ligand. By increasing the excess of ligand from 5% to 10%, the Gd concentrations in the skin were further reduced by a factor of three. The addition of 5% excess ligand in both contrast agents reduced Gd levels significantly in the femur and the liver, but additional excess ligand had no further benefit in these organs.
Gadolinium Deposition – Related Preclinical Studies
Unger and colleagues studied the distribution of GdDTPA that had been entrapped in liposomes (55). They reported distribution of Gd in rats after injection of either 100-nm or 50-nm liposomes that had encapsulated GdDTPA. Encapsulation increased the blood pool half-life to about 4 hrs for the 100-nm liposomes compared to about 15 minutes for unencapsulated GdDTPA. Unlike unencapsulated GdDTPA, the encapsulated material is retained in the liver and spleen with the highest uptake per gram of tissue in the spleen. Clearance of gadolinium from the liver and spleen showed a half-life of 3 to 4 days. In the case of Gd-DTPA loaded liposomes there is an efficient uptake by the reticuloendothelial systems (RES) as occurs for any kind of i.v. administered particles. Besides the RES there are also circulating macrophages which may be actively involved in the removal of liposomes from circulation. The main determinants of macrophage uptake of liposomes are the hydrophilic characteristics of their surface (more hydrophilic more “stealth”) and the size (large sized systems are preferentially taken up by spleen RES). Therefore altering the formulation clearly has significant effects on biodistritribution and retention of Gd complexes.
There have been numerous reports of Gd-chelates conjugated to macromolecules for blood pool and tumor imaging. When the size of the molecule is too large to pass through the glomerular filter in the kidneys there is usually long term gadolinium retention. Although these are different chemical entities than the ECF agents, these macromolecule studies demonstrate the effects of very long residency times on Gd distribution, in some ways akin to the renally insufficient patient. For example Deal et al. showed that when GdDTPA was conjugated to bovine serum albumin (BSA) or glycosylated BSA gadolinium accumulated in the bone and bone Gd levels increased with time from 1 to 2 to 4 days post injection (56). This was consistent with Gd release.
Biodegradable macromolecules have also been described. For instance Feng et al. synthesized a polymer based on the DTPA-bis(amide) core (the same used for gadodiamide and gadoversetamide) and this polymer breaks down in vivo to release small discrete chelates (57). While this is a different molecule, it sheds some light on the stability of the GdDTPA-bis(amide) chelator with an extended residency time. In their case, the biodegradable polymers showed more elimination in rats at 10 days post injection compared to a non-degradable analog, but Gd levels in liver, kidney, spleen, and bone were higher than values reported for the discrete gadodiamide chelate. This supports the notion that increased body residency time increases the probability of Gd deposition.
Gadolinium Uptake by Cells
The growing interest in cell labeling to track cell-based therapies has driven studies on the interaction of GBCA with cells (58–60). Entrapment of GBCA into cells occurs by pinocytosis (also called fluid endocytosis) that consists of the progressive invagination of the membrane to form vesicles containing the extracellular solution.
Therefore, cells are incubated at high concentration of GBCA in the incubation medium in order to internalize a sufficient number of reporters for MRI visualization. Upon incubating Gd-DTPA, Gd-DOTA, Gd-HPDO3A and Gd-DTPA-BMA (at 1.5 mM) for 4h at 37 °C in the presence of rat glioma (C6) and rat hepatoma tissue culture (HTC) it was found that the amount of internalized Gd is about one order of magnitude higher in the case of Gd-DTPA-BMA, Figure 6 (59). The comparison between relaxometric and mass spectrometry determinations established that only a minor fraction of intact Gd-DTPA-BMA (<2%) is internalized into the cells. On the contrary, it was found that the moles of intact Gd-HPDO3A complex (2×10⁻⁶ Gd-complex moles/mg proteins) corresponded to the total amount of gadolinium taken up. Interestingly, when the incubation was carried out in the presence of the commercial formulation of Gd-DTPA-BMA (Omniscan) which contains a 5% excess of Ca-DTPA-BMA, the amount of Gd detected in the cells decreases to ca. half the value found in the experiment with the unformulated complex.
Figure 6.

Results from the incubation of rat glioma (C6) and rat hepatoma (HTC) cells in media containing 1.6 mM Gd(III)-based contrast agents (4h at 37°C).
Another interesting observation dealt with the role of phosphate in the incubation medium. In fact, upon replacing potassium phosphate (1mM) with HEPES buffer, a dramatic decrease of gadolinium uptake was observed (ca. one order of magnitude) for Gd-DTPA-BMA. No effect was detected in the case of the uptake experiment with Gd-HPDO3A. The observed behavior indicates that the lower stability of Gd-DTPA-BMA is responsible for a shift in the dissociation equilibrium that results in the net transfer of Gd3+ ions on the cell membrane followed by a slower internalization process. The transmetallation appears mediated by components of the incubation media, among which phosphate has a dominant role.
CONCLUSIONS AND OPEN QUESTIONS
Approved gadolinium based contrast agents have 3 categories of biodistribution: extracellular with renal elimination, extracellular with mixed renal and hepatobiliary elimination, and intravascular with renal elimination. After intravenous injection they distribute in the blood and the extracellular space and transiently through the excretory organs. Preclinical animal studies and the available clinical literature indicate that all these compounds are excreted intact. Elimination tends to be rapid and for the most part, complete.
In renally insufficient patients the plasma elimination half-life increases substantially from hours to days depending on renal function. In patients with impaired renal function who then developed NSF, administration of the ECF agents gadodiamide, gadoversetamide, and gadopentetate dimeglumine have been shown to result in Gd deposition in the skin and internal organs. It is unknown whether Gd deposition results in non-NSF subjects as well and if so, whether such deposition correlates with impaired renal function. In one study of hip replacement recipients, at 4 days post Gd administration, patients that received gadodiamide had 4-fold higher Gd levels in bone than those who received gadoteridol which suggests that there may be Gd deposition in non-NSF subjects. In the cases of Gd deposition in NSF patients, it is likely that the Gd is no longer associated with its chelator, but this has still not been definitively shown. The speciation of Gd in human tissue remains an open question – is the Gd still bound to the chelate and if not, what is it bonded to? Is the form of Gd the same in skin deposits compared to internal organs? From the limited Gd distribution data available in NSF subjects, there appears to be differences in distribution compared to the preclinical rodent studies. For instance high myocardial uptake of Gd in post-mortem analysis is not consistent with the rodent studies. Besides the speciation of Gd, the trafficking of Gd in NSF subjects is another open question, i.e. if dechelation occurs, then where does it occur and how is the Gd transported to other organs?
Finally, the route of administration is critical to understanding the biodistribution and potential Gd deposition of these GBCA. Despite this low incidence of NSF, GBCA have proven to be very safe especially when administered intravenously at approved dosages. The package insert should always be consulted for up to date safety information. Alternate routes of administration (e.g. subcutaneous, intrathecal, etc), formulation (e.g. in a liposome or other nanoparticle), or cell labeling will likely alter the biodistribution and may impact Gd tissue deposition and/or toxicity. Such studies should be undertaken with caution.
Acknowledgments
Dr. Caravan acknowledges funding support from the National Institute Of Biomedical Imaging And Bioengineering, award number R01EB009062.
References
- 1.Caravan P, Lauffer RB. Contrast Agents: Basic Principles. In: Edelman RR, Hesselink JR, Zlatkin MB, Crues JV, editors. Clinical Magnetic Resonance Imaging. 3. Vol. 1. Philadelphia: Saunders; 2005. pp. 357–375. [Google Scholar]
- 2.Caravan P, Ellison JJ, McMurry TJ, Lauffer RB. Gadolinium(III) Chelates as MRI Contrast Agents: Structure, Dynamics, and Applications. Chem Rev. 1999;99:2293–2352. doi: 10.1021/cr980440x. [DOI] [PubMed] [Google Scholar]
- 3.Gries H. Extracellular MRI contrast agents based on gadolinium. Top Curr Chem. 2002;221:1–24. [Google Scholar]
- 4.Eldredge HB, Spiller M, Chasse JM, Greenwood MT, Caravan P. Species dependence on plasma protein binding and relaxivity of the gadolinium-based MRI contrast agent MS-325. Invest Radiol. 2006;41:229–243. doi: 10.1097/01.rli.0000199293.86956.48. [DOI] [PubMed] [Google Scholar]
- 5.Rohrer M, Bauer H, Mintorovitch J, Requardt M, Weinmann HJ. Comparison of magnetic properties of MRI contrast media solutions at different magnetic field strengths. Invest Radiol. 2005;40:715–724. doi: 10.1097/01.rli.0000184756.66360.d3. [DOI] [PubMed] [Google Scholar]
- 6.Weinmann HJ, Laniado M, Mutzel W. Pharmacokinetics of GdDTPA/dimeglumine after intravenous injection into healthy volunteers. Physiol Chem Phys Med NMR. 1984;16:167–172. [PubMed] [Google Scholar]
- 7.VanWagoner M, O’Toole M, Worah D, Leese PT, Quay SC. A phase I clinical trial with gadodiamide injection, a nonionic magnetic resonance imaging enhancement agent. Invest Radiol. 1991;26:980–986. doi: 10.1097/00004424-199111000-00010. [DOI] [PubMed] [Google Scholar]
- 8.McLachlan SJ, Eaton S, De Simone DN. Pharmacokinetic behavior of gadoteridol injection. Invest Radiol. 1992;27 (Suppl 1):S12–15. [PubMed] [Google Scholar]
- 9.Van Wagoner M, Worah D. Gadodiamide injection. First human experience with the nonionic magnetic resonance imaging enhancement agent. Invest Radiol. 1993;28 (Suppl 1):S44–48. [PubMed] [Google Scholar]
- 10.Swan SK, Baker JF, Free R, et al. Pharmacokinetics, safety, and tolerability of gadoversetamide injection (OptiMARK) in subjects with central nervous system or liver pathology and varying degrees of renal function. J Magn Reson Imaging. 1999;9:317–321. doi: 10.1002/(sici)1522-2586(199902)9:2<317::aid-jmri25>3.0.co;2-b. [DOI] [PubMed] [Google Scholar]
- 11.Tombach B, Bremer C, Reimer P, et al. Pharmacokinetics of 1M gadobutrol in patients with chronic renal failure. Invest Radiol. 2000;35:35–40. doi: 10.1097/00004424-200001000-00004. [DOI] [PubMed] [Google Scholar]
- 12.Baker JF, Kratz LC, Stevens GR, Wible JH., Jr Pharmacokinetics and safety of the MRI contrast agent gadoversetamide injection (OptiMARK) in healthy pediatric subjects. Invest Radiol. 2004;39:334–339. doi: 10.1097/01.rli.0000124455.11402.52. [DOI] [PubMed] [Google Scholar]
- 13.Schuhmann-Giampieri G, Krestin G. Pharmacokinetics of Gd-DTPA in patients with chronic renal failure. Invest Radiol. 1991;26:975–979. doi: 10.1097/00004424-199111000-00009. [DOI] [PubMed] [Google Scholar]
- 14.Joffe P, Thomsen HS, Meusel M. Pharmacokinetics of gadodiamide injection in patients with severe renal insufficiency and patients undergoing hemodialysis or continuous ambulatory peritoneal dialysis. Acad Radiol. 1998;5:491–502. doi: 10.1016/s1076-6332(98)80191-8. [DOI] [PubMed] [Google Scholar]
- 15.Roos EM, Dahlberg L. Positive effects of moderate exercise on glycosaminoglycan content in knee cartilage: a four-month, randomized, controlled trial in patients at risk of osteoarthritis. Arthritis Rheum. 2005;52:3507–3514. doi: 10.1002/art.21415. [DOI] [PubMed] [Google Scholar]
- 16.Eckstein F, Burstein D, Link TM. Quantitative MRI of cartilage and bone: degenerative changes in osteoarthritis. NMR Biomed. 2006;19:822–854. doi: 10.1002/nbm.1063. [DOI] [PubMed] [Google Scholar]
- 17.Gray ML, Burstein D, Kim YJ, Maroudas A 2007 Elizabeth Winston Lanier Award Winner. Magnetic resonance imaging of cartilage glycosaminoglycan: basic principles, imaging technique, and clinical applications. J Orthop Res. 2008;26:281–291. doi: 10.1002/jor.20482. [DOI] [PubMed] [Google Scholar]
- 18.Lev MH, Schaefer PW. Subarachnoid gadolinium enhancement mimicking subarachnoid hemorrhage on FLAIR MR images. Fluid-attenuated inversion recovery. AJR Am J Roentgenol. 1999;173:1414–1415. doi: 10.2214/ajr.173.5.10541135. [DOI] [PubMed] [Google Scholar]
- 19.Rai AT, Hogg JP. Persistence of gadolinium in CSF: a diagnostic pitfall in patients with end-stage renal disease. AJNR Am J Neuroradiol. 2001;22:1357–1361. [PMC free article] [PubMed] [Google Scholar]
- 20.Morris JM, Miller GM. Increased signal in the subarachnoid space on fluid-attenuated inversion recovery imaging associated with the clearance dynamics of gadolinium chelate: a potential diagnostic pitfall. AJNR Am J Neuroradiol. 2007;28:1964–1967. doi: 10.3174/ajnr.A0694. [DOI] [PMC free article] [PubMed] [Google Scholar]
- 21.Kirchin MA, Pirovano GP, Spinazzi A. Gadobenate dimeglumine (Gd-BOPTA) An overview Invest Radiol. 1998;33:798–809. doi: 10.1097/00004424-199811000-00003. [DOI] [PubMed] [Google Scholar]
- 22.Pascolo L, Cupelli F, Anelli PL, et al. Molecular Mechanisms for the Hepatic Uptake of Magnetic Resonance Imaging Contrast Agents. Biochem Biophys Res Commun. 1999;257:746–752. doi: 10.1006/bbrc.1999.0454. [DOI] [PubMed] [Google Scholar]
- 23.Caravan P, Cloutier NJ, Greenfield MT, et al. The Interaction of MS-325 with Human Serum Albumin and Its Effect on Proton Relaxation Rates. J Am Chem Soc. 2002;124:3152–3162. doi: 10.1021/ja017168k. [DOI] [PubMed] [Google Scholar]
- 24.Lauffer RB, Parmelee DJ, Dunham SU, et al. MS-325: Albumin - targeted Contrast Agent for MR Angiography. Radiology. 1998;207:529–538. doi: 10.1148/radiology.207.2.9577506. [DOI] [PubMed] [Google Scholar]
- 25.Eldredge HB, Spiller M, Chasse JM, Greenfield MT, Caravan P. Species Dependence on Plasma Protein Binding and Relaxivity of the Gadolinium-based MRI Contrast Agent MS-325. Invest Radiol. 2006;41 doi: 10.1097/01.rli.0000199293.86956.48. in press. [DOI] [PubMed] [Google Scholar]
- 26.McMurry TJ, Parmelee DJ, Sajiki H, et al. The effect of a phosphodiester linking group on albumin binding, blood half-life, and relaxivity of intravascular diethylenetriaminepentaacetato aquo gadolinium(III) MRI contrast agents. J Med Chem. 2002;45:3465–3474. doi: 10.1021/jm0102351. [DOI] [PubMed] [Google Scholar]
- 27.European Medicines Agency. EMEA scientific discussion document for gadofosveset trisodium. [Last accessed December 3, 2008];2005 June 1; Available at: www.emea.europa.eu/humandocs/PDFs/EPAR/vasovist/060105en6.pdf.
- 28.Kay J, Bazari H, Avery LL, Koreishi AF. Case records of the Massachusetts General Hospital. Case 6-2008. A 46-year-old woman with renal failure and stiffness of the joints and skin. N Engl J Med. 2008;358:827–838. doi: 10.1056/NEJMcpc0708697. [DOI] [PubMed] [Google Scholar]
- 29.Swaminathan S, High WA, Ranville J, et al. Cardiac and vascular metal deposition with high mortality in nephrogenic systemic fibrosis. Kidney Int. 2008;73:1413–1418. doi: 10.1038/ki.2008.76. [DOI] [PubMed] [Google Scholar]
- 30.Singh M, Davenport A, Clatworthy I, et al. A follow-up of four cases of nephrogenic systemic fibrosis: is gadolinium the specific trigger? Br J Dermatol. 2008;158:1358–1362. doi: 10.1111/j.1365-2133.2008.08506.x. [DOI] [PubMed] [Google Scholar]
- 31.Wiginton CD, Kelly B, Oto A, et al. Gadolinium-based contrast exposure, nephrogenic systemic fibrosis, and gadolinium detection in tissue. AJR Am J Roentgenol. 2008;190:1060–1068. doi: 10.2214/AJR.07.2822. [DOI] [PubMed] [Google Scholar]
- 32.Abraham JL, Thakral C, Skov L, Rossen K, Marckmann P. Dermal inorganic gadolinium concentrations: evidence for in vivo transmetallation and long-term persistence in nephrogenic systemic fibrosis. Br J Dermatol. 2008;158:273–280. doi: 10.1111/j.1365-2133.2007.08335.x. [DOI] [PubMed] [Google Scholar]
- 33.Khurana A, Greene JF, Jr, High WA. Quantification of gadolinium in nephrogenic systemic fibrosis: Re-examination of a reported cohort with analysis of clinical factors. J Am Acad Dermatol. 2008;59:218–224. doi: 10.1016/j.jaad.2008.04.010. [DOI] [PubMed] [Google Scholar]
- 34.Schroeder JA, Weingart C, Coras B, et al. Ultrastructural Evidence of Dermal Gadolinium Deposits in a Patient with Nephrogenic Systemic Fibrosis and End-Stage Renal Disease. Clin J Am Soc Nephrol. 2008;3:968–975. doi: 10.2215/CJN.00100108. [DOI] [PMC free article] [PubMed] [Google Scholar]
- 35.Boyd AS, Zic JA, Abraham JL. Gadolinium deposition in nephrogenic fibrosing dermopathy. J Am Acad Dermatol. 2007;56:27–30. doi: 10.1016/j.jaad.2006.10.048. [DOI] [PubMed] [Google Scholar]
- 36.High WA, Ayers RA, Chandler J, Zito G, Cowper SE. Gadolinium is detectable within the tissue of patients with nephrogenic systemic fibrosis. J Am Acad Dermatol. 2007;56:21–26. doi: 10.1016/j.jaad.2006.10.047. [DOI] [PubMed] [Google Scholar]
- 37.High WA, Ayers RA, Cowper SE. Gadolinium is quantifiable within the tissue of patients with nephrogenic systemic fibrosis. J Am Acad Dermatol. 2007;56:710–712. doi: 10.1016/j.jaad.2007.01.022. [DOI] [PubMed] [Google Scholar]
- 38.Thakral C, Alhariri J, Abraham JL. Long-term retention of gadolinium in tissues from nephrogenic systemic fibrosis patient after multiple gadolinium-enhanced MRI scans: case report and implications. Contrast Media Mol Imaging. 2007;2:199–205. doi: 10.1002/cmmi.146. [DOI] [PubMed] [Google Scholar]
- 39.Frenzel T, Lengsfeld P, Schirmer H, Hutter J, Weinmann HJ. Stability of gadolinium-based magnetic resonance imaging contrast agents in human serum at 37 degrees C. Invest Radiol. 2008;43:817–828. doi: 10.1097/RLI.0b013e3181852171. [DOI] [PubMed] [Google Scholar]
- 40.Gibby WA, Gibby KA, Gibby WA. Comparison of Gd DTPA-BMA (Omniscan) versus Gd HP-DO3A (ProHance) retention in human bone tissue by inductively coupled plasma atomic emission spectroscopy. Invest Radiol. 2004;39:138–142. doi: 10.1097/01.rli.0000112789.57341.01. [DOI] [PubMed] [Google Scholar]
- 41.White GW, Gibby WA, Tweedle MF. Comparison of Gd(DTPA-BMA) (Omniscan) versus Gd(HP-DO3A) (ProHance) relative to gadolinium retention in human bone tissue by inductively coupled plasma mass spectroscopy. Invest Radiol. 2006;41:272–278. doi: 10.1097/01.rli.0000186569.32408.95. [DOI] [PubMed] [Google Scholar]
- 42.Kumar K, Tweedle MF. Ligand basicity and rigidity control formation of macrocyclic polyamino carboxylate complexes of gadolinium(III) Inorganic Chemistry. 1993;32:4193–4199. [Google Scholar]
- 43.White DH, DeLearie LA, Moore DA, et al. The thermodynamics of complexation of lanthanide(III) DTPA-bisamide complexes and their implication for stability and solution structure. Invest Radiol. 1991;26:S226–S228. doi: 10.1097/00004424-199111001-00077. [DOI] [PubMed] [Google Scholar]
- 44.Wedeking P, Tweedle M. Comparison of the biodistribution of 153Gd-labeled Gd(DTPA)2-, Gd(DOTA)-, and Gd(acetate)n in mice. Int J Rad Appl Instrum B. 1988;15:395–402. doi: 10.1016/0883-2897(88)90009-8. [DOI] [PubMed] [Google Scholar]
- 45.Wedeking P, Kumar K, Tweedle MF. Dissociation of gadolinium chelates in mice: relationship to chemical characteristics. Magn Reson Imaging. 1992;10:641–648. doi: 10.1016/0730-725x(92)90016-s. [DOI] [PubMed] [Google Scholar]
- 46.Wedeking P, Kumar K, Tweedle MF. Dose-dependent biodistribution of [153Gd]Gd(acetate)n in mice. Nucl Med Biol. 1993;20:679–691. doi: 10.1016/0969-8051(93)90039-w. [DOI] [PubMed] [Google Scholar]
- 47.Tweedle MF, Wedeking P, Kumar K. Biodistribution of radiolabeled, formulated gadopentetate, gadoteridol, gadoterate, and gadodiamide in mice and rats. Invest Radiol. 1995;30:372–380. doi: 10.1097/00004424-199506000-00008. [DOI] [PubMed] [Google Scholar]
- 48.Kasokat T, Urich K. Quantification of dechelation of gadopentetate dimeglumine in rats. Arzneimittelforschung. 1992;42:869–876. [PubMed] [Google Scholar]
- 49.Muhler A, Weinmann HJ. Biodistribution and excretion of 153Gd-labeled gadolinium ethoxybenzyl diethylenetriamine pentaacetic acid following repeated intravenous administration to rats. Acad Radiol. 1995;2:313–318. doi: 10.1016/s1076-6332(05)80191-6. [DOI] [PubMed] [Google Scholar]
- 50.Parmelee DJ, Walovitch RC, Ouellet HS, Lauffer RB. Preclinical evaluation of the pharmacokinetics, biodistribution, and elimination of MS-325, a blood pool agent for magnetic resonance imaging. Invest Radiol. 1997;32:741–747. doi: 10.1097/00004424-199712000-00004. [DOI] [PubMed] [Google Scholar]
- 51.Spinazzi A, Lorusso V, Pirovano G, Taroni P, Kirchin M, Davies A. Multihance clinical pharmacology: biodistribution and MR enhancement of the liver. Acad Radiol. 1998;5(Suppl 1):S86–89. doi: 10.1016/s1076-6332(98)80069-x. discussion S93–84. [DOI] [PubMed] [Google Scholar]
- 52.Lorusso V, Arbughi T, Tirone P, de Haen C. Pharmacokinetics and tissue distribution in animals of gadobenate ion, the magnetic resonance imaging contrast enhancing component of gadobenate dimeglumine 0.5 M solution for injection (MultiHance) J Comput Assist Tomogr. 1999;23 (Suppl 1):S181–194. doi: 10.1097/00004728-199911001-00023. [DOI] [PubMed] [Google Scholar]
- 53.Sieber MA, Lengsfeld P, Frenzel T, et al. Preclinical investigation to compare different gadolinium-based contrast agents regarding their propensity to release gadolinium in vivo and to trigger nephrogenic systemic fibrosis-like lesions. Eur Radiol. 2008;18:2164–2173. doi: 10.1007/s00330-008-0977-y. [DOI] [PubMed] [Google Scholar]
- 54.Sieber MA, Lengsfeld P, Walter J, et al. Gadolinium-based contrast agents and their potential role in the pathogenesis of nephrogenic systemic fibrosis: the role of excess ligand. J Magn Reson Imaging. 2008;27:955–962. doi: 10.1002/jmri.21368. [DOI] [PubMed] [Google Scholar]
- 55.Unger E, Cardenas D, Zerella A, Fajardo LL, Tilcock C. Biodistribution and clearance of liposomal gadolinium-DTPA. Invest Radiol. 1990;25:638–644. doi: 10.1097/00004424-199006000-00004. [DOI] [PubMed] [Google Scholar]
- 56.Deal KA, Motekaitis RJ, Martell AE, Welch MJ. Evaluation of the stability and animal biodistribution of gadolinium (III) benzylamine-derivatized diethylenetriaminepentaacetic acid. J Med Chem. 1996;39:3096–3106. doi: 10.1021/jm9602118. [DOI] [PubMed] [Google Scholar]
- 57.Feng Y, Zong Y, Ke T, Jeong EK, Parker DL, Lu ZR. Pharmacokinetics, biodistribution and contrast enhanced MR blood pool imaging of Gd-DTPA cystine copolymers and Gd-DTPA cystine diethyl ester copolymers in a rat model. Pharm Res. 2006;23:1736–1742. doi: 10.1007/s11095-006-9028-z. [DOI] [PubMed] [Google Scholar]
- 58.Liu W, Frank JA. Detection and quantification of magnetically labeled cells by cellular MRI. Eur J Radiol. 2008 doi: 10.1016/j.ejrad.2008.09.021. [DOI] [PMC free article] [PubMed] [Google Scholar]
- 59.Cabella C, Crich SG, Corpillo D, et al. Cellular labeling with Gd(III) chelates: only high thermodynamic stabilities prevent the cells acting as ‘sponges’ of Gd3+ ions. Contrast Media Mol Imaging. 2006;1:23–29. doi: 10.1002/cmmi.88. [DOI] [PubMed] [Google Scholar]
- 60.Biancone L, Crich SG, Cantaluppi V, et al. Magnetic resonance imaging of gadolinium-labeled pancreatic islets for experimental transplantation. NMR Biomed. 2007;20:40–48. doi: 10.1002/nbm.1088. [DOI] [PubMed] [Google Scholar]