Abstract
In the collecting duct (CD), H-K-ATPases function in cation reabsorption and H secretion. This study evaluated H-K-ATPase-mediated H secretion along the mouse CD, measured as EIPA- and luminal bafilomycin A1-insensitive intracellular pH (pHi) recovery from acute H loading (NH4) using BCECF. pHi recovery was measured in 1) microperfused cortical, outer medullary, and inner medullary CDs (CCD, OMCD, and IMCD) from C57BL/6J mice fed a normal diet and 2) common murine CD cell lines. H-K-ATPase activity along the native, microperfused CD was greatest in the CCD, less in the OMCD, and least in the IMCD (0.10 ± 0.02, 0.04 ± 0.01, and 0.01 ± 0.002 U/min, respectively). H-K-ATPase activity was 0.30 ± 0.03 and 0.26 ± 0.03 in A- and B-type ICs, respectively, and was sensitive to Sch-28080 or ouabain. pHi recovery was greatest in the OMCD1 cell line (0.25 ± 0.01) and less in mpkCCDc14 (0.17 ± 0.01), mIMCD-K2 (0.12 ± 0.01), and mIMCD-3 (0.05 ± 0.01) cells. EIPA inhibited the majority of pHi recovery in these cells (100%, 64%, 75%, and 80% in mpkCCDc14, OMCD1, mIMCD-K2, and mIMCD-3, respectively). In OMCD1 cells, where EIPA-insensitive pHi recovery was greatest, H-K-ATPase activity was 0.10 ± 0.01 and was significantly inhibited (80%) by Sch-28080. We conclude that 1) H-K-ATPase-mediated H secretion in the native mouse CD is greatest in the ICs of the CCD, 2) A- and B-type ICs possess HKα1 and HKα2 H-K-ATPase activity, and 3) the OMCD1 cell line best exhibits H-K-ATPase.
Keywords: microperfusion; intracellular pH; acid-base balance; intercalated cell; 2′,7′-bis(2-carboxyethyl)-5(6)-carboxyfluorescein
the renal H-K-ATPases are integral membrane proteins of the collecting duct (CD), a segment critical to the final regulation of electrolyte excretion. H-K-ATPases function in cellular acid-base homeostasis by the vectorial transport of protons (H) in exchange for cations, with the greatest affinity for K. Together with apical Na/H exchangers and H-ATPases, H-K-ATPases participate in bicarbonate (HCO3) synthesis and reabsorption.
Two transcriptionally competent genes are known to express α-subunits in the kidney: HKα1 and HKα2 (5). HKα1 H-K-ATPase is sensitive to micromolar concentrations of imidazopyridine, i.e., 2-methyl-8-phenylmethoxy-[imidazol(1,2a)]-pyridine-3-acetonitrile (Sch-28080) (23). Ouabain, a classic inhibitor of the Na-K-ATPase, has been used to assess the physiological contribution of HKα2 (5).
The CD is divided into three major segments: the cortical CD (CCD), the outer medullary CD (OMCD), and the inner medullary CD (IMCD). Ion transport mechanisms of the CD are studied by in vitro analysis of microperfused CD segments and in immortalized cultured cells. Cell models for studying cell biology are invaluable, yet not all cell types of the CD are represented or are commercially available as immortalized cell lines, and the cellular heterogeneity of the CD is not represented in homogeneous cell culture models. With use of in vitro microperfusion, the heterogeneous cellular makeup of nephron segments is preserved and is better representative of native transport properties. This study used a systematic approach to evaluate H secretion in native CCDs and four common renal mouse CD cultured cell lines.
The axial heterogeneity of the CD described by others (6) was limited to measurement of K-ATPase activities in the CCD and OMCD and involved collagenase digestion and permeabilization of tubule segments and incubation in Na- and K-free solutions. These manipulations may affect native enzymatic activity. We used in vitro microperfusion to characterize the H-K-ATPase in the CD, which allows the evaluation of ionic flux (secretion and reabsorption) in a precisely defined environment on native tissue. In vitro microperfusion remains a powerful technique in the field of renal physiology, given the preservation of native tissue integrity, cellular signaling, and conservation of original function. Additionally, our investigation evaluates H-K-ATPase-mediated activity along the entire CD (CCD, OMCD, and IMCD), including evaluation in A- and B-type intercalated cells (ICs).
The first aim of this study was to evaluate pharmacologically defined H-K-ATPase activity along the microperfused CD and within functionally defined A- and B-type ICs of mice fed a normal diet. Substantial H-K-ATPase-mediated H secretion was localized to the CCD, with profound rates within A- and B-type ICs, which supports our previous report that the deletion of either H-K-ATPase subtype diminishes H secretion in both IC types (15).
The second aim was to evaluate H-K-ATPase activity in four CD cell models. The epithelia of the CCD, OMCD, and initial and terminal segments of the IMCD were represented by mpkCCDc14 (4), OMCD1 (11), mIMCD-K2 (13), and mIMCD-3 cells, respectively. We conclude that only the OMCD1 cell model exhibited modest H-K-ATPase activity. An immortalized mouse IC model that conserves the H-K-ATPase-mediated H secretion of the native IC would be a valuable tool for future investigation of the cationic transport properties of this enzyme.
METHODS
Cell culture.
mpkCCDc14 cells [a kind gift from A. Vandewalle (4)], OMCD1 cells [a kind gift from T. DuBose (11)], mIMCD-K2 cells [a kind gift from B. Stanton (13)], and mIMCD-3 cells (American Type Culture Collection, Manassas, VA) were grown to confluency on glass coverslips in 90% DMEM-F-12 medium-10% fetal bovine serum (Invitrogen, Carlsbad, CA) with 0.1% gentamicin (Sigma-Aldrich, St. Louis, MO) in 95% air-5% CO2 and transferred to a thermostatically controlled perfusion chamber for measurements. All cells were between passages 6 and 39.
CD isolation for in vitro microperfusion.
Mice (C57BL/6J, female, ages 8–14 wk) were maintained on a normal diet (Teklad 2016S) and allowed free access to water. They were euthanized by intraperitoneal injection of pentobarbital sodium (120 mg/kg) and cervical dislocation. Both kidneys were quickly removed, and ∼1-mm coronal slices were placed in a chilled petri dish containing HEPES-buffered solution A (Table 1). A single CD segment was dissected by hand at 4°C within 60 min, and standard in vitro microperfusion methods as modified by this laboratory were performed (15). All animal use was in compliance with the American Physiological Society's “Guiding Principles in the Care and Use of Laboratory Animals,” and animal use protocols were approved by the North Florida/South Georgia Veterans Administration Institutional Animal Care and Use Committee.
Table 1.
Solutions
| Solution |
||||
|---|---|---|---|---|
| A | B | C | D | |
| NaCl | 119.2 | 79.2 | 119.2 | 0 |
| Na gluconate | 0 | 0 | 0 | 119.2 |
| KCl | 3 | 3 | 3 | 0 |
| HEPES | 25 | 25 | 0 | 0 |
| KH2PO4 | 2 | 2 | 2 | 2 |
| CaCl2 | 1.2 | 1.2 | 1.2 | 1.2 |
| Ca gluconate | 0 | 0 | 0 | 4 |
| MgSO4 | 1 | 1 | 1 | 1 |
| Alanine | 5 | 5 | 5 | 5 |
| Glucose | 8.3 | 8.3 | 8.3 | 8.3 |
| NH4Cl | 0 | 40 | 0 | 0 |
| NaHCO3 | 0 | 0 | 25 | 25 |
| Na acetate | 0 | 0 | 1 | 1 |
Solutions C and D were gassed with 95% O2-5% CO2 to pH 7.4 at 37°C and delivered to the bath chamber via a closed-syringe delivery system (PHD2000 infusion syringe pump, Harvard Apparatus, Holliston, MA) with polyethylene tubing (Intramedic, Becton Dickinson, Franklin Lakes, NJ). Under these conditions, there is no significant pH change from the delivery syringe to the perfusion chamber as verified by a bath pH probe (Accumet 13-620-96).
Intracellular pH measurements.
The acetoxymethyl ester and lipid-soluble form of the pH-sensitive dye BCECF (BCECF-AM, 15 μM) in solution A was added to the bath for ∼20 min, except in experiments measuring intracellular pH (pHi) in ICs. For experiments measuring pHi in the ICs of the CCD, BCECF-AM was added to the luminal perfusate (solution A) for 10 min, with continuous, heated bath perfusion with solution A. In all experiments after dye loading, the bathing solution was continuously applied at 3–4 ml/min at 37 ± 2°C, and fluorescence was measured after complete dye deesterification, as previously described (15).
IC characterization.
The perfusate and peritubular solutions were changed to HCO3-containing solution C. With use of a Cl-free solution (solution D), A- and B-type ICs were differentiated by the removal and return of luminal Cl followed by the removal and return of peritubular Cl (9, 15, 17, 25, 26). For experiments measuring the effect of Sch-28080 and ouabain on pHi recovery in ICs, only basolateral Cl removal was used to differentiate IC types (15, 17).
Acid loading and pHi recovery.
The bathing solution in the cell culture experiments and the luminal and peritubular solutions in the microperfusion experiments were changed to solution A containing inhibitors and vehicle as specified by the precise protocol for 20 min. For acid loading, a 3-min exposure of cells to 40 mM NH4Cl (solution B) containing inhibitors or vehicle was followed by NH4Cl removal (solution A). The most acidic pHi values achieved from acid loading (nadir) and pHi recovery were determined during the subsequent linear recovery phase.
Calculations.
In the cultured cell experiments, pHi was measured in individual, well-focused cells. In the microperfusion experiments, the entire fluorescing CD was selected as one region of interest (bath dye loading), or individual, well-focused ICs on the lateral walls of the basement membrane (luminal dye loading) were chosen for measurement, depending on the given protocol. pHi recovery rates were calculated from the initial linear portion of the pHi recovery curve starting from the nadir pHi and expressed as the change in pHi (ΔpHi) per minute (U/min). A high-K/nigericin (145 mM/15 μM) calibration was performed at the end of the experiment as modified by this laboratory and described originally by Thomas et al. (21). Linear regression was used to convert the ratiometric intensity measurements for each region of interest over the duration of the experiment to pHi. The intrinsic buffering capacity (βi) was calculated in HCO3-free solution from the following formula: βi = Δ[NH4]i/ΔpHi (18), where Δ[NH4]i is the change in the calculated intracellular NH4 concentration (pKa = 9.15) and ΔpHi is the change in pHi resulting from removal of peritubular NH4Cl during the acid-loading phase. H secretion rates (JH) were calculated from the following formula: JH = βi* U/min and expressed as [H]/min.
Real-time quantitative PCR.
Kidneys from female wild-type (C57BL/6J) mice were dissected into cortex, outer medulla, and inner medulla on a cold plate (4°C). Total RNA was extracted using TRIzol (Invitrogen), with DNA-Free (Ambion) used for DNase I treatment and Superscript III (Invitrogen) used for conversion of RNA to cDNA. Resulting cDNAs (20 ng) for HKα1, HKα2, and actin were amplified using TaqMan primers/probes (Mm00444423_m1 for HKα1, Mm00446786_m1 for HKα2, and Mm00607939_s1 for actin) and reagents from Applied Biosystems (Carlsbad, CA) in quantitative PCR (qPCR) on an Applied Biosystems 7500 Real Time PCR machine. Cycle threshold (Ct) values were normalized to actin mRNA, and relative mRNA expression of HKα1 and HKα2 in cortex, outer medulla, and inner medulla was quantified using the ΔΔCt method. Fold change in mRNA expression of HKα1 and HKα2 in the outer and inner medulla was calculated relative to the cortex (set to 1).
Total RNA from OMCD1 cells was also isolated, treated with DNase I, and converted to cDNA as described above for the tissues. Resulting cDNA (20 ng) for HKα1, H-ATPase B1, and actin were amplified using TaqMan primer/probes (Mm00460320_g1 for H-ATPase B1) and reagents (Applied Biosystems). Ct values were normalized to actin to generate ΔCt values as a relative measure of expression. There is an inverse relationship between ΔCt values and expression.
Chemicals.
All chemicals were obtained from Sigma-Aldrich or Fisher Scientific (Waltham, MA) unless otherwise specified. BCECF-AM was purchased from Molecular Probes (Eugene, OR) and frozen in 1-μl aliquots at −20°C in DMSO at 30 mM. On the day of the experiment, BCECF-AM was dissolved in solution A at a final concentration of 15 μM. Bafilomycin A1 was obtained from Calbiochem (Darmstadt, Germany), dissolved in DMSO at 100 μM, and stored at −20°C. EIPA was purchased from Sigma-Aldrich and frozen in aliquots at −20°C in DMSO at 0.2 M. Sch-28080 was purchased from Tocris (Ellisville, MO), dissolved in DMSO at 100 mM, and stored at −20°C. Immediately before use, bafilomycin A1, EIPA, and Sch-28080 were thawed and diluted to final concentration in solution A as designated below. Ouabain was obtained from Sigma-Aldrich. Nigericin was obtained from Sigma-Aldrich and stored at 4°C in ethanol and diluted to 15 μM in each standard.
Statistical analysis.
Values are means ± SE. Data compared between groups were examined by unpaired Student's t-test (Origin 7.0, OriginLab). Differences between groups were considered statistically significant at P < 0.05.
RESULTS
Characterization of IC type in the microperfused CCD.
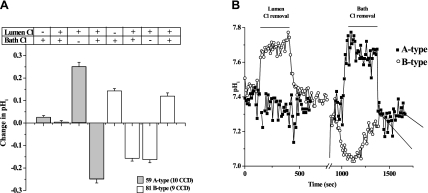
Figure 1 shows the effect of luminal and peritubular Cl removal on pHi in ICs of the CCD. As shown in Fig. 1A, A-type ICs (59 from 10 CCDs) did not respond significantly to luminal Cl removal but alkalinized 0.251 ± 0.02 pHi unit and reacidified −0.249 ± 0.02 pHi unit in response to peritubular Cl removal and readdition, respectively. B-type ICs (81 from 9 CCDs) alkalinized 0.143 ± 0.01 pHi unit and reacidified −0.157 ± 0.01 pHi unit in response to luminal Cl removal and readdition, respectively. The same B-type ICs acidified −0.163 ± 0.01 pHi unit and realkalinized 0.120 ± 0.01 pHi unit in response to basolateral Cl removal and readdition, respectively. Example tracings are shown in Fig. 1B.
Fig. 1.
Differentiation of A- and B-type intercalated cells (ICs) in mouse cortical collecting duct (CCD). A: effect of luminal and peritubular Cl removal (−) and return (+) on intracellular pH (pHi) in each IC type. B: typical traces for each cell type.
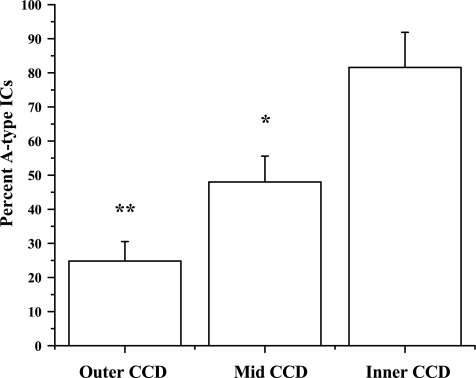
We evaluated the percentage of A-type ICs of the measurable ICs in specific regions of the CCD to determine whether our functional examination of IC type was in agreement with ultrastructural and immunological studies in the mouse. CCDs were dissected from the outer, middle, and inner portions of the cortex, and the percentage of A-type ICs is shown in Fig. 2. Of 56 CCDs investigated, the greatest percentage of A-type ICs (82 ± 10%) originated from the inner region of the CCD, a smaller percentage originated from the middle region (48 ± 8%), and the smallest percentage originated from the outer region (25 ± 6%). The frequency differences between the segments were significantly different (P < 0.03).
Fig. 2.
Percentage of A-type ICs in outer, middle, and inner CCD. Frequency at which an IC was characterized as A-type was calculated and expressed as percentage of total measurable ICs within a given CCD dissected from outer, mid, or inner portion of the cortex. Percentage of A-type ICs increased from outer to inner cortex. Majority of ICs in the inner portion of the cortex were A-type. *P < 0.03 vs. inner CCD. **P < 0.03 vs. mid CCD.
pHi recovery in the microperfused CD.
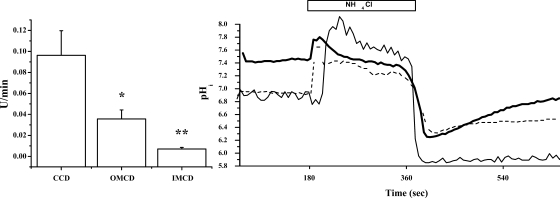
In vitro microperfusion experiments designed to determine which CD segment possessed the greatest rate of H-K-ATPase-mediated pHi recovery revealed that EIPA- and luminal bafilomycin A1-insensitive pHi recovery was greatest in the CCD. Specifically, peritubular EIPA (10 μM)- and luminal bafilomycin A1 (30 nM)-insensitive pHi recovery in the microperfused CD was 0.10 ± 0.02 (n = 5) in the CCD, 0.04 ± 0.01 (n = 5) in the OMCD, and 0.01 ± 0.00 (n = 3) in the IMCD (Fig. 3). pHi recovery was significantly slower in the OMCD than in the CCD (P < 0.05) and significantly slower in the IMCD than in the OMCD (P < 0.05). The average nadir pHi and βi were not different between segments (data not shown). Figure 3 also shows traces from each segment.
Fig. 3.
H-K-ATPase-mediated pHi recovery in microperfused mouse collecting duct (CD). Cell-averaged pHi recovery (peritubular BCECF-AM loading) in the presence of EIPA and bafilomycin A1 was measured in CD segments from cortex (CCD) and outer and inner medulla (OMCD and IMCD, respectively). CCD exhibited the highest rates of pHi recovery. Thick solid line, CCD; dashed line, OMCD; thin solid line, IMCD. *P < 0.05 vs. CCD. **P < 0.05 vs. OMCD.
H-K-ATPase-mediated pHi recovery in ICs of the CCD.
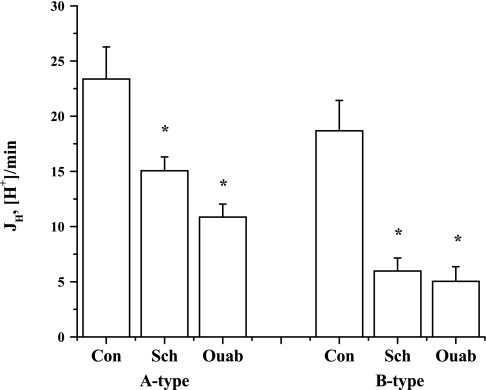
The experiments shown in Table 2 addressed whether H-K-ATPase activity in A- and B-type ICs was sensitive to known H-K-ATPase inhibitors, Sch-28080 (10 μM) and ouabain (2 mM), when applied to the lumen. There was no difference between βi of A-type ICs and βi of B-type ICs. Buffering capacities were not different between the control and Sch-28080 groups in the A- or B-type ICs. Because ouabain significantly decreased βi in A- and B-type ICs compared with the control groups, it was important to compare JH. Figure 4 illustrates the effect of Sch-28080 and ouabain on EIPA (10 μM)- and luminal bafilomycin A1 (100 nM)-insensitive JH in A- and B-type ICs of the CCD. Luminal addition of Sch-28080 significantly inhibited EIPA- and luminal bafilomycin A1-insensitive JH in A- and B-type ICs. Similarly, luminal addition of ouabain significantly inhibited EIPA- and luminal bafilomycin A1-insensitive JH in A- and B-type ICs. Sch-28080 inhibited JH by 35.6 ± 5.3% in A-type ICs and 68.0 ± 6.3% in B-type ICs (compared with the mean JH in each control group). Ouabain inhibited JH by 53.5 ± 5.0% in A-type ICs and 73.0 ± 7.1% in B-type ICs. The percent inhibition of JH by either inhibitor was greater in B-type ICs [P < 0.01 (Sch-28080), P < 0.03 (ouabain)].
Table 2.
Effect of Sch-28080 and ouabain on βi, pHi recovery, and JH in A- and B-type ICs of the CCD in the presence of EIPA and luminal bafilomycin A1
| N(n) | βi | pHi Recovery, U/min | JH, mM H/min | |
|---|---|---|---|---|
| A-type ICs | ||||
| Control | 29(6) | 74.33 ± 3.85 | 0.30 ± 0.03 | 23.36 ± 2.91 |
| Sch-28080 | 38(5) | 73.36 ± 4.87 | 0.22 ± 0.02† | 15.06 ± 1.25* |
| Ouabain | 35(5) | 56.92 ± 3.07* | 0.21 ± 0.02† | 10.86 ± 1.18* |
| B-type ICs | ||||
| Control | 25(6) | 72.68 ± 7.48 | 0.26 ± 0.03 | 18.68 ± 2.75 |
| Sch-28080 | 22(3) | 63.75 ± 4.60 | 0.12 ± 0.28* | 5.97 ± 1.18* |
| Ouabain | 25(4) | 41.34 ± 2.97* | 0.12 ± 0.03* | 5.03 ± 1.32* |
Values are means ± SE; N, number of cells; n, number of tubules. ICs, intercalated cells; pHi, intracellular pH; CCD, cortical collecting duct; βi, intrinsic buffering capacity; JH, H secretion rate. All comparisons are within the same cell type.
P < 0.01 vs. control.
P < 0.02 vs. control.
Fig. 4.
Effect of luminal Sch-28080 (Sch) and ouabain (Ouab) on EIPA- and luminal bafilomycin A1-insensitive H secretion rate (JH) in A- and B-type ICs of the CCD. Sch-28080 inhibited 36% and 68% of the H-K-ATPase-mediated H secretion in A- and B-type ICs, respectively. Ouabain inhibited 54% and 73% of this activity in A- and B-type ICs, respectively. HKα1 and HKα2 H-K-ATPases mediate H secretion in ICs of the mouse CCD. *P < 0.01 vs. control (Con) within the same cell type.
Contribution of the H-ATPase was evaluated in A- and B-type ICs (Tables 3 and 4). Luminal bafilomycin A1 (30 nM) significantly inhibited EIPA (10 μM)-insensitive JH in A- and B-type ICs (Table 3). In the presence of EIPA (10 μM) and luminal bafilomycin A1 (30 nm), basolateral bafilomycin A1 (30 nM) failed to inhibit JH in the A-type IC but significantly inhibited JH by 50% in the B-type IC (Table 4).
Table 3.
Effect of luminal bafilomycin A1 on βi, pHi recovery, and JH in A- and B-type ICs of the CCD in the presence of EIPA
| N(n) | βi | pHi Recovery, U/min | JH, mM H/min | |
|---|---|---|---|---|
| A-type ICs | ||||
| Control | 18(5) | 72.99 ± 3.78 | 0.31 ± 0.02 | 23.03 ± 1.85 |
| Luminal BafA1 | 26(5) | 62.59 ± 5.26 | 0.21 ± 0.04† | 9.48 ± 0.98* |
| B-type ICs | ||||
| Control | 36(4) | 58.21 ± 2.97 | 0.30 ± 0.03 | 16.16 ± 1.30 |
| Luminal BafA1 | 22(3) | 55.82 ± 4.84 | 0.11 ± 0.02* | 6.00 ± 0.96* |
Values are means ± SE; N, number of cells; n, number of tubules. BafA1, bafilomycin A1. All comparisons are within the same cell type.
P < 0.01 vs. control.
P < 0.05 vs. control.
Table 4.
Effect of peritubular bafilomycin A1 on βi, pHi recovery, and JH in A- and B-type ICs of the CCD in the presence of luminal bafilomycin A1 and EIPA
| N(n) | βi | pHi Recovery, U/min | JH, mM H/min | |
|---|---|---|---|---|
| A-type ICs | ||||
| Con | 9(3) | 68.70 ± 10.39 | 0.18 ± 0.03 | 10.82 ± 0.74 |
| Bath BafA1 | 24(4) | 85.86 ± 15.04 | 0.18 ± 0.02 | 13.49 ± 2.63 |
| B-type ICs | ||||
| Con | 18(4) | 74.47 ± 10.30 | 0.16 ± 0.02 | 10.31 ± 1.82 |
| Bath BafA1 | 18(4) | 68.63 ± 10.68 | 0.10 ± 0.01* | 5.18 ± 0.67* |
Values are means ± SE; N, number of cells; n, number of tubules. All comparisons are within the same cell type.
P < 0.02 vs. control.
qPCR of HKα1 and HKα2 mRNA in cortex, outer medulla, and inner medulla.
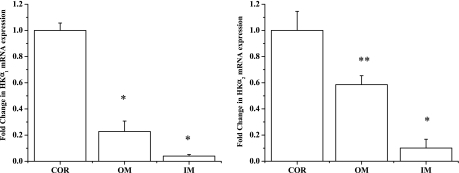
Figure 5 compares the level of expression of each individual HKα isoform in the cortex with its level of expression in the outer and inner medulla. HKα1 mRNA expression was 72% less in the outer medulla than in the cortex [1.01 ± 0.06 (n = 6) vs. 0.28 ± 0.08 (n = 6), P < 0.01] and 95% less in the inner medulla than in the cortex [1.01 ± 0.08 (n = 6) vs. 0.05 ± 0.01 (n = 6), P < 0.01]. Similarly, HKα2 mRNA expression was 42% less in the outer medulla than in the cortex [1.05 ± 0.15 (n = 6) vs. 0.61 ± 0.07 (n = 6), P < 0.03] and 83% less in the inner medulla than in the cortex [1.05 ± 0.15 (n = 6) vs. 0.18 ± 0.07 (n = 6), P < 0.01].
Fig. 5.
Fold change in mRNA expression of HKα1 and HKα2 in cortex (COR), outer medulla (OM), and inner medulla (IM). Level of HKα1 and HKα2 mRNA expression is higher in cortex than in outer and inner medulla. *P < 0.01 vs. COR. **P < 0.03 vs. COR.
pHi recovery in cultured cells of the CD.
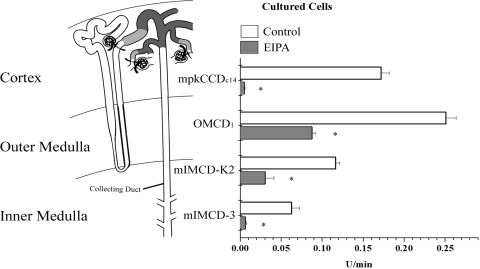
pHi recovery was compared in immortalized cells derived from segments along the mouse CD (Table 5). Figure 6 illustrates the rates of pHi recovery (U/min) in cultured cells of the CCD, OMCD, and initial and terminal IMCD and reveals EIPA-sensitive H transport in all four cell models. In the absence of inhibitors, pHi recovery was greatest in the inner stripe-derived OMCD1 cells and less in mpkCCDc14, mIMCD-K2, and mIMCD-3 cells, all of principal cell (PC) origin. pHi recovery in the mpkCCDc14 cells was 0.17 ± 0.01 (n = 39). EIPA (10 μM) abolished (P < 0.01) this recovery to 0.00 ± 0.001 (n = 15). Cultured cells from the inner stripe of the OMCD (OMCD1) recovered at 0.25 ± 0.01 (n = 10), and EIPA significantly inhibited (P < 0.01) 65% of this recovery to 0.09 ± 0.004 (n = 19). Cultured cells from the initial one-half of the IMCD (mIMCD-K2) recovered at 0.12 ± 0.004 (n = 7), and EIPA significantly inhibited (P < 0.01) 74% of this recovery to 0.03 ± 0.01 (n = 17). Cultured cells from the terminal inner medullary region of the CD (mIMCD-3) recovered at 0.05 ± 0.01 (n = 11), and EIPA significantly inhibited (P < 0.01) 80% of the recovery to 0.01 ± 0.01 (n = 21). Of these four cell models, the OMCD1 cell model had substantial EIPA-insensitive pHi recovery. The βi varied among cell models; therefore, JH was also compared and is shown in Table 2. Similar to pHi recovery rates, JH was greatest in the OMCD1, and EIPA significantly inhibited JH in all four cell models.
Table 5.
βi, pHi recovery, and JH in cultured cells of the CD
| N | βi | pHi Recovery, U/min | JH, mM H/min | |
|---|---|---|---|---|
| mpkCCDc14 | ||||
| Control | 39 | 5.19 ± 0.70 | 0.17 ± 0.01 | 0.87 ± 0.13 |
| EIPA | 15 | 11.49 ± 1.81 | 0.00 ± 0.001* | 0.05 ± 0.01* |
| OMCD1 | ||||
| Control | 10 | 111.27 ± 4.97 | 0.25 ± 0.01 | 27.60 ± 1.19 |
| EIPA | 20 | 74.19 ± 3.33 | 0.09 ± 0.004* | 6.74 ± 0.56* |
| EIPA + BafA1 | 30 | 89.63 ± 3.66 | 0.10 ± 0.01 | 9.10 ± 0.60† |
| EIPA + BafA1 + Sch | 27 | 72.42 ± 5.93 | 0.02 ± 0.001‡ | 1.09 ± 0.08‡ |
| mIMCD-K2 | ||||
| Control | 7 | 30.42 ± 0.39 | 0.12 ± 0.004 | 3.51 ± 0.15 |
| EIPA | 17 | 34.64 ± 3.56 | 0.03 ± 0.01* | 0.93 ± 0.33* |
| mIMCD-3 | ||||
| Control | 11 | 37.84 ± 8.22 | 0.05 ± 0.01 | 1.63 ± 0.29 |
| EIPA | 21 | 18.80 ± 2.04 | 0.01 ± 0.001* | 0.13 ± 0.02* |
Values are means ± SE; N, number of cells. Sch, Sch-28080. All comparisons are within the same cell type.
P < 0.01 vs. control.
P < 0.02 vs. EIPA.
P < 0.01 vs. EIPA + BafA1.
Fig. 6.
pHi recovery in mouse CD cells. pHi recovery was measured in renal cell models derived from mouse CD epithelia. mpkCCDc14, OMCD1, mIMCD-K2, and mIMCD-3 cells represent epithelia of CCD, OMCD, and initial and terminal segments of IMCD, respectively, and each exhibited significant EIPA-sensitive pHi recovery. OMCD1 cells, originating from the inner stripe region of the OMCD, exhibited the highest rate of EIPA-insensitive pHi recovery. *P < 0.01 vs. control within the same cell line.
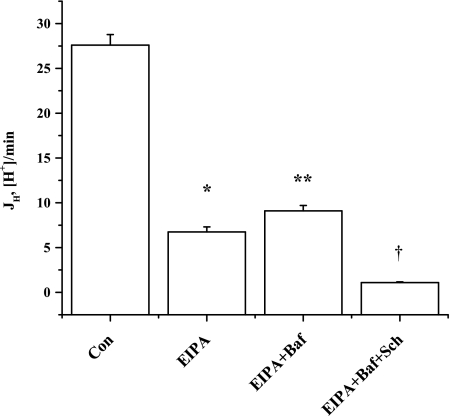
Further investigation of residual pHi recovery in the OMCD1 cultured cells, where EIPA-insensitive JH was greatest, revealed that bafilomycin A1 (50 nM) did not reduce, but rather increased (P < 0.02), the EIPA-insensitive JH (Fig. 7, Table 5). In the presence of EIPA and bafilomycin A1, JH was 9.10 ± 0.60 (n = 30), and the HKα1 H-K-ATPase inhibitor Sch-28080 (10 μM) significantly inhibited (P < 0.01) 88% of this JH to 1.09 ± 0.08 (n = 27). Additionally, qPCR revealed that these cells express HKα1 and H-ATPase B1 mRNA, with ΔCt values, relative to actin, of 16.4 ± 0.2 (n = 4) and 12.2 ± 0.2 (n = 4), respectively.
Fig. 7.
JH in OMCD1 cultured cells. OMCD1 cells exhibit significant EIPA-insensitive pHi recovery that was not inhibited by the H-ATPase inhibitor bafilomycin A1 (Baf). EIPA- and bafilomycin A1-insensitive pHi recovery was sensitive to the HKα1 H-K-ATPase inhibitor Sch-28080. *P < 0.01 vs. Con. **P < 0.02 vs. EIPA. †P < 0.01 vs. EIPA + Baf.
DISCUSSION
The present study establishes that, under normal dietary conditions, there is axial and cellular heterogeneity of H-K-ATPase-mediated H secretion along the mouse CD. Substantial H-K-ATPase-mediated H secretion occurs in the mouse CCD compared with the medullary segments, and ICs from the native CCD exhibit profound rates of H-K-ATPase-mediated H secretion compared with cell-averaged CCD segments. Additionally, this study evaluated H secretion in four commonly used immortalized renal cell models derived from mouse and concludes that only the OMCD1 cell line exhibited significant H-K-ATPase activity, thus demonstrating the need for an IC model conserving H transport mechanisms observed in the native tissue.
Here we report Sch-28080- and ouabain-sensitive H transport in A- and B-type ICs, suggesting that both H-K-ATPase subtypes participate in pHi regulation in each IC type under normal dietary conditions. This is in agreement with our recent report that the genetic disruption of either H-K-ATPase α-subunit significantly diminished the ability of A- and B-type ICs of the CCD to recover from acute acid loading (15). In the present study, there was a greater degree of inhibition by either inhibitor in the B-type IC.
A limited number of studies support a role for the highly inducible HKα2 H-K-ATPase in H transport under normal conditions; however, immunohistochemistry demonstrates that HKα2 protein is present in the apical membrane of CCD A- and B-type ICs from rabbits fed a normal diet (22), and we recently reported that deletion of the HKα2 gene significantly inhibits H secretion in mouse A- and B-type ICs by 45% and 51%, respectively (15).
There was a significant contribution of the H-ATPase to H transport in A- and B-type ICs, suggesting that both mechanisms participate in pHi regulation in each IC type under normal dietary conditions. An additional inhibitory effect of bafilomycin A1 was apparent in the B-type IC when the drug was added to the peritubular solution.
Our data in the microperfused CD suggest that the H-K-ATPase mediates H transport primarily in the CCD and, to a lesser extent, in the OMCD and IMCD. Consistent with these microperfusion data, HKα1 and HKα2 mRNA expression as determined by qPCR is greatest in the cortex, less in the outer medulla, and least in the inner medulla. The greater expression of HKα1 and HKα2 mRNA in the cortex may be the result of localization of these subunits in other cortical segments in addition to the CCD, including the connecting segment and initial collecting tubule (1, 2, 7, 8, 22).
pHi recovery was substantially inhibited by EIPA in all four cell lines tested (97% in mpkCCDc14, 65% in OMCD1, 74% in mIMCD-K2, and 90% in mIMCD-3), suggesting that Na/H exchange mediates the majority of H secretion in these cell culture models and, to a large extent, in mpkCCDc14 and mIMCD-3 cells. In mpkCCDc14, mIMCD-K2, and mIMCD-3 cells, pHi recovery is <0.05 U/min (<1 mM H/min) in the presence of EIPA. The H-K-ATPase has been previously reported to mediate pHi recovery in mIMCD-3 cells (16), albeit at low rates.
We further investigated the H secretory mechanisms in the OMCD1 cells by testing the effect of bafilomycin A1 (50 nM in the presence of EIPA) and Sch-28080 (10 μM in the presence of EIPA and bafilomycin A1) and by evaluating the abundance of the H-ATPase B1 subunit and HKα1 mRNA. Our data suggest that although the mRNA for both proton pumps is expressed, an H-K-ATPase, and not an H-ATPase, mediates H secretion under these conditions, since Sch-28080, and not bafilomycin A1, decreased the EIPA-insensitive pHi recovery. A previous report investigating the contribution of H-K-ATPase and H-ATPase to H transport in these cells (11) showed that, in the presence of K (as in our studies), Sch-28080 (10 μM), but not bafilomycin A1 (10 nM), inhibited pHi recovery. Furthermore, Guntupalli et al. (11) report that this K-dependent activity was stimulated with low-K growth medium, whereas bafilomycin A1 sensitivity was present only when pHi recovery was measured in the absence of K, and this H-ATPase activity was stimulated with low-pH growth medium.
There are some discrepancies between the native tissue and the cell culture models tested. 1) In the native tissue, the greatest H-K-ATPase-mediated transport rates were in the CCD, specifically in the ICs, yet the cultured cells originating from the CCD (mpkCCDc14) exhibited virtually no EIPA-insensitive pHi recovery. 2) H-K-ATPase-mediated H transport in the native OMCD was only 40% of that observed in the OMCD1 cell line. The most likely explanation for these differences is that the intact tubule exhibits net transport characteristics that may be absent in the homogeneous cell populations of cell culture. Also, immortalized cell models may not express the same complement of proteins as the native cell.
The rate of H-K-ATPase-mediated H transport in ICs of the native CD far exceeds (∼3-fold) the net rate in the cell-averaged CCD experiments. This is likely due to the dilution of the IC signal from surrounding PCs, which do not exhibit the robust activity observed in the ICs. Indeed, the mpkCCDc14 cells exhibit characteristics of the PCs of the CCD, which do not possess high rates of H secretion and presented only Na/H exchange activity in these experiments. No immortalized cell line originates from A- or B-type ICs.
The H-K-ATPase activity of the OMCD cell line appears augmented compared with the native tissue. These results may reflect the known morphological heterogeneity of the inner stripe of the OMCD (OMCDi). At least in rabbit and mouse, the native OMCDi possesses two morphologically distinct cell types (14, 20). The OMCD1 cell line originated from the inner stripe cell of the OMCD and preserves many characteristics of this segment (11). Guntupalli et al. (11) report that, morphologically, these cells resemble PCs and do not exhibit phenotypic characteristics of ICs. Several reports support the presence of H-K-ATPase in the PCs of the OMCD. Recently, we reviewed the localization of the H-K-ATPases, as well as the effect of hypokalemia and other pathophysiological conditions on the distribution and activities of these enzymes (10). In rats fed a normal diet, HKα2 appeared to be exclusively present in the PC of the OMCD (19). In a careful evaluation of HKα2c localization in rabbit kidney, ICs and PCs of the OMCD inner stripe exhibited immunoreactivity (22); however, the staining was more intense in the ICs than in the PCs. In an in vivo expression system, HKα2/enhanced green fluorescent protein, the endogenous HKα2, and aquaporin 2 colocalize in the mouse OMCD, indicating expression in PCs (28). Furthermore, HKα1 mRNA and protein have also been reported in the OMCD of rat and rabbit (1, 3, 27). Perhaps more importantly, a K-dependent and Sch-28080-sensitive acid secretory mechanism was reported in response to acute H loading in PCs and ICs in the rabbit OMCDi (24). These considerations illustrate that our knowledge of these H-K-ATPases remains incomplete and deserves further examination.
To our knowledge, this is the first report to characterize B-type ICs in mouse by luminal Cl removal. In the present study, ICs were characterized by the degree of change in pHi 1) in response to removal and return of luminal Cl and 2) after a short equilibration and removal and return of peritubular Cl. Thus ICs were identified by the degree of change in pHi from removal of Cl, as well as the opposite change in pHi that resulted from the readdition of Cl. We observed that the subsequent removal of peritubular Cl resulted in a decrease in pHi in all but 4 of 79 cells that alkalinized with luminal Cl removal. Only one of these cells had appreciable alkalinization (>0.05 U). The lack of acidification in a minority of the cells that significantly alkalinized with luminal Cl removal may be explained by differences in IC intracellular Cl concentration and basolateral Cl channel activity. Importantly, of all the cells that exhibited acidification with peritubular Cl removal, only two cells failed to alkalinize during the preceding luminal Cl phase. We conclude that removal of peritubular Cl is sufficient to characterize IC type.
Our investigation of the frequency of functionally defined ICs was limited to well-focused, discrete ICs of the CCD. Of these, nearly half of the ICs in the middle portion of the CCD and a majority in the inner region of the CCD were A-type ICs. These data are consistent with data from ultrastructural and immunological studies (12, 20).
In summary, we report that 1) there is axial heterogeneity of H-K-ATPase-mediated H secretion in CDs of mice fed a normal diet, 2) HKα1 and HKα2 isoforms contribute to pHi recovery in the ICs of the CCD of normal mice and the extent of the contribution of each isoform is quantitatively similar to that observed using knockout mice, 3) within the CCD there is axial heterogeneity with quantitatively a greater percentage of functionally defined A- than B-type ICs in the inner CCD, 4) peritubular Cl removal accurately predicts whether an IC is an A- or B-type IC, 5) of the cell models examined, substantial rates of H-K-ATPase activity were observed only in OMCD1, and 6) the rates of pHi recovery in each cell model were quantitatively much less than in the ICs of the native CCD.
GRANTS
These studies were supported by National Institute of Diabetes and Digestive and Kidney Diseases Grant R01-DK-049750 (to C. Wingo) and by funds from the Medical Research Service of the North Florida/South Georgia Veterans Health System.
DISCLOSURES
No conflicts of interest are declared by the authors.
REFERENCES
- 1.Ahn KY, Kone BC. Expression and cellular localization of mRNA encoding the “gastric” isoform of the H+-K+-ATPase in rat kidney. Am J Physiol Renal Fluid Electrolyte Physiol 268: F99–F109, 1995 [DOI] [PubMed] [Google Scholar]
- 2.Ahn KY, Park KY, Kim KK, Kone BC. Chronic hypokalemia enhances expression of the H+-K+-ATPase α2-subunit gene in renal medulla. Am J Physiol Renal Fluid Electrolyte Physiol 271: F314–F321, 1996 [DOI] [PubMed] [Google Scholar]
- 3.Bastani B. Co-localization of H-ATPase and H,K-ATPase immunoreactivity in the rat kidney. J Am Soc Nephrol 5: 1476–1482, 1995 [DOI] [PubMed] [Google Scholar]
- 4.Bens M, Vallet V, Cluzeaud F, Pascual-Letallec L, Kahn A, Rafestin-Oblin ME, Rossier BC, Vandewalle A. Corticosteroid-dependent sodium transport in a novel immortalized mouse collecting duct principal cell line. J Am Soc Nephrol 10: 923–934, 1999 [DOI] [PubMed] [Google Scholar]
- 5.Codina J, DuBose TD., Jr Molecular regulation and physiology of the H+,K+-ATPases in kidney. Semin Nephrol 26: 345–351, 2006 [DOI] [PubMed] [Google Scholar]
- 6.Dherbecourt O, Cheval L, Bloch-Faure M, Meneton P, Doucet A. Molecular identification of Sch28080-sensitive K-ATPase activities in the mouse kidney. Pflügers Arch 451: 769–775, 2006 [DOI] [PubMed] [Google Scholar]
- 7.Fejes-Toth G, Naray-Fejes-Toth A. Immunohistochemical localization of colonic H-K-ATPase to the apical membrane of connecting tubule cells. Am J Physiol Renal Physiol 281: F318–F325, 2001 [DOI] [PubMed] [Google Scholar]
- 8.Fejes-Toth G, Naray-Fejes-Toth A, Velazquez H. Intrarenal distribution of the colonic H,K-ATPase mRNA in rabbit. Kidney Int 56: 1029–1036, 1999 [DOI] [PubMed] [Google Scholar]
- 9.Furuya H, Breyer MD, Jacobson HR. Functional characterization of α- and β-intercalated cell types in rabbit cortical collecting duct. Am J Physiol Renal Fluid Electrolyte Physiol 261: F377–F387, 1991 [DOI] [PubMed] [Google Scholar]
- 10.Gumz ML, Lynch IJ, Greenlee MM, Cain BD, Wingo CS. The renal H+-K+-ATPases: physiology, regulation, and structure. Am J Physiol Renal Physiol 298: F12–F21, 2010 [DOI] [PMC free article] [PubMed] [Google Scholar]
- 11.Guntupalli J, Onuigbo M, Wall S, Alpern RJ, DuBose TD., Jr Adaptation to low-K+ media increases H+-K+-ATPase- but not H+-ATPase-mediated pHi recovery in OMCD1 cells. Am J Physiol Cell Physiol 273: C558–C571, 1997 [DOI] [PubMed] [Google Scholar]
- 12.Kim J, Kim YH, Cha JH, Tisher CC, Madsen KM. Intercalated cell subtypes in connecting tubule and cortical collecting duct of rat and mouse. J Am Soc Nephrol 10: 1–12, 1999 [DOI] [PubMed] [Google Scholar]
- 13.Kizer NL, Lewis B, Stanton BA. Electrogenic sodium absorption and chloride secretion by an inner medullary collecting duct cell line (mIMCD-K2). Am J Physiol Renal Fluid Electrolyte Physiol 268: F347–F355, 1995 [DOI] [PubMed] [Google Scholar]
- 14.Lefurgey A, Tisher CC. Morphology of rabbit collecting duct. Am J Anat 155: 111–124, 1979 [DOI] [PubMed] [Google Scholar]
- 15.Lynch IJ, Rudin A, Xia SL, Stow LR, Shull GE, Weiner ID, Cain BD, Wingo CS. Impaired acid secretion in cortical collecting duct intercalated cells from H-K-ATPase-deficient mice: role of HKα isoforms. Am J Physiol Renal Physiol 294: F621–F627, 2008 [DOI] [PubMed] [Google Scholar]
- 16.Ono S, Guntupalli J, DuBose TD., Jr Role of H+-K+-ATPase in pHi regulation in inner medullary collecting duct cells in culture. Am J Physiol Renal Fluid Electrolyte Physiol 270: F852–F861, 1996 [DOI] [PubMed] [Google Scholar]
- 17.Petrovic S, Spicer Z, Greeley T, Shull GE, Soleimani M. Novel Schering- and ouabain-insensitive potassium-dependent proton secretion in the mouse cortical collecting duct. Am J Physiol Renal Physiol 282: F133–F143, 2002 [DOI] [PubMed] [Google Scholar]
- 18.Roos A, Boron WF. Intracellular pH. Physiol Rev 61: 296–434, 1981 [DOI] [PubMed] [Google Scholar]
- 19.Sangan P, Rajendran VM, Mann AS, Kashgarian M, Binder HJ. Regulation of colonic H-K-ATPase in large intestine and kidney by dietary Na depletion and dietary K depletion. Am J Physiol Cell Physiol 272: C685–C696, 1997 [DOI] [PubMed] [Google Scholar]
- 20.Teng-umnuay P, Verlander JW, Yaun W, Tisher CC, Madsen KM. Identification of distinct subpopulations of intercalated cells in the mouse collecting duct. J Am Soc Nephrol 7: 260–274, 1996 [DOI] [PubMed] [Google Scholar]
- 21.Thomas JA, Buchsbaum RN, Zimniak A, Racker E. Intracellular pH measurements in Ehrlich ascites tumor cells utilizing spectroscopic probes generated in situ. Biochemistry 18: 2210–2218, 1979 [DOI] [PubMed] [Google Scholar]
- 22.Verlander JW, Moudy RM, Campbell WG, Cain BD, Wingo CS. Immunohistochemical localization of H-K-ATPase α2c-subunit in rabbit kidney. Am J Physiol Renal Physiol 281: F357–F365, 2001 [DOI] [PubMed] [Google Scholar]
- 23.Wallmark B, Briving C, Fryklund J, Munson K, Jackson R, Mendlein J, Rabon EC, Sachs G. Inhibition of gastric H+,K+-ATPase and acid secretion by SCH 28080, a substituted pyridyl (1,2a)imidazole. J Biol Chem 262: 2077–2084, 1987 [PubMed] [Google Scholar]
- 24.Weiner ID, Frank AE, Wingo CS. Apical proton secretion by the inner stripe of the outer medullary collecting duct. Am J Physiol Renal Physiol 276: F606–F613, 1999 [DOI] [PubMed] [Google Scholar]
- 25.Weiner ID, Hamm LL. Regulation of intracellular pH in the rabbit cortical collecting tubule. J Clin Invest 85: 274–281, 1990 [DOI] [PMC free article] [PubMed] [Google Scholar]
- 26.Weiner ID, Weill AE, New AR. Distribution of Cl−/HCO3− exchange and intercalated cells in rabbit cortical collecting duct. Am J Physiol Renal Fluid Electrolyte Physiol 267: F952–F964, 1994 [DOI] [PubMed] [Google Scholar]
- 27.Wingo CS, Madsen KM, Smolka A, Tisher CC. H-K-ATPase immunoreactivity in cortical and outer medullary collecting duct. Kidney Int 38: 985–990, 1990 [DOI] [PubMed] [Google Scholar]
- 28.Zhang W, Xia X, Zou L, Xu X, LeSage GD, Kone BC. In vivo expression profile of a H+-K+-ATPase α2-subunit promoter-reporter transgene. Am J Physiol Renal Physiol 286: F1171–F1177, 2004. [DOI] [PubMed] [Google Scholar]


