Abstract
The asymmetric stretching vibration of the amphiphilic trifluoroacetate ion and its 13C=16O isotopologue in D2O were investigated with infrared spectroscopy (FTIR), ultrafast infrared pump probe, and two dimensional vibrational photon echo techniques and simulations. Trifluoroacetate ions have a nonexponential depopulation of the first vibrational excited state, which is well described by a kinetic mechanism involving a temperature dependent solvent assisted relaxation to the symmetric stretch mode. The vibrational spectrum of the asymmetric stretch of the 13C=16O isotopologue presents an unusual spectral shape. The frequency-frequency autocorrelation function shows a static term not present in the 13C=16O form, which is caused by an accidental degeneracy with a combinational mode. A newly developed frequency map for carboxylate is used to characterize the processes and dynamics observed in the frequency fluctuations of the carboxylate asymmetric stretch mode in aqueous solution. An assignment of the molecular processes that govern the frequency fluctuations is suggested from an analysis of the solvation shell configurations obtained from molecular dynamics simulations.
INTRODUCTION
Ions in aqueous environments play a major role in the structure and function of many biomolecules. Since ions are charged entities, water binds strongly to them affecting their own and the solute’s vibrational dynamics. Many previous studies have addressed the solvent-solute interaction through the vibrational dynamics of aqueous ions. In these studies, the investigated ions range from small and simple such as cyanide, azide, etc., to large and complex such as trimethylamine N-oxide, guanidinium, etc.1, 2, 3, 4 The results of these studies show that regardless of the size and complexity, ions often have vibrational energy relaxation occurring on picosecond and∕or femtosecond time scale. The observed characteristic times have been attributed to the coupling of the system with the solvent in small ions, and∕or to the solvent induced vibrational coupling with internal modes in large ones. The evidence of the involvement of solvent modes has been obtained from the lifetime dependence on the isotope composition of the solvent.1 In addition, all the ions, in particular those exhibiting an important intramolecular vibrational coupling, display exponential decay of the population of the first vibrational excited state.
Also many studies have used these ions as a means for studying the dynamics of the surrounding water structure.3, 5, 6 Among the various results for small ions, it has been suggested that water has different dynamics depending on whether it belongs or not to the solute solvation shell.6 In particular, it has been observed that the reorientation of water is significantly slowed when the molecule is located in the vicinity of hydrophobic groups of amphiphilic ions.3 This effect has been attributed to an icelike water structure or iceberg model,7 whereas NMR experiments8 and molecular dynamics (MD) simulation results9 attribute such changes to slower hydrogen bond exchange. Thus, it is important to investigate properties of new amphiphilic systems.
Trifluoroacetate (TFA), is a small molecule-ion where the polar carboxylate and nonpolar trifluoromethyl spheres of influence on the aqueous solvent are spaced within a few angstroms and essentially overlapping. Therefore the balance between the water structures in the hydrophilic and hydrophobic regions must be a crucial component of the solvent structural dynamics. On the one hand the –CF3 group is repelling water molecules and perhaps initiating formation of an “iceberg” state,7 whereas the group is strongly associating with water molecules that are in the same solvation shell. This amphiphilic property, acting over such small length scales, presents new questions regarding the water dynamical properties that might prevail in such situations.
The study of TFA presented here uses both pump probe and two dimensional (2D) vibrational echo spectroscopy of the carboxylate group vibrations, which act as sensors of the local water structure and its motions on ultrafast time scales. In contrast to other techniques, the infrared ultrafast spectroscopies allow one to distinguish between the dynamics of the solvation shell and the bulk liquid. This advantage added to their subpicosecond time resolution makes IR ultrafast spectroscopies very useful tools with which to elucidate the dynamics and mechanism of processes occurring in aqueous media.
Vibrational echo spectroscopy has been successfully used to model structure and dynamics of many ions in solution.1, 5, 6 One important property extracted from 2D vibrational echo measurements is the autocorrelation function of the frequency fluctuations.10, 11 These fluctuations are directly correlated to the change of the gap between vibrational levels induced by the environment of the vibrator. However, the assignment of the characteristic times of the frequency fluctuations to specific molecular process remains as a challenging task. To achieve this goal, vibrational echo studies have been complemented by simulations. For some vibrators, such as amide C=O and water O–H, it has been shown that the shift in frequency is closely correlated with the electrostatic fields and field gradients created at the vibrating bonds by the fluctuating charges of the surrounding solvent molecules.12, 13, 14 Furthermore these electrostatic fields have provided a good description of the autocorrelation function of the frequency fluctuations observed experimentally. Several models have been used to link the vibrational parameters to their corresponding fluctuations. In all approaches the electrostatic potential is sampled in the neighborhood of the atoms involved in the vibrational mode. A number of these parametrization schemes have been employed for describing the amide-I mode,14 OH and OD stretch mode,12 nitriles,15 and lately have been extended to the symmetric and asymmetric stretch of carboxylate.16 Of great importance to the present work on TFA is the new electrostatic map developed for the acetic acid∕acetate vibrational transitions16 which as shown in the next sections will provide sufficient insights to correlate the frequency fluctuations to microscopic processes.
In this article, we present the results on vibrational dynamics of TFA and its isotopologue . Ultrafast pump-probe spectroscopy is used to obtain the vibrational population relaxation in the asymmetric stretch region of the carboxylate and vibrational photon echo spectroscopy to study solvation shell dynamics. All these experiments are used in conjunction with a frequency map and MD simulation to model the population and hydration dynamics of TFA.
MATERIALS AND METHODS
Sample preparation
Sodium trifluoroacetate (TFA-C12, CF3COONa, >99%) and its isotopologue (TFA-C13, , 99 atom % 13C) were obtained from Sigma Aldrich and deuterium oxide (D2O, 100.0 atom % D) from Acros Organics. All chemicals were used without further purification. The solutes were dissolved in D2O to obtain a concentration of 0.125M. Unless noted otherwise, all the samples were measured at room temperature (20 °C).
Linear IR spectroscopy
The FTIR absorption spectra were acquired with a Thermo Nicolet 6700 spectrometer having 0.5 cm−1 resolution in sample cells with CaF2 windows and a 6 μm path length.
Two dimensional IR spectroscopy
The 2D IR spectra were obtained using heterodyned spectral interferometry with an ultrafast laser system and processing techniques that have been described previously.17 In brief, Fourier transform limited pulses of 75 fs duration with either a 1625 or 1675 cm−1 central frequency are generated in a home made OPA and a difference frequency generator. The IR beam is split into three replicas (wave vectors: k1, k2, and k3), which are focused at the sample using the box configuration geometry. The interaction of the sample with these 400 nJ pulses produces photon echo signal in the −k1+k2+k3 phase matching direction, which is heterodyned with a local oscillator pulse (LO). All 2D spectra were acquired with pulses having parallel polarization. The signal and LO are dispersed by a monochromator (50 grooves∕mm) and the heterodyned signal is detected with a 64 element HgCdTe array detector. Two sequences of pulse were used in the experiment. One sequence has the pulse with the wavevector k1 arriving before that with wavevector k2 which gives the rephasing spectrum. The other sequence has k2 arriving before k1, and corresponds to the nonrephasing spectrum. The coherence time interval τ between k1 and k2 for both sequences was scanned with a 2 fs step. The time dependence of the signal with the population time T, the time interval between second and third pulses, was produced by scanning the third pulse k3 with 150 fs steps from 0 to 1.5 ps. The LO always preceded the signal by ∼1.0 ps.
To obtain the 2D spectrum, the echo signal is transformed into the frequency domain by a double Fourier transform on the third dimension t, the detection time, followed by Fourier transformation on τ. The detailed explanation of this analysis has been described elsewhere.17
Pump-probe spectroscopy
The ultrafast laser system used for this experiment has been previously described.4, 6 In summary, an ultrafast midinfrared pulse is obtained from a home made optical parametric amplifier pumped with a commercial femtosecond regenerative amplifier (Spitfire, Spectra Physics). This source delivers nearly transform limited pulses [∼75 fs duration, 250 cm−1 full width at half maximum (FWHM)] centered at ∼6 μm with energies of 2.4 μJ. The output is split into pump and probe pulses. The pump energy at the sample was ∼500 nJ and the probe was attenuated to an energy of less than 50 nJ. These pulses are focused with a parabolic mirror to a spot size of less than 200 μm in the sample. After the sample, the probe beam is recollimated, focused on the slit of a spectrometer, and spectrally resolved with a 100 grooves∕mm grating onto a 32 element HgCdTe array detector. The pump-probe pulse delay was adjusted with a computer controlled translation stage. To measure the population lifetimes, the probe polarization was set to 54.7° with respect to the pump. The transition dipole moment reorientation was obtained with the probe polarization set at 45° with respect to the pump before the sample, while a second polarizer selected either parallel or perpendicular polarization before the detector.
Theoretical methods
The MD simulations were performed using the NAMD 2.6 program package,18 with periodic boundary conditions and a 2 fs time step. The force field utilized was CHARMM27. The TFA force field was parametrized according to Schroder et al.19 The remaining simulation parameters were the same as those used in simulations of the acetate ion.16 The simulation was initiated using the geometry for TFA obtained from the 1ELC structure.20 The TFA ion was embedded in 20 Å box containing ∼300 waters. After a 1 ns energy minimization and a 5 ns equilibration using normal pressure and temperature ensemble at 298 K, a normal volume and temperature simulation was performed with snapshots recorded every 20 fs for 120 ps.
Density functional theory (DFT) calculations were performed at the B3LYP∕aug-cc-pVDZ level using the GAUSSIAN 03 software package.21
Theoretical frequency-frequency correlation function
We used a recently developed DFT map for the acetate ion to simulate the frequency fluctuations of the carboxylate asymmetric stretching mode of in water.16 A reasonable approximation of the frequency fluctuations for TFA is expected when using the DFT map designed for the acetate, as both ions only displace the three atoms of the carboxylate in the asymmetric stretch mode,22 and their Mulliken charges and intermolecular carboxylate oxygen to water oxygen distances in water clusters do not differ significantly.23
DFT maps link the solvent structural fluctuations to the molecular Hamiltonian. The link is expressed by parametrizing the Hamiltonian in terms of an applied electrostatic field (E(r)). This electric field is assumed to arise exclusively from the atomic charges of the solvent molecules surrounding the atoms involved in the vibrational mode. The frequency of the mode is computed as
| (1) |
where ω10 is the vibrational frequency in the gas phase (1717 cm−1), Ei is the electrostatic field or its first or second derivative, Cij are the electrostatic parameters obtained from the map, i is the direction of the field or the derivative, and j is the atom at which the parametrization is calculated. In the carboxylate case, i can be x, y, z, xx, xxx, etc. and j can be any of the atoms involved in the asymmetric stretch mode, i.e., C, O1, or O2.16 The net effect of the field terms in Eq. 1 is to reduce the frequency of the mode when the ion is solvated. A frequency redshift is also observed when the asymmetric stretch mode is computed for TFA that is hydrogen bonded to one water molecule, using the DFT method described earlier.
The frequency-frequency correlation function (FFCF) was simulated as the autocorrelation of the frequency fluctuation predicted by the electric field parametrization for each water structure of each snapshot of the MD simulation,
| (2) |
In Eq. 2, δωA(t1) and δωA(t2) are the solvent induced fluctuations in the frequency of the carboxylate asymmetric stretch at trajectory times t1 and t2, and the brackets indicate an average over the trajectory of the simulation with t=t1−t2.
In this study, the frequency fluctuation and its corresponding normalized autocorrelation function were calculated using the trajectory of the MD simulation.
EXPERIMENTAL RESULTS
Linear IR spectra
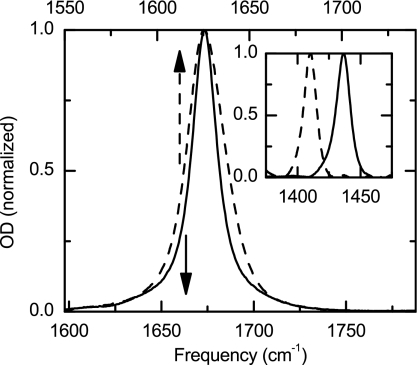
The infrared spectroscopy of the TFA has been studied previously by many groups.24, 25 It is well known that trifluoroacetatic acid is a strong acid with a pKa of 1.26 The FTIR spectrum of its TFA anion in pure D2O at frequencies higher than 1250 cm−1 shows only the carboxylate asymmetric and symmetric stretch transitions, which are located at 1673 and 1437 cm−1, respectively.25 The TFA-C13 also has two carboxylate stretching modes shifted to 1625 and 1410 cm−1. Figure 1 shows the asymmetric stretch transitions for both isotopologues with solvent D2O background and the naturally abundant 13C=16O signal subtracted for TFA-C12. The integrated absorption cross section was concentration independent below 0.5M. The TFA-C12 and TFA-C13 have different spectral shapes and widths, but we found that they have equal integrated absorption cross sections.
Figure 1.
Experimental linear IR spectra. TFA-C12 (solid line, lower scale) and TFA-C13 (dashed line, upper scale) in D2O. Inset shows the symmetric stretch band for both samples.
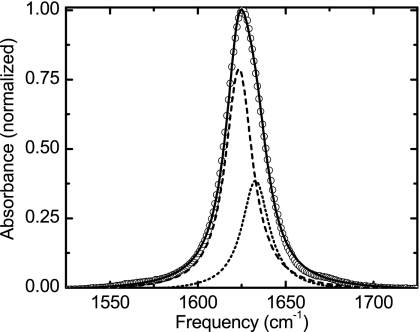
The TFA-C12 transition has a Lorentzian shape with a FWHM of 16.9 cm−1, while the TFA-C13 shows a slightly asymmetric Gaussian shape with a FWHM of 24.8 cm−1. The IR spectrum of TFA-C13 can also be fit by two Lorentzian peaks each with a FWHM of 18.8 cm−1, and center frequencies of 1623 and 1633 cm−1, and different cross sections (Fig. 2). The origin of this unusual band shape is addressed in the following sections.
Figure 2.
Experimental linear IR spectra of TFA-C13 (open circles) in D2O. The solid line is the fit with two Lorentzian functions (dashed and dotted lines).
Transient vibrational spectra
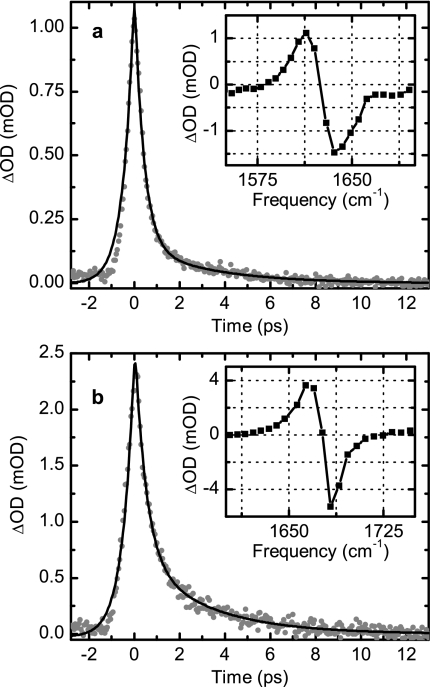
The spectral and temporal responses of TFA-C12 in D2O following the excitation with an intense pulse centered at 1675 cm−1 are presented in Fig. 3a. A bleach and a photoinduced absorption corresponding, respectively, to the v=0 to v=1 and the v=1 to v=2 transitions were observed [see inset, Fig. 3a]. The v=1 to v=2 transition is downshifted by 15.8 cm−1 from the v=0 to v=1 transition because of the oscillator anharmonicity. The temporal responses of the photoinduced absorption as well as the ground state bleach signals are not describable by single exponential processes, but they were adequately modeled by the sums of two exponentials. The perturbed free induction decay,27 which determines the signal rise, was modeled by an exponential. The signal rise and decay were convoluted with the instrument response function to obtain the characteristic times of the dynamics. The normalized amplitudes and time constants of the transient signals corresponding to the new absorption are summarized in Table 1. The bleaching and the new absorption signals have almost identical decays of the anisotropy within the signal to noise of our data. This orientational relaxation is well described by a single exponential function with a decay time constant of τα=4.3±0.5 ps. The large error reflects the very short population lifetime, which determines that the residual signal at ca. 4 ps is small and the noise in the difference between the parallel and perpendicular signals (not shown) is large.
Figure 3.
Pump-probe dynamics of TFA-C12 (a) and of TFA-C13 (b). Photoinduced transient signal (gray filled circles) and nonexponential fit (black line). The insets show the spectrally resolved signals at 0 fs delay between pump and probe.
Table 1.
Parameters of pump-probe dynamics fit for different temperatures and samples.
| Sample | Temp. (K) | Population dynamics | Anisotropy | |||||
|---|---|---|---|---|---|---|---|---|
| Rise | Decay | |||||||
| A1 | τ1 (ps) | A2 | τ2 (ps) | A3 | τ3 (ps) | τα (ps) | ||
| TFA-C12 | 281 | 1 | 0.47±0.02 | 0.75±0.06 | 0.58±0.07 | 0.25±0.06 | 2.8±0.5 | ⋯ |
| 293 | 1 | 0.47±0.02 | 0.74±0.04 | 0.54±0.06 | 0.26±0.04 | 3.2±0.4 | 4.3±0.5 | |
| 323 | 1 | 0.36±0.02 | 0.72±0.04 | 0.51±0.06 | 0.28±0.02 | 2.7±0.3 | ⋯ | |
| TFA-C13 | 293 | 1 | 0.36±0.02 | 0.89±0.02 | 0.44±0.02 | 0.11±0.02 | 3.6±0.5 | 4.3±0.5 |
The transient vibrational spectra of TFA-C13 were also obtained and analyzed [Fig. 3b]. The fitted parameters (summarized in Table 1) reveal nonexponential behavior and a fast rise time. Although the normalized exponential decay amplitudes and rise times of TFA-C13 are significantly different from TFA-C12, the anisotropy decay shows essentially identical dynamics for both isotopologues.
Transient vibrational spectra temperature dependence
Pump-probe spectra of TFA-C12 were measured at different temperatures: 281, 293, and 323 K. At all the temperatures the temporal responses of the photoinduced absorption as well as the ground state bleach decay signals were nonexponential. The new absorption signal was modeled by the sum of two exponentials. The results of the fits are presented in Table 1. Although the changes in the amplitudes and decay times are not large, the differences show that the dependence on temperature is not negligible. The trend is that the amplitude of the slower decay (τ3 in Table 1) increases and the amplitude of the fast decay (τ2) decreases with increasing temperature.
Two dimensional IR spectra
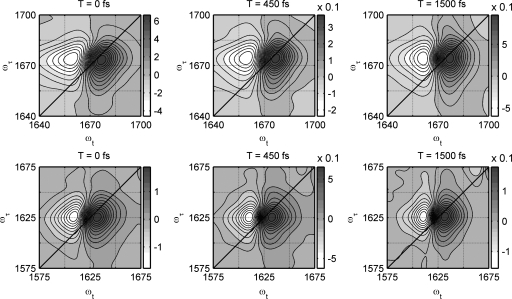
Figure 4 shows the 2D IR spectra of TFA-C12 at 293 K for different population times. Each of these spectra shows one pair of peaks. The positive peak corresponds to thev=0→v=1 transition of the carboxylate asymmetric stretch and is located close to the diagonal (ωt≈ωτ) line of the 2D IR spectrum. The negative peak corresponds to the v=1→v=2 transition, which is shifted along the detection frequency axis (ωt) by the anharmonicity. These two spectral components have a slight elongation along the diagonal. The v=1→v=2 region of TFA-C12 shows a noticeable tilt towards lower ωt frequencies at T=0 ps. The width of the positive and negative peaks along ωτ is approximately equal to 20 cm−1. These features in the 2D IR spectra are characteristic of systems where the spectrum is dominated by lorentzian processes.
Figure 4.
Experimental 2D IR vibrational echo spectra for population time T=0 fs, T=450 fs, and T=1500 fs. Upper and lower rows correspond to TFA-C12 and TFA-C13, respectively, in D2O.
The 2D IR spectra of TFA-C13 were also measured and they are displayed in Fig. 4. The positive and negative peaks have widths along the ωτ axis of ca. 50 cm−1, which are broader than in the case of TFA-C12. Moreover the negative peak is less extended along ωt and less triangular in shape compared with its counterpart in TFA-C12. Both TFA-C12 and TFA-C13 show a slight elongation or tilt of the two spectral components towards the diagonal at T=0 ps. For TFA-C13 a slight tilt remains noticeable at T=1.5 ps, at which time the TFA-C12 spectrum has become upright.
DISCUSSION
Population relaxation mechanism
Nonexponential relaxation has been previously observed in amide modes as well as carbonyl groups in carboxylic acids and esters.28 Many conjectures have been made regarding the microscopic interpretation of such behavior. One possible explanation is the rapid equilibration between different modes. In the present case the asymmetric stretching vibration may be equilibrating with another mode to which it is strongly coupled by the solvent displacements. For the intermode anharmonicity to be significant the two vibrational modes should share the movement of the same atoms. This is certainly the case for the two carboxylate stretching modes of TFA where the solvent movement can exert forces that could interconvert the asymmetric stretch mode into the symmetric stretch mode and vice versa.
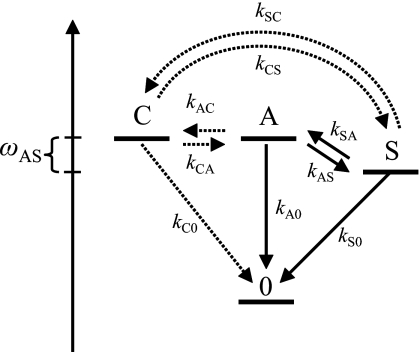
The IR spectrum of TFA-C12 in the region of the asymmetric stretch frequency has a single transition at 1673 cm−1 free from Fermi resonances. As discussed above there are only two transitions in the IR at frequencies higher than 1250 cm−1. Quantum computations show that the vibrational mode closest in energy to the carboxylate asymmetric stretch in TFA-C12(C13) is the symmetric stretch. The FTIR shows that these modes are separated by only 237 cm−1(215 cm−1). Therefore it is reasonable to hypothesize that the population relaxation of the asymmetric stretch (A) is dependent on, and perhaps governed by its solvent induced interaction with the symmetric stretch (S). The A⇄S energy flow would then lead to population equilibration between the two modes. It will be shown that the data are entirely consistent with this interpretation.
Assuming a kinetic scheme linking the S and A state populations with rate coefficients as defined in Fig. 5, the population nA(t) of the initially excited vibrational state A will show a biexponential decay given by
| (3) |
where c1=(kSA+kS0−α1)∕(α2−α1), c2=(kSA+kS0−α2)∕(α1−α2), α1=(p+q)∕2, α2=(p−q)2, p=kAS+kSA+kA0+kS0, and .
Figure 5.
Schematic kinetic diagram for two∕three coupled modes with an energy gap. The symmetric and asymmetric carboxylate stretches are denoted as S and A, respectively, and the combinational mode as C. Dotted arrows represent the pathways added to the three level system for the modeling of TFA-C13.
The rate coefficients kAS and kSA for population transfer between the symmetric and asymmetric states are related by
| (4) |
where ωAS is the frequency difference between the coupled modes. It will be seen below from global fits that the system is approximately in the limit: kAS≃kSA⪢kA0≃kS0. Therefore the amplitudes and decay rates become c1=kAS∕(kAS+kSA), α1=kAS+kSA, and c2=kSA∕(kAS+kSA), α2=kA0. Using Eq. 4 and the experimental ωAS, the predicted amplitudes for TFA-C12(C13) are c1=0.76(0.74) and c2=0.24(0.26) at 291 K. These values agree well with the experimental data fit to two exponentials as in Eq. 3 and shown in Table 1 for TFA-C12. The temperature dependence of TFA-C12 is also reasonably well predicted in this approximation: c1 decreases and c2 increases as the temperature increases. The situation for TFA-C13 is discussed in more detail below.
To extract the rate coefficients from the population decays of TFA-C12, we performed a global fit of the photoinduced absorption dynamics of the asymmetric stretch at different temperatures. In the fit with two exponentials and no constraints, the best least square fits required a frequency separation of 250±60 cm−1, which is close to the actual A-S separation of 237 cm−1. This result confirms that the relaxation pathway involves A, S coupling. To obtain the best set of kinetic parameters a global fit was performed with the A-S frequency separation set at the experimental value to generate the results presented in Table 2. The values of the parameters ci and αi from the global fit (Table 2) are in excellent agreement with those observed. These results show the kinetic model in Fig. 5 accurately describes the excited states dynamics of the asymmetric stretch of TFA-C12.
Table 2.
Parameters obtained from the global fitting of the TFA-C12 pump-probe kinetics at different temperatures. Parameters obtained from individual fits at different temperatures are shown in parenthesis.
| Parameters | Temperature (K) | ||
|---|---|---|---|
| 281 | 293 | 323 | |
| kAS (ps−1) | 1.35 | 1.35 | 1.35 |
| kSA (ps−1) | 0.40 | 0.42 | 0.47 |
| kA0 (ps−1) | 0.21 | 0.21 | 0.21 |
| kS0 (ps−1) | 0.41 | 0.41 | 0.41 |
| c1 | 0.73 (0.75) | 0.72 (0.74) | 0.70 (0.72) |
| α1 (ps) | 0.50 (0.58) | 0.49 (0.54) | 0.48 (0.51) |
| c2 | 0.27 (0.25) | 0.28 (0.26) | 0.30 (0.28) |
| α2 (ps) | 2.8 (2.8) | 2.8 (3.2) | 2.8 (2.7) |
The global fits of the experiments to the three state kinetic model predict that the symmetric stretching mode of C13 relaxes about five times faster than that of C12. This has the effect of reducing the c2 coefficient because the probability of the backreaction S→A becomes diminished. While this large difference between the C12 and C13 relaxations could conceivably have been caused by the isotope induced change in the coupling of the S mode of TFA-C13 to D2O and∕or to the bending mode of carboxylate, the actual situation is more complex. In particular, it is shown below that the vibrational band of C13 consists of two closely spaced transitions, probably a result of Fermi resonance. Therefore we considered the effect on the kinetic model of introducing a fourth state, labeled C, which is very near to A (see Fig. 5). In the fitting procedure, it was assumed that the kinetic constants: kA0, kS0, kSA, and kAS for the four-level scheme are equal to those observed for TFA-C12. The relaxation of A–C and the subsequent relaxation of C were introduced in accordance with the scheme shown in Fig. 5. The results of the fit are illustrated in Fig. 3. They are quite similar to those obtained by freely varying the rate parameters. The rate constant for these processes are kAC=2.85 ps, kCA=2.71 ps, kC0=2.18 ps, kCS=1.23 ps, and kSC=0.44 ps. The simulation of the signals shows that even with the presence of the new state C, the contribution of the A→S deactivation pathway to the relaxation of the A state is dominant. The kinetic parameters show that the quantum yield of S formation is 0.7 for TFA-C12 and 0.6 for TFA-C13 using the mixed state model indicated above. It will be demonstrated below that the C state is a combination mode in Fermi resonance with A.
A full quantitative description of the fast relaxation between the asymmetric and symmetric stretch modes would require computations of the autocorrelation function of the forces exerted on the ion by the surrounding water molecules in much the same way as recently reported for the azide ion.29 Although such a calculation is beyond the scope of the present study, it is possible to make some general qualitative comments regarding this process. The first point is that the small energy gap of 230 cm−1 is favorable for energy transfer between the carboxylate stretching modes. The spectra of the solvent forces exerted along the bonds of aqueous ions have been found to have substantial magnitudes relative to zero frequency at such energy gaps.29, 30 The carboxylate oxygens are equivalent, on average their solvation shells must be the same. Thus in the situation where each oxygen has a nearby collinear hydrogen, one can imagine a strong Coulomb force acting along each of the C–O bonds. It is the antisymmetric motions of these hydrogens, which push on one bond and pull on the other, that provide the fluctuating forces that mix the asymmetric and symmetric stretch motions of the ion through the Coulomb interaction. This push-pull effect will cause an anticorrelation in the frequency fluctuations for the A and S modes, which remains to be measured experimentally.
Frequency-frequency correlation function (FFCF)
An important feature contained in the 2D IR spectrum is the correlation function of the frequency fluctuations for the modes.31 Many different approaches have been used to extract this important information from the 2D IR spectra.10, 32, 33 Here, the normalized correlation function was obtained from the slope of the zero contour (nodal) line that separates the positive v=1→0 and negative v=1→2 transitions, measured at the point of intersection with the line joining the peaks. For one anharmonic oscillator having a spectrum distinct from that of other modes, the slope of this line at population time T, S(T), can be expressed as32
| (5) |
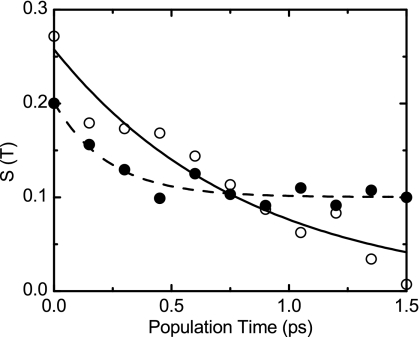
where ⟨δω10(T)δω10(0)⟩ is the FFCF at time T. This formulation assumes Gaussian frequency fluctuations. The slope versus population time for both isotopologues is presented in Fig. 6. The time evolution of these normalized FFCF’s suggests a model correlation function of the form
| (6) |
which contains an instantaneous decay with amplitude and an exponential decay to a plateau . The static inhomogeneous term is only needed to explain the TFA-C13 case as discussed below. Since the experimental FFCF generates only a normalized correlation function, the actual magnitudes of and Δi were found by least square fitting to the experimental linear IR line shapes as described below.
Figure 6.
Slope S(T) vs population time for TFA-C12 (open circles) and TFA-C13 (filled circles). The smooth lines are the corresponding fits to Eqs. 5, 6 using the parameters given in Table 3.
The experimental slope for TFA-C12 and TFA-C13 yields in both cases a normalized correlation functions starting below 0.3. This indicates that more than 70% of the FFCF corresponds to homogeneous processes. The FFCF of each isotopologue shows a subpicosecond exponential decay, 820 fs for TFA-C12 and 260 fs for TFA-C13. In addition, the normalized FFCF of TFA-C13 does not decay to zero at the longest times measured (see Fig. 6).
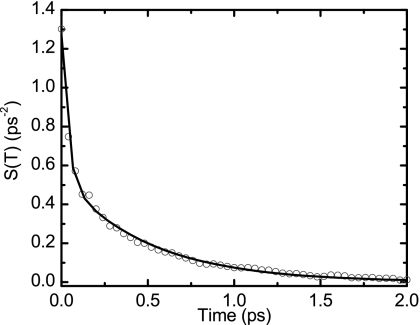
The FFCF obtained from MD simulations and the DFT frequency map (Fig. 7) was well fitted to a sum of two exponential decays. The model fit, summarized in Table 3, requires a component τ1=0.52 ps with normalized amplitude of 0.42. There is also a fast decay component of τH=0.04 ps with a normalized amplitude of 0.58, which will be shown to correspond to the component of Eq. 6. This theoretical model predicts features close to those seen in the normalized FFCF of TFA-C12 (Fig. 6), but differing significantly from the experimental normalized correlation function of TFA-C13.
Figure 7.
Autocorrelation of the frequency fluctuations calculated from the MD∕DFT map. Open circles are the FFCF and the solid line is the fit of the correlation function with two exponentials.
Table 3.
Parameters of the experimental and theoretically predicted FFCFs. The experimental parameters extracted from experimental results and from a simultaneous fit of the linear absorption spectra and of slope of the 2D IR spectrum nodal contour line (marked with *).
| FFCF parameters | Experimental | Theoretical | ||
|---|---|---|---|---|
| TFA-C12 | TFA-C13 | |||
| (norm) | 0.26±0.02 | 0.10±0.01 | 0.42±0.01 | |
| (ps−2) | 1.18* | ⋯ | 0.51±0.01 | |
| τ1 | (ps) | 0.82±0.09 | 0.26±0.06 | 0.52±0.01 |
| (norm) | ⋯ | 0.10±0.01 | ⋯ | |
| (norm) | ⋯ | ⋯ | 0.58±0.01 | |
| (ps−2) | ⋯ | 0.72±0.01 | ||
| τH | (ps) | ⋯ | ⋯ | 0.040±0.001 |
| (ps) | 17* | ⋯ | ⋯ | |
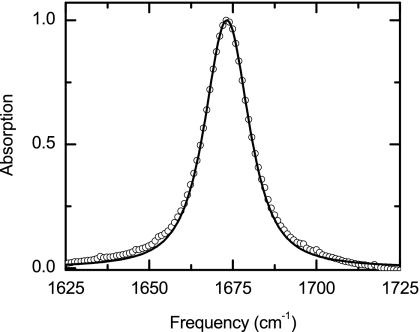
The linear absorption spectrum S(ω) of TFA-C12 was fitted to the well-known lineshape,34
| (7) |
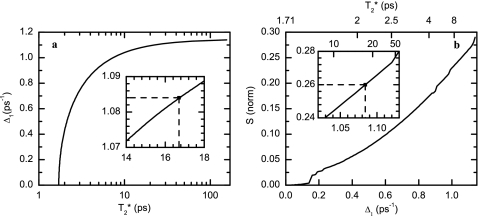
where , T10 is the depopulation time, and D is the rotational diffusion coefficient known from the pump-probe anisotropy (Table 1). The total depopulation rate was obtained from the proposed population kinetic modeling of three states (Table 2) giving a T10 of 0.64 ps. The linear IR band is close to being Lorentzian; and if there were only homogeneous processes contributing to the spectrum, the T1 and orientational relaxation would assume 53% (9 cm−1 out of 16.7 cm−1) of the linear spectral width. However, the asymmetric stretch transition clearly cannot be a Lorentzian function because there is a significant spectral diffusion. The experiment measures the spectral relaxation τ1 and the normalized variance, S(0), of the correlation function at T=0. To obtain all the parameters of Eq. 6, a simultaneous fitting of the linear and the 2D IR spectra was carried out in the following manner. Calculations of the linear spectrum using Eq. 5 find that there is a family of pairs of parameters and Δ1 that will provide the appropriate residual bandwidth for the given value of τ1, and give equally good fits to the linear spectrum [Fig. 8a]. Thus, within these constraints the specification of defines Δ1 and vice versa. The variation of Δ1 (or ) with S(0) is shown in Fig. 8b from computations of the 2D IR spectra based on the same pairs of parameters. The observed value of S(0) then specifies a particular pair of values and Δ1=1.09 ps−1 as indicated by the insets on Figs. 8a, 8b. The linear spectral fit is shown in Fig. 9.
Figure 8.
Relationship between pure dephasing parameters, and Δ1, and the T=0 value, S(0), of the normalized FFCF obtained from the slope as defined in the text. (a) shows the possible pairs of and Δ1 that fit the asymmetric stretch of the carboxylate for TFA-C12 for a given value of T10=0.64 ps as discussed in the text. (b) depicts the normalized FFCF intercept at T=0 for the different pairs of and Δ1 obtained in Fig. 8a. The upper x-axis of (b) displays the corresponding to the Δ1 displayed in the lower x axis. Insets in both Figures are zooms around the values for the parameters that fit the linear IR and the value of S(0) from the 2D IR spectrum of TFA-C12.
Figure 9.
Linear IR spectra of TFA-C12. The open circles are the experimental absorption line shape; the solid line is the fit to experimental parameters as discussed in the text relating to Eq. 7.
The spectral difference between TFA-C12 and -C13
There is a significant change in IR linewidth on isotopic substitution of the carboxylate carbon. This result is very unusual and unexpected. The explanation is that there must be two overlapping transitions in the case of TFA-C13. The spectrum of TFA-C12 in Fig. 1 illustrates clearly that there is no transition at or near the 1625 cm−1, the location of TFA-C13. Therefore the suspect new transition must be induced by isotope substitution. In other words, there must be a near accidental degeneracy between the asymmetric stretch of TFA-C13 and an overtone or combination mode. In the absence of the accidental degeneracy the combination mode is not present in the spectrum which is the case of TFA-C12 asymmetric stretch. However, its coupling to the asymmetric stretch mode must be weak because the energy gap between the eigenmodes is small and less than the spectral linewidth. DFT calculations of vibrational modes predict a combination mode consisting of the carboxylate symmetric stretch and a low frequency mode at 361 cm−1. This combination is computed to be within 10 cm−1 of the asymmetric stretch in TFA-C13, but 40 cm−1 from the same stretch in TFA-C12. The presence of a second transition is consistent with the linear IR spectrum of TFA-C13 being least square fitted to two Lorentzian peaks separated by 10 cm−1 (Fig. 2). The FTIR spectrum is found on careful inspection to be slightly asymmetric as shown in Fig. 1 when the spectrum is exactly aligned with that of TFA-C12. However, the presence of two transitions is most apparent from the 2D IR spectrum. The FFCF determined from the slope (Fig. 6) shows a decay to a plateau, which normally would be attributed to a static inhomogeneous component represented by the third term in Eq. 6. Nevertheless the effect of an inhomogeneous distribution of frequencies can be mimicked by the presence of two spectrally separated homogeneous distributions. The presence of accidental near-degeneracies and therefore their effects on the FFCF as described here may be common in polyatomic molecules and could be easily misinterpreted as slow solvent dynamics. The presence of the constant term in the FFCF of TFA-C13 and not in TFA-C12 is considered very unlikely to be caused by a difference in the interaction of the isotopologues with their water environments. The atomic charge distributions in the gas phase obtained from DFT computations are essentially identical for the two isotopologues. This result strongly argues against the solute-solvent interaction being dependent on isotope substitution and supports the interpretation that there are two overlapping transitions.
Solvation dynamics of TFA
The frequency fluctuation of the carboxylate asymmetric stretch mode is correlated to the changes in the electric field E at various points in the ion, exerted by the surrounding water molecules. The changes of E originate from the movement of the surrounding solvent D2O molecules. Therefore, the temporal evolution of the FFCF contains the characteristic time scales of the solvent dynamics.31 The experimental FFCF of TFA-C12 has one decay component of 0.82 ps that has a normalized amplitude of 0.26. The remaining 74% of the variance is assumed to be a fast motionally narrowed component. This fast decay corresponds to a homogeneous pure dephasing time of 17 ps as deduced from the FTIR spectrum. The FFCF computed from the MD simulation and frequency map also shows a strongly motionally narrowed component (see Table 3, theoretical values of ΔH and τH) with a correlation time of 40 fs. This fast process is considered to correspond to librations of the water in the solvation shell, which are known to occur on this time scale.35 The slow component of 0.82 ps in the experiment and 0.52 ps in the simulated correlation function arises from a dynamic inhomogeneous distribution of frequencies associated with the reorganization of the solvent shell as discussed below.
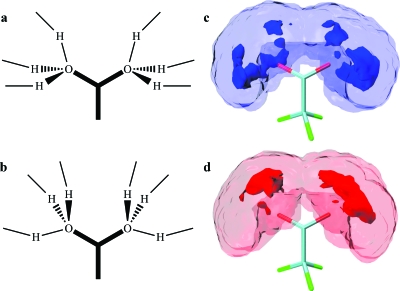
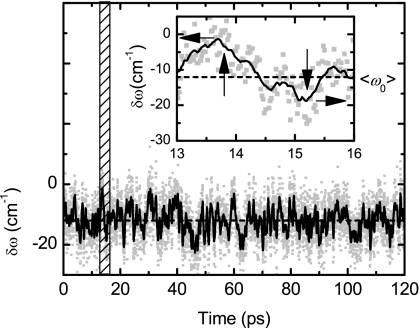
Analysis of the MD simulation shows that each of the oxygen atoms of the carboxylate is coordinated with an average of 2.8 water molecules (Fig. 10). When the simulation trajectory is smoothed to eliminate the fast fluctuations discussed in the previous paragraph, the vibrational frequencies computed from the simulation show continuous slow undulations about a mean frequency as shown on the inset of Fig. 11. The frequency variations of the smooth trajectory correlate on the slow time scale of 0.52 ps. The maxima and minima of the frequency deviations from the mean are readily shown by analysis of the simulation to correspond to two types of solvent configuration. The two idealized conformations of water around the ion are displayed in Figs. 10a, 10b. They can be described in terms of the directions of the lines connecting the carboxylate oxygen to the hydrogens of the closest water molecules. The lowest frequency configurations have one of these O–H directions being cis-planar with the C–C bond. The three O–H directions form an approximate tetrahedral arrangement with the carboxylate oxygen as one vertex as shown in Fig. 10. The high frequency conformations have one of the O–H directions trans-planar with the C–C bond. The actual snapshots show solvated structures that fluctuate significantly from these idealized forms and also undergo fluctuations in the hydrogen occupation of the various sites. Nevertheless the simulation indicates that these idealized forms are descriptive of the high and low frequency solvent conformations. It also predicts that both oxygen atoms have the same water conformation so that the low frequencies in the simulated trajectory are associated with both oxygen atoms having one O–H direction that is cis-planar with the C–C bond.
Figure 10.
Solvation shell configurations of TFA with the highest frequency deviations. Idealized solvent conformations for the maximum (a) and minimum (b) frequencies marked with arrows in the inset of Fig. 11. Hydrogen occupancy probability for all the solvent conformations in which the carboxylate asymmetric stretch frequency is calculated to be within 25% of the maximum (c) and 25% of the minimum (d). The transparent and solid isosurfaces of (c) and (d) represent the 66% and 99% probability of finding a hydrogen atom, respectively.
Figure 11.
Simulated frequency fluctuation of the asymmetric stretch mode. Inset shows a zoom of the marked area. Grey dots and solid black lines represent the frequency fluctuation and its window average, respectively. Dash black line is the average of the frequency fluctuation ⟨ω0⟩ with respect to the gas phase value at 0 cm−1.
To confirm whether the switching between the two described solvent configurations is the slow process observed in the FFCF, the correlation between the position of the water molecules hydrogen bonded to carboxylate and the frequency fluctuation was investigated in the snapshots of the MD simulation. The analysis shows that the frequencies correlate highly with the solvent structure parameters. For example when a H bond is defined by an O–H distance less than 3 Å and an O–H direction within 30° of the O(carboxylate)–O(water) separation,36 the cross correlation of the calculated vibrational frequency and the component along the C–C bond of the sum of the O–H unit vectors for H atoms hydrogen bonded to both oxygens gives a correlation factor of 0.76. The correlations with components in the directions perpendicular to the C–C bond are negligible. Thus, the interconversion between the low and high frequencies corresponds to the slow process in the theoretically predicted FFCF shown in Fig. 7. The result also indicates that the change in the geometrical distributions of waters surrounding the ion is indeed the inhomogeneous∕slow process observed in the experimental FFCF. The frequency fluctuates at higher values of the mean frequency ⟨ω0⟩ if the water shell is in the configurations a and c of Fig. 10. Another property that supports the switching of the water shell configurations as the mechanism observed in the FFCF is the density of the hydrogen occupancy. The density of the hydrogen occupancy was calculated for all those configurations within 25% of the maximum and minimum frequency fluctuations and it is illustrated in Fig. 10. The results show the isosurface containing the 66% probability of finding the hydrogen in the configurations of Figs. 10a, 10c, when the oscillator has the highest frequency. The tendency is reversed for water clusters that produce the negative deviation from the center frequency ⟨ω0⟩, which correspond to those in Figs. 10b, 10d.
The experimental FFCF slow decay starts at a small normalized amplitude, which implies that the distribution of frequencies and hence of solvent configurations is relatively narrow; in other words, the persistent inhomogeneous distribution of frequencies is small. This is consistent with the water coordination number, which shows the ion strongly associating with the surrounding water molecules.
The MD simulation predicts reasonably well the FFCF. It requires that water molecules reside37 in the first solvation shell for ca. 10 ps, which must significantly slow down the motions of the water surrounding the carboxylate ion. The influence of more hydrophobic –CF3 group on these water structure and their dynamics could be further evaluated by comparison with other ions such as acetate ().
CONCLUSION
The asymmetric stretching vibration of the carboxylate of the anion was found to have a population relaxation dominated by transitions to the symmetric stretching mode. The backtransfer to the asymmetric stretch was observed in accordance with microscopic reversibility. The model of the temperature dependent T1 relaxation, leading to nonexponential population dynamics is likely to be applicable to other systems.
A coupling of the asymmetric stretching vibration with a combination mode causes the bandwidth of TFA-C13 to be significantly increased over that of TFA-C12. The presence of two very close and overlapping transitions is manifested in the experimental FFCF. It is shown that an unresolved Fermi resonance can produce the same FFCF as a static inhomogeneous broadening, even in cases where both vibrational transitions are homogeneously broadened.
We suggested a structural interpretation of the components of the FFCF. The fast component is due to the librations of the water molecules surrounding the ion. The slow component is attributed to the switching between mainly two configurations of water molecules around the ion.
ACKNOWLEDGMENTS
This research was supported by grants to RMH from NSF-CHE and NIH-GM12592 with instrumentation supported by NIH-RR001348.
References
- Hamm P., Lim M., and Hochstrasser R. M., J. Chem. Phys. 107, 10523 (1997). 10.1063/1.474216 [DOI] [Google Scholar]
- Owrutsky J. C., Raftery D., and Hochstrasser R. M., Annu. Rev. Phys. Chem. 45, 519 (1994). [DOI] [PubMed] [Google Scholar]
- Rezus Y. L. A. and Bakker H. J., Phys. Rev. Lett. 99, 148301 (2007). 10.1103/PhysRevLett.99.148301 [DOI] [PubMed] [Google Scholar]
- Vorobyev D. Y., Kuo C. H., Chen J. X., Kuroda D. G., Scott J. N., Vanderkooi J. M., and Hochstrasser R. M., J. Phys. Chem. B 113, 15382 (2009). 10.1021/jp9069256 [DOI] [PMC free article] [PubMed] [Google Scholar]
- Kuo C. H. and Hochstrasser R. M., Chem. Phys. 341, 21 (2007). 10.1016/j.chemphys.2007.03.031 [DOI] [Google Scholar]
- Kuo C. H., Vorobyev D. Y., Chen J. X., and Hochstrasser R. M., J. Phys. Chem. B 111, 14028 (2007). 10.1021/jp076503+ [DOI] [PubMed] [Google Scholar]
- Frank H. S. and Evans M. W., J. Chem. Phys. 13, 507 (1945). 10.1063/1.1723985 [DOI] [Google Scholar]
- Haselmeier R., Holz M., Marbach W., and Weingartner H., J. Phys. Chem. 99, 2243 (1995) 10.1021/j100008a001 [DOI] [Google Scholar]; Ishihara Y., Okouchi S., and Uedaira H., J. Chem. Soc., Faraday Trans. 93, 3337 (1997) 10.1039/a701969f [DOI] [Google Scholar]; Okouchi S., Moto T., Ishihara Y., Numajiri H., and Uedaira H., J. Chem. Soc., Faraday Trans. 92, 1853 (1996) 10.1039/ft9969201853 [DOI] [Google Scholar]; Shimizu A., Fumino K., Yukiyasu K., and Taniguchi Y., J. Mol. Liq. 85, 269 (2000). 10.1016/S0167-7322(00)00106-9 [DOI] [Google Scholar]
- Laage D., Stirnemann G., and Hynes J. T., J. Phys. Chem. B 113, 2428 (2009) 10.1021/jp809521t [DOI] [PubMed] [Google Scholar]; Rossky P. J. and Karplus M., J. Am. Chem. Soc. 101, 1913 (1979) 10.1021/ja00502a001 [DOI] [Google Scholar]; Zichi D. A. and Rossky P. J., J. Chem. Phys. 84, 2814 (1986). 10.1063/1.450307 [DOI] [Google Scholar]
- Kwak K., Park S., Finkelstein I. J., and Fayer M. D., J. Chem. Phys. 127, 124503 (2007). 10.1063/1.2772269 [DOI] [PubMed] [Google Scholar]
- Lazonder K., Pshenichnikov M. S., and Wiersma D. A., Opt. Lett. 31, 3354 (2006). 10.1364/OL.31.003354 [DOI] [PubMed] [Google Scholar]
- Auer B. M. and Skinner J. L., J. Chem. Phys. 128, 224511 (2008) 10.1063/1.2925258 [DOI] [PubMed] [Google Scholar]; Paarmann A., Hayashi T., Mukamel S., and Miller R. J. D., J. Chem. Phys. 128, 191103 (2008). 10.1063/1.2919050 [DOI] [PMC free article] [PubMed] [Google Scholar]
- Bouř P. and Keiderling T. A., J. Chem. Phys. 119, 11253 (2003) 10.1063/1.1622384 [DOI] [Google Scholar]; Ham S., Kim J. H., Lee H., and Cho M. H., J. Chem. Phys. 118, 3491 (2003) 10.1063/1.1536980 [DOI] [Google Scholar]; Schmidt J. R., Corcelli S. A., and Skinner J. L., J. Chem. Phys. 121, 8887 (2004). 10.1063/1.1791632 [DOI] [PubMed] [Google Scholar]
- Hayashi T., Zhuang W., and Mukamel S., J. Phys. Chem. A 109, 9747 (2005). 10.1021/jp052324l [DOI] [PubMed] [Google Scholar]
- Choi J. H., Oh K. I., Lee H., Lee C., and Cho M., J. Chem. Phys. 128, 134506 (2008). 10.1063/1.2844787 [DOI] [PubMed] [Google Scholar]
- Bagchi S., Falvo C., Mukamel S., and Hochstrasser R. M., J. Phys. Chem. B 113, 11260 (2009). 10.1021/jp900245s [DOI] [PMC free article] [PubMed] [Google Scholar]
- Kim Y. S., Wang J. P., and Hochstrasser R. M., J. Phys. Chem. B 109, 7511 (2005). 10.1021/jp044989d [DOI] [PubMed] [Google Scholar]
- Phillips J. C., Braun R., Wang W., Gumbart J., Tajkhorshid E., Villa E., Chipot C., Skeel R. D., Kale L., and Schulten K., J. Comput. Chem. 26, 1781 (2005). 10.1002/jcc.20289 [DOI] [PMC free article] [PubMed] [Google Scholar]
- Schroder C., Rudas T., Neumayr G., Gansterer W., and Steinhauser O., J. Chem. Phys. 127, 044505 (2007). 10.1063/1.2754690 [DOI] [PubMed] [Google Scholar]
- Mattos C., Rasmussen B., Ding X. C., Petsko G. A., and Ringe D., Nat. Struct. Biol. 1, 55 (1994). 10.1038/nsb0194-55 [DOI] [PubMed] [Google Scholar]
- Frisch M. J., Trucks G. W., Schlegel H. B.et al. , Gaussian, Inc., Pittsburgh, PA, 2003.
- Nara M., Torii H., and Tasumi M., J. Phys. Chem. 100, 19812 (1996). 10.1021/jp9615924 [DOI] [Google Scholar]
- Gojlo E., Smiechowski M., Panuszko A., and Stangret J., J. Phys. Chem. B 113, 8128 (2009). 10.1021/jp811346x [DOI] [PubMed] [Google Scholar]
- Bergström P. A. and Lindgren J., J. Mol. Struct. 245, 221 (1991) 10.1016/0022-2860(91)87099-4 [DOI] [Google Scholar]; Kristiansson O., Lindgren J., and Devillepin J., J. Phys. Chem. 92, 2680 (1988) 10.1021/j100320a055 [DOI] [Google Scholar]; Shipman S. T., Douglass P. C., Yoo H. S., Hinkle C. E., Mierzejewski E. L., and Pate B. H., Phys. Chem. Chem. Phys. 9, 4572 (2007) 10.1039/b704900e [DOI] [PubMed] [Google Scholar]; Stangret J. and Gampe T., J. Phys. Chem. A 106, 5393 (2002). 10.1021/jp014063v [DOI] [Google Scholar]
- Christe K. O. and Naumann D., Spectrochim. Acta, Part A 29, 2017 (1973). 10.1016/0584-8539(73)80060-1 [DOI] [Google Scholar]
- Weast R. C., CRC Handbook of Chemistry and Physics, 1st Student ed. (CRC, Boca Raton, FL, 1988). [Google Scholar]
- Wynne K. and Hochstrasser R. M., Chem. Phys. 193, 211 (1995). 10.1016/0301-0104(95)00012-D [DOI] [Google Scholar]
- Lim M. and Hochstrasser R. M., J. Chem. Phys. 115, 7629 (2001) 10.1063/1.1404144 [DOI] [Google Scholar]; Hamm P., Lim M. H., and Hochstrasser R. M., J. Phys. Chem. B 102, 6123 (1998). 10.1021/jp9813286 [DOI] [Google Scholar]
- Li S. Z., Schmidt J. R., and Skinner J. L., J. Chem. Phys. 125, 244507 (2006). 10.1063/1.2408421 [DOI] [PubMed] [Google Scholar]
- Rey R. and Hynes J. T., J. Chem. Phys. 108, 142 (1998). 10.1063/1.475389 [DOI] [Google Scholar]
- Hamm P., Lim M., and Hochstrasser R. M., Phys. Rev. Lett. 81, 5326 (1998). 10.1103/PhysRevLett.81.5326 [DOI] [Google Scholar]
- Kwak K. and Cho M. H., J. Chem. Phys. 119, 2256 (2003). 10.1063/1.1580808 [DOI] [Google Scholar]
- Kwak K., Rosenfeld D. E., and Fayer M. D., J. Chem. Phys. 128, 204505 (2008). 10.1063/1.2927906 [DOI] [PubMed] [Google Scholar]
- Hamm P. and Hochstrasser R. M., in Ultrafast Infrared and Raman Spectroscopy, edited by Fayer M. D. (Dekker, New York, 2001), p. 273. [Google Scholar]
- Loparo J. J., Fecko C. J., Eaves J. D., Roberts S. T., and Tokmakoff A., Phys. Rev. B 70, 180201 (2004). 10.1103/PhysRevB.70.180201 [DOI] [Google Scholar]
- Kumar R., Schmidt J. R., and Skinner J. L., J. Chem. Phys. 126, 204107 (2007). 10.1063/1.2742385 [DOI] [PubMed] [Google Scholar]
- Koneshan S., Rasaiah J. C., Lynden-Bell R. M., and Lee S. H., J. Phys. Chem. B 102, 4193 (1998). 10.1021/jp980642x [DOI] [Google Scholar]


