

Abstract
In many species, interval timing behavior is accurate—appropriate estimated durations—and scalar—errors vary linearly with estimated durations. While accuracy has been previously examined, scalar timing has not been yet clearly demonstrated in house mice (Mus musculus), raising concerns about mouse models of human disease. We estimated timing accuracy and precision in C57BL/6 mice, the most used background strain for genetic models of human disease, in a peak-interval procedure with multiple intervals. Both when timing two intervals (Experiment 1) or three intervals (Experiment 2), C57BL/6 mice demonstrated varying degrees of timing accuracy. Importantly, both at individual and group level, their precision varied linearly with the subjective estimated duration. Further evidence for scalar timing was obtained using an intraclass correlation statistic. This is the first report of consistent, reliable scalar timing in a sizable sample of house mice, thus validating the PI procedure as a valuable technique, the intraclass correlation statistic as a powerful test of the scalar property, and the C57BL/6 strain as a suitable background for behavioral investigations of genetically engineered mice modeling disorders of interval timing.
Keywords: C57BL/6, interval timing, intraclass correlation, scalar property, peak-interval procedure
Time is an essential dimension of the world, determining the decisions we make, the actions we take, and the very precision of our slightest movements (Gallistel, 1990). Organisms have developed a variety of methods to handle the constraints of time (Buhusi & Meck, 2005). For example, interval timing, or timing in the seconds-to-minutes range, is crucial for decision-making (Gallistel, 1990) and foraging (Henderson, Hurly, Bateson, & Healy, 2006). Accurate timing, i.e., responding at the appropriate time, has been demonstrated in a wide variety of animals, from invertebrates such as bees (Boisvert & Sherry, 2006), to many vertebrates, such as fish (Talton, Higa, & Staddon, 1999), birds (Cheng & Westwood, 1993), and mammals such as rats (Dews, 1962), woodmice (Lejeune & Wearden, 1991) and humans (Rakitin et al., 1998). In most of these species, the error (more precisely, the standard deviation) of time estimation varies linearly with the estimated interval. This scalar property is thought to reflect the Weber’s Law as applied to interval timing (Gibbon, 1977; Gibbon, Church, & Meck, 1984).
Deficits in accuracy of timing, and departures from scalar timing, have been reported in a variety of diseases, including Parkinson’s Disease (Malapani et al., 1998), Huntington’s Disease (Paulsen et al., 2004), Schizophrenia (Penney, Meck, Roberts, Gibbon, & Erlenmeyer-Kimling, 2005), Attention Deficit Hyperactivity Disorder (Barkley, Murphy, & Bush, 2001; Radonovich & Mostofsky, 2004), and Alzheimer’s disease (Nichelli, Venneri, Molinari, Tavani, & Grafman, 1993). To elucidate the genetic and molecular mechanisms involved in disorders involving disruptions of interval timing, studies have been carried out in animal models, such as house mice (Mus musculus), including genetically modified mice. The results relative to accuracy and precision of interval timing are mixed. Most of the studies investigated the accuracy and the precision of timing at only one duration, bur are silent about scalar timing in house mice (Abner, Edwards, Douglas, & Brunner, 2001; Balci et al., 2009; Balci, Ludvig et al., 2008; Balci, Papachristos et al., 2008; Carvalho, Silva, & Balleine, 2001; Drew et al., 2007; Meck, 2001).
To our knowledge, only three studies addressed scalar timing in house mice (Mus musculus), and, taken together, these studies do not offer compelling evidence in favor of scalar property in mice, possibly due to the behavioral and statistical method used (see below), inconsistency of results, and the very small sample size. For example, in the King, Gallistel & McDonald (2001) study, only one of the two Swiss-Webster mice clearly displayed the scalar property (Figure 1, panel A.) A replication of this study (Gallistel, King, & McDonald, 2004) provided more unconvincing evidence for scalar timing (Figure 1, Panel B): All six Swiss-Webster mice investigated were more precise (smaller relative error) at the long duration then at the short durations, thus departing from the scalar property as shown in humans (Rakitin et al., 1998) and rats (Church, Meck, & Gibbon, 1994). Finally, in a study of switching behavior in C57BL/6 mice, Balci et al. (2008, Exp. 2) found that half of the of the four mice investigated did not display behavior consistent with scalar timing. These mixed results (less than half of the subjects behave consistently with the scalar property), obtained in very small sample of mice (eight Swiss Webster mice and four C57BL/6 mice) call into question the scalar property, or the conditions under which this property, is displayed by house mice.
Figure 1. Analyses of Individual response functions in two previous studies indicate inconclusive results relative to the scalar property in house mice.
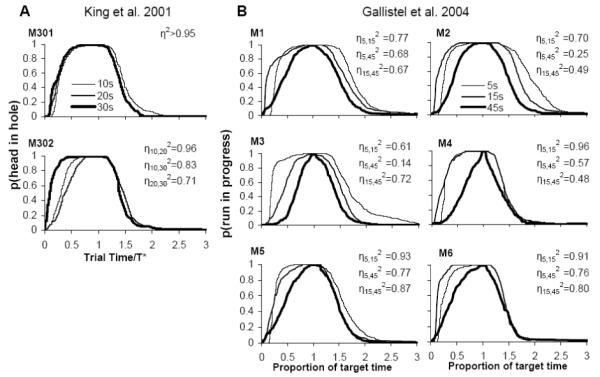
In a manner comparable with our study, for each subject we estimated the η2 index of superposition. A. King et al. (2001) tested only two mice, of which only one shows η2 larger than 0.8. B. Gallistel et al. tested 6 mice, of which only 2 approach η2 larger than 0.8 for all three durations, with the other four mice showing η2 lower than 0.5. Together, only 3 out of 8 mice show high superposition indices for the tested durations.
Notably, the Gallistel et al. (2004) study used an established behavioral procedure—the peak-interval (PI) procedure (Catania, 1970)—extensively used in both humans, rodents and birds to evaluate the effect of behavioral (Balci et al., 2009; Buhusi & Meck, 2000, 2009; Buhusi, Paskalis, & Cerutti, 2006), pharmacological (Balci, Ludvig et al., 2008; Buhusi & Meck, 2002, 2007; Matell, Bateson, & Meck, 2006; Matell, King, & Meck, 2004) and neurophysiological manipulations (Buhusi, Lamoureux, & Meck, 2008; Matell, Meck, & Nicolelis, 2003) on interval timing. In the PI procedure, subjects are randomly presented with reinforced fixed-interval trials, and non-reinforced peak-interval trials. In a fixed-interval trial, a to-be-timed signal is turned on and subjects are reinforced for the first response after a given criterion interval, say 5s. In PI trials, the to-be-timed signal is presented for three times its associated criterion duration, say 15s, but responding is not reinforced. In trained subjects, the rate of the response in PI trials gradually increases, reaches a peak about the appropriate duration, and then gradually declines for the duration of the PI trial. The time at which the response rate peaks in PI trials, peak time, is taken as an estimate of the accuracy of timing, the width of the response function in PI trials is taken as an estimate of the precision of timing, and their linear relationship is taken as evidence for the scalar property. The later is indexed by examining a coefficient of variation, CV, the ratio between estimation error and estimation accuracy, shown to be relatively constant in a large range of timed durations in many species (reviewed by Buhusi & Meck, 2005). Finally, a more global measure of timing multiple durations in the PI procedure can be obtained by re-scaling the response functions both in amplitude (response peak rate) and time (proportional to estimated accuracy), and evaluating the degree by which these normalized response functions superimpose at multiple durations, by computing a superposition index, η2 (Roberts & Church, 1978), an index previously used in the timing literature to measure the degree of overlap between two normalized functions corresponding to two to-be-timed criteria (Brown, Hemmes, & Cabeza de Vaca, 1992; Brown, Richer, & Doyere, 2007). The better two functions superimpose the more η2 approaches 1, although an η2 larger than 0.8 is taken as acceptable superposition (Brown et al., 2007). Relative to the CV, which uses only the peak time and the width of the response function, the superposition index η2 has the advantage of evaluating the scalar property irrespective of the shape of the response function.
When evaluating superposition of response functions in previous studies using the η2 index, we found that indeed only one of the two subjects in the King et al. (2001) study, only two of the six subjects in the Gallistel et al. (2004) study, and only two of the four subjects in the Balci et al. (2008) study—in all about 40% of subjects—exceed the liberal criterion η2 > 0.8, and that this percentage decreases to less 10% at a more conservative threshold η2 > 0.85 (see Table 1). In summary, using an objective measure of scalar property, the pattern of responses in the King et al. (2001), Gallistel et al. (2004), and Balci et al. (2008) studies does not offer compelling evidence in favor of the scalar property, due both to the inconsistency of results and to the small sample size.
Table 1. Comparison of present results with prior studies relative to scalar property.
PI: Peak-interval procedure. The PI procedure, but not the switching procedure, allows for the independent evaluation of the estimated duration. The number of subjects showing scalar property was estimated using the superposition index η2 at two (liberal and conservative) levels.
| Study | Procedure (mice tested) |
Evaluate durations |
Number (%) mice with η2 > 0.8 |
Number (%) mice with η2 > 0.85 |
|---|---|---|---|---|
| King et al. 2001 | PI (n=2) | yes | 1 (50%) | 1 (50%) |
| Gallistel et al. 2004 | PI (n=6) | yes | 2 (33%) | 0 (0%) |
|
Balci et al. 2008 (Exp.2) |
Switching (n=4) |
no | 2 (50%) | 0 (0%) |
| Present study (Exp 1 and 2) |
PI (n=17) |
yes | 17 (100%) | 15 (88%) |
We hypothesized that the inconsistent findings in the King et al. (2001) and Gallistel et al. (2004) studies may be due to the relatively small sample of subjects investigated, to the difficulty of the task, i.e., timing three durations, or possibly, to the mouse strain used, Swiss Webster, an outbred strain with relatively poor performance in behavioral tasks (Blanchard, Parmigiani, Agullana, Weiss, & Blanchard, 2006; Bondar & Kudryavtseva, 2005; Ralph & Caine, 2005; Wilkerson & Levin, 1999; Wright, Alt, Turnera, & Kruegerb, 2004). Therefore, in our studies we investigated interval timing in C57BL/6 mice, an inbred mouse strain known to have good learning abilities in associative studies (Crawley et al., 1997), when timing either two or three durations. Seventeen C57BL/6 mice were trained in a modified PI procedure with two (Experiment 1, nine mice) or three (Experiment 2, eight mice) to-be-timed criterion intervals. In both experiments, independent response functions were collected for each to-be-timed criterion interval. Response functions were used to estimate timing accuracy (peak time), timing precision (width of response function), and a coefficient of variation CV at each to-be-timed criterion interval. Indeed, when timing two durations (10-s and 30-s, Experiment 1), C57BL/6 mice’s response functions seemed to superimpose quite well, both as a group and for each individual, thus apparently demonstrating scalar timing. However, we expected that when timing three durations (Experiment 2) mice will fail to display the scalar property. Instead, mice showed accurate timing of the short duration (10-s) and mildly underestimated the longer intervals, 20- and 40-s, but continued to display the scalar property, as shown by superposition of response functions and as indexed by the CV.
Given the apparent divergence from the previous findings discussed above, we further quantified the degree of superposition of the response functions in our experiments using two more measures. First, we computed a superposition index, η2 (Brown et al., 1992; Brown et al., 2007; Roberts & Church, 1978), which has the advantage of evaluating the entire response function irrespective of its shape. However, the sampling distribution of the mean is largely unknown for η2, such that this statistic should be used cautiously for hypothesis testing. In other words, η2 does not have an associated level of confidence in the superposition of the response functions. Therefore, we also used an alternative statistical test of superposition based on an intra-class correlation coefficient, ICC, which can be used directly in hypothesis testing irrespective of the shape of the response function (Landis & Koch, 1977). In both our experiments, the η2 statistic indicated very good superposition of response functions, both at the individual level and as a group. Moreover, in both experiments the ICC statistic indicated that normalized response functions superimpose with a high degree of confidence. Therefore, our findings indicate reliably the consistent scalar timing behavior of a sizable sample of house mice (Mus musculus), validating the PI procedure as a valuable behavioral technique, the intraclass correlation statistics as a statistical test of the scalar property, and the C57BL/6 strain as a suitable background for behavioral investigations of genetically engineered mice modeling disorders of interval timing.
Experiment 1
We evaluated the accuracy and precision of interval timing in C57BL/6 mice in a PI procedure with two intervals, 10 s and 30 s. Mice received separate, randomly intermixed, 10-s fixed interval (FI) trials, 30-s FI trials, and separate PI trials for the two durations. The response functions in the 10-s PI and 30-s PI trials were used for estimating timing accuracy and scalar timing. We hypothesized that using only two intervals will facilitate the display of the scalar property in mice.
Methods
Subjects
The subjects were 9 naïve male C57BL/6 mice (Mus musculus; Charles River Labs, Raleigh, NC), approximately 6 months of age at the beginning of the experiment. The mice were housed in groups of three in a temperature-controlled room, under a 12/12-hr light-dark cycle. The mice were tested during the light period of the cycle. Water was given ad lib in the home cages. The mice were maintained at 85% of their ad lib weight by restricting their access to food (Rodent Diet 5001, PMI Nutrition International, Brentwood, MO). All manipulations were performed in compliance with APA ethical standards in the treatment of animals.
Apparatus
The apparatus consisted of 9 standard mouse operant boxes housed in sound-attenuating cubicles (MED Associates, St. Albans, VT). Each box was equipped with two nose-pokes situated on the front wall. For each subject a criterion duration, 10 s or 30 s, was randomly assigned to each nose-poke, counterbalanced by location. The lights inside the nose-pokes were used to signal the to-be-timed durations. According to the schedule, 20-mg Noyes precision food pellets (Research Diets, Inc., New Brunswick, NJ) were delivered in a food cup situated on the front wall, inbetween the nose-pokes, by a pellet dispenser. A 66-dB sound produced by a fan was present throughout all procedures. The intensity of the fan was measured with a sound level meter (Realistic Radio Shack, Model 33-2050) from the center of the (silent) box.
Fixed Interval (FI) Sessions (1-7)
FI trials with each of the two criterion durations, corresponding to the two nose pokes, were randomly intermixed. At the onset of each FI trial, the light inside the appropriate nose-poke was turned on. A nose poke response at or after the criterion time was reinforced with one food pellet irrespective of responding on the other nose-poke, and turned off the light for the duration of the inter-trial interval (ITI). The ITI lasted for three times the criterion duration plus a variable 2-16 s duration. Subjects received on average 48 FI trials for each timed criterion per session.
Peak Interval (PI) Sessions (8-32)
FI trials were randomly interspersed with non-reinforced 10-s and 30-s PI trials. During each PI trial, the light in the corresponding nose-poke was turned on for three times the corresponding criterion duration, and then turned off irrespective of any responses for the duration of the ITI. During each session subjects received on average 24 FI trials and 12 PI trials for each timed criterion.
Data Analysis
The experimental procedures were controlled through a MED Associates interface (MED-Associates, 1999). The start time, end time, and duration of each nose-poke response were recorded in real time. A time-in-nose-poke (TIN) was computed as the average proportion of each time unit the mouse performed a nose-poke response, i.e., when the mouse’s nose was inside the nose-poke. TIN was analyzed for each subject in absolute in relative time units as follows.
The individual distribution of TIN (in 1-s time units) was fit (least squares minimization) using the Marquardt-Levenberg iterative algorithm (Marquardt, 1963) implemented in SigmaPlot (Systat Software, 2004), to the following Gaussian+linear equation
| (Equation 1) |
(see Buhusi & Meck, 2000). The algorithm provided parameters μ, rate, σ, and tail, estimating respectively the accuracy of timing (peak time of TIN function), maximum TIN (amplitude of TIN function), precision of interval timing (width of TIN function), and the skewness of the TIN function (right-tail of TIN function). An estimate of the coefficient of variation was also computed as CV = σ / μ. These parameters were submitted to statistical analyses. Because analyses failed to reveal a significant effect of session, data from the last 12 PI sessions (approximately 150 PI trials at each duration) were collapsed over sessions and re-fit as described above.
The degree to which the subjects use scalar timing was estimated by three measures: CV, η2, and ICC, as follows. First, an estimate of the coefficient of variation was computed as CV = σ / μ. Second, to reliably estimate whether mice scale their timing relative to objectve criterion durations set by experimenter, or rather to their subjective criterion durations learned by each individual, the TIN functions were normalized in amplitude (% maximum TIN) and re-sampled in the interval 0-300% criterion either in (a) 10% criterion time bins: 1-s bins for the 10-s criterion, and 3-s bins for the 30-s criterion, or in (b) 10% subjective time units, by re-sampling the functions in 10 % μ individually-tailored bins. Under each condition, this normalization process resulted in a 31-bin multivariate outcome vector which was used to estimate an intra-class correlation coefficient, ICC, and its associated 95% confidence interval, CI. The ICC is interpretable as the percentage of the overall TIN variance that is attributable to bin-to-bin variation as opposed to within-bin variation. Because the ICC analyses indicated that mice scale their timing in % subjective time units, the degree of overlap between TIN functions normalized in % subjective time was further quantified by the superposition index, η2, a measure of the proportion of variance accounted for by the mean of the two functions (Brown et al., 1992; Brown et al., 2007; Roberts & Church, 1978).
The estimated peak time, μ, was submitted to t tests evaluating accuracy of timing (differences from criterion durations). The peak amplitude of TIN was submitted to repeated measures ANOVAs to evaluate the effect of criterion on the amount of nose-poking behavior. The coefficient of variation, CV, was submitted to repeated measures ANOVAs to evaluate scalar timing. Lack of reliable differences in CV over criterion durations would indicate scalar timing. The individual ICCs were estimated by submitting the multivariate vectors obtained by sampling the response functions in objective and subjective time units to a one-way random effects model (Lachin, 2004). The overall degree of superimposition between the two functions was assessed via a bootstrap confidence interval. In particular, the bias-corrected accelerated bootstrap confidence interval was obtained by generating an empirical distribution of 1000 estimates of the ICC based on the observed data. The approach has the advantage of sound statistical performance while alleviating the need to have a closed-form expression for the variance of the ICC values across animals (Efron, 1981). ICC values greater than 0.85 are indicative of excellent superposition of normalized functions for all time bins (Landis & Koch, 1977), with a value of 1.0 indicating perfect scalar timing. Lack of overlap between the bootstrapped 95% CIs would indicate reliable differences between the two normalization methods: % criterion time vs. % subjective time. The superposition index η10-202 was submitted to a repeated measures ANOVA to further evaluate scalar timing. All statistical tests were evaluated at a significance level of 0.05.
Results and Discussion
All mice showed temporal regulation of behavior at both criterion durations. Figure 2 shows a sample of performance in the 10-s PI trials (left panel) and in the 30-s PI trials (right panel) in mouse M6. Figure 1 indicates less nose-poking at the beginning of each of the trials, vigorous nose-poking about the time the mouse used to be reinforced (10 s or 30 s, denoted as T* in Figure 2), and less nose-poking towards the end of each trial, suggesting that mice acquired the timing task. Figure 2 also indicates that, relative to the 10-s PI trials (left panel), nose-poking in the 30-s PI trials (right panel) starts later and lasts longer, suggestive of scalar timing in this individual mouse.
Figure 2. Temporal regulation of nose-poking behavior in a PI procedure with two intervals in an individual C57BL/6 mouse.

Sample of performance on 10-s PI trials (left panel) and 30-s PI trials (right panel) in mouse M6. Nose-poke responses are indicated by black bars plotted against trial time, with successive trials one on top of the other. T* = criterion durations.
The left panel of Figure 3 shows the average distributions of TIN (time-in-nose-poke) in absolute (1-s) time units during the PI trials. For each PI trial type, the average TIN functions peaked about the time used to be reinforced in that trial, 10-s and 30-s. An estimate of the individual peak time and individual width of the function was obtained by fitting a Gaussian+linear function to each individual TIN function (see Data Analysis), with a goodness of fit r2 = 0.95 ± 0.01. The mean estimated peak time for the 10-s PI trials was 10.34s ± 0.46s, not significantly different from the 10-s criterion duration, t(8) = 2.22, p>0.05, but the mean estimated peak time for the 30-s PI trials was 27.08s ± 1.64s, significantly smaller than the target duration, t(8) = 5.35. Although the left panel of Figure 2 seems to indicate differences in maximum TIN between the 10-s and 30-s PI trials, a repeated ANOVA for the two types of PI trials failed to indicate reliable differences in TIN, F(1,8)=0.81, p>0.05. The average maximum TIN in each 1-sec time bin was 0.45 ± 0.05 s.
Figure 3. Nose-poking in absolute and subjective time units in a PI procedure with two intervals.

Left panel: Average time in nose-poke (TIN) in absolute time units (seconds). Right panel: Average TIN functions normalized in amplitude (peak TIN) and in time (% individual estimated peak time). The degree of overlap of functions is quantified by the superposition index η2, with perfect superposition indicated by a value of 1, and by the intra-class correlation, ICC, with perfect superposition indicated by a value of 1, and its 95% confidence interval.
For each subject, the individual TIN function was normalized both in amplitude (% maximum TIN) and in time (% subjective μ time) (see Data Analysis). When averaged over subjects, the normalized response functions from the 10-s and 30-s PI trials superimposed (degree of superposition η2 = 0.99) suggestive of scalar timing (right panel of Figure2). The later result was supported by a repeated ANOVA of the coefficient of variation (CV = σ / μ) from the 10-s and 30-s PI trials, which failed to indicate reliable differences between the two durations, F(1,8)=3.12, p>0.05. Importantly, scalar timing was also revealed at the level of each individual mouse (Figure 4). The very good superposition of the 10-s and 30-s normalized TIN functions for each individual mouse (η2 = 0.94 ±0.4, range 0.76-0.99) supports scalar timing in C57BL/6 mice. The average estimated CV was 0.63 ± 0.01, considerably larger than the CV estimated for humans, about 0.15 (Rakitin et al., 1998), and rats, about 0.4 (reviewed by Buhusi & Meck, 2005).
Figure 4. Individual normalized response functions in a PI procedure with two intervals.

Individual TIN functions normalized in amplitude (peak TIN) and in time (% individual estimated peak time). The degree of overlap of functions is quantified by the superposition index η2, with perfect superposition indicated by a value of 1, and by the intraclass correlation, ICC, with perfect superposition indicated by a value of 1, and its 95% confidence interval.
To further evaluate whether subjects scale their timing relative to the experimenter’s objective time units or relative to the subjective perceived time, intra-class correlations (ICCs) were estimated for each individual mouse after normalizing the TIN functions in amplitude (% maximum TIN) and in time, relative to the criterion intervals (% criterion time) or relative to the individually acquired μ durations (% subjective time). ICC values greater than 0.85 are indicative of good superposition between the two TIN functions for all time bins (Landis & Koch, 1977), with a value of 1.0 indicating perfect scalar timing. When normalized in percent criterion time, the ICCs ranged from 0.70 to 0.98 (left column of Table 1). However, ICCs improved significantly when the percent maximum TIN functions were rescaled based on the individual animal’s subjective target time, range 0.88 to 1.0 (right column of Table 2). Correspondingly, the bootstrap estimate for the experiment-wide reliability increased reliably from 0.84 (95% CI: 0.80 to 0.90) for percent criterion time to 0.97 (95% CI: 0.95 to 0.98) for percent subjective time. In the latter case percent subjective time bins accounted for 97% of the variation of TIN while the objective criterion durations only accounted for 3% of the overall variation. These results provide further support for a scalar property in percent subjective time (right panel of Figure 3).
Table 2. Intraclass correlations (ICC) of TIN for experiment 1.
| % Max TIN in % Objective Criterion Time Units |
% Max TIN in % Subjective Criterion Time Units |
|||
|---|---|---|---|---|
| Subject | ICC | 95% CI | ICC | 95% CI |
| M1 | 0.85 | [0.72, 0.93] | 0.96 | [0.92, 0.98] |
| M2 | 0.70 | [0.47, 0.84] | 0.94 | [0.88, 0.97] |
| M3 | 0.81 | [0.65, 0.90] | 0.97 | [0.93, 0.98] |
| M4 | 0.79 | [0.62, 0.89] | 0.97 | [0.94, 0.99] |
| M5 | 0.93 | [0.85, 0.96] | 0.98 | [0.96, 0.99] |
| M6 | 0.98 | [0.96, 0.99] | 0.98 | [0.96, 0.99] |
| M7 | 0.86 | [0.73, 0.93] | 0.99 | [0.98, 1.00] |
| M8 | 0.76 | [0.55, 0.87] | 0.98 | [0.95, 0.99] |
| M9 | 0.91 | [0.82, 0.95] | 0.98 | [0.96, 0.99] |
| Overall Bootstrap Estimate |
0.84 |
[0.80, 0.90] |
0.97 |
[0.96, 0.98] |
In summary, in Experiment 1 C57B/6 mice accurately timed the 10-s duration, but slightly underestimated the 30-s duration (Figure 3, left panel). Nevertheless, relative to their subjective timed durations, C57B/6 mice showed scalar timing, both as a group (Figure 3, right panel), and individually (Figure 4). These results match those reported in the PI procedure in human participants (Rakitin et al., 1998) and rats (Church et al., 1994). We hypothesized that the failure of Gallistel et al. (2004) to find the scalar property was due to the difficulty of their task, i.e., using timing three durations. Therefore, we expected that in Experiment 2 mice will fail to display the scalar property.
Experiment 2
We evaluated the accuracy and precision of interval timing in C57BL/6 mice in a PI procedure with three intervals, 10 s, 20 s and 40 s. Mice received separate, randomly intermixed, FI and PI trials for each of the three durations. The response functions in the PI trials were used for estimating timing accuracy and scalar timing. We hypothesized that timing three intervals will interfere with mice’s capacity for scalar timing.
Methods
The methods were similar to those for Experiment 1 with the following differences:
Subjects
The subjects were 8 naïve male C57BL/6 mice (Mus musculus; Charles River Labs, Raleigh, NC).
Apparatus
Operant boxes were equipped with three nose-pokes located two on the front and one on the back wall. For each subject a criterion duration, 10 s, 20 s or 40 s, was randomly assigned to each nose-poke, counterbalanced by location.
Fixed Interval (FI) Sessions (1-10)
FI trials with each of the three criterion durations were randomly intermixed. Subjects received an average of 36 FI trials for each timed criterion per session.
Peak Interval (PI) Sessions (11-50)
FI trials were randomly interspersed with non-reinforced 10-s, 20-s and 40-s PI trials. During each session subjects received an average of 24 FI trials and 12 PI trials for each timed criterion.
Data Analysis
Data in the last 12 PI sessions were submitted to analyses as described for Experiment 1, except that superposition indices, η2, were computed for pairs of normalized functions, η10-202, η10-402, η20-402, and submitted to a repeated measures ANOVA to further evaluate scalar timing in Experiment 2.
Results and Discussion
All mice showed temporal regulation of behavior at the three durations, and maximal poking about the criterion durations. The average TIN functions peaked about the reinforced durations (10 s, 20 s, and 40 s, left panel of Figure 5). After fitting the individual TIN functions by Gaussian+linear functions (goodness of fit r2 = 0.96 ± 0.01), the mean estimated peak times were 10.06 ± 0.27 s, not significantly different from the 10-s criterion, t(7) = 0.22, 19.03 ± 0.25 s, significantly smaller than the 20-s criterion, t(7) = 3.83, and 35.27 ± 0.79 s, significantly smaller than the 40 s target duration, t(7) = 6.02. Moreover, a repeated measures ANOVA of the TIN amplitude indicated a reliable effect of criterion duration, F(2,14) = 30.83. Post-hoc analyses failed to indicate differences in TIN amplitude between the 10 s and 20-s durations, but revealed a significantly smaller TIN at the 40 s criterion.
Figure 5. Nose-poking in absolute and subjective time units in a PI procedure with three intervals in C57BL/6 mice.

Left panel: Average time in nose-poke (TIN) in absolute time units (seconds). Right panel: Average percent TIN functions normalized in amplitude (peak TIN) and in time (% individual estimated peak time). The degree of overlap of functions is quantified by the superposition index η2, with perfect superposition indicated by a value of 1, and by the intra-class correlation, ICC, with perfect superposition indicated by a value of 1, and its 95% confidence interval.
Despite differences in timing accuracy among the three durations, and despite differences in amount of nose-poking behavior, a repeated ANOVA of the coefficient of variation CV failed to indicate reliable differences between the three durations, F(2,14)=0.73, suggesting that mice used scalar timing. The average CV was 0.59 ± 0.01. When the percent maximum TIN functions were normalized in percent objective time, the ICCs ranged from 0.33 to 0.64 (left column of Table 3), with a bootstrap estimate for the experiment-wide reliability of 0.45 (95% CI: 0.40 to 0.52), indicative of poor superposition. However, ICCs improved reliably when the percent maximum TIN functions were rescaled based on the individual’s subjective target time (right panel of Figure 5): the individual ICCs ranged from 0.93 to 0.98 (right column of Table 3) with a bootstrap estimate for the experiment-wide reliability of 0.96 (95% CI: 0.94 to 0.97), indicating highly reliable superposition of the three response functions both at the level of individual mice, and as a group.
Table 3. Intraclass correlations (ICC) of TIN for experiment 2.
| % Max TIN in % Objective Criterion Time Units |
% Max TIN in % Subjective Criterion Time Units |
|||
|---|---|---|---|---|
| Subject | ICC | 95% CI | ICC | 95% CI |
| M10 | 0.46 | [0.22, 0.65] | 0.98 | [0.97, 0.99] |
| M11 | 0.52 | [0.30, 0.70] | 0.96 | [0.93, 0.98] |
| M12 | 0.47 | [0.24, 0.67] | 0.98 | [0.97, 0.99] |
| M13 | 0.48 | [0.24, 0.67] | 0.96 | [0.92, 0.98] |
| M14 | 0.33 | [0.08, 0.56] | 0.95 | [0.91, 0.97] |
| M15 | 0.63 | [0.44, 0.78] | 0.94 | [0.89, 0.97] |
| M16 | 0.35 | [0.10, 0.57] | 0.93 | [0.87, 0.96] |
| M17 | 0.38 | [0.13, 0.60] | 0.95 | [0.91, 0.97] |
| Overall Bootstrap Estimate |
0.45 |
[0.40, 0.52] |
0.96 |
[0.94, 0.97] |
When the individual TIN functions were normalized relative to the individually acquired criterion durations, they superimposed very well for each individual (η2 = 0.88 ± 0.02) (Figure 6). A repeated measures ANOVA of the coefficients of superposition η2 among pairs of timed durations, η10-202, η10-402, η20-402, failed to indicate an effect of pair, F(2,14)=0.72, p>0.05, providing further support for scalar timing. The right panel of Figure 5 shows the average normalized response functions for the 10-, 20-, and 40-s PI trials in subjective time units. The good superposition of the individual (Figure 6) and average response functions (Figure 5) supports scalar timing in C57BL/6 mice in a PI procedure with three intervals.
Figure 6. Individual normalized response functions in a PI procedure with three intervals.
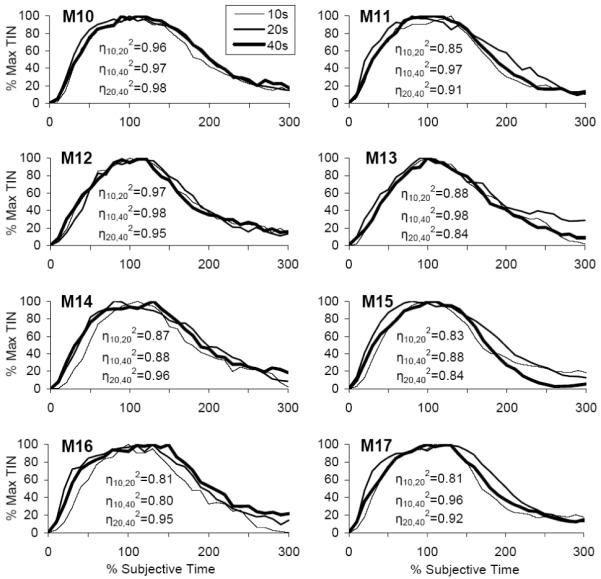
Individual TIN functions normalized in amplitude (peak TIN) and in time (% individual estimated peak time). The degree of overlap of functions is quantified by the superposition index η2. Intraclass correlations, ICCs, and their 95% confidence intervals are shown for individual mice in Table 3.
These results only partially support our hypothesis that the difficulty of the task interfere with timing in mice. Relative to Experiment 1, when timing three intervals in a larger range, mice were reliably less accurate at the longer durations than at the short duration; these data support an effect of task difficulty on accuracy of timing. However, in both experiments, mice displayed scalar timing in subjective time units, i.e., above and beyond their own timing accuracy. These data suggest substantial individual differences among mice, but largely suggest that as a species mice use time in a scalar manner, as shown for other species (reviewed by Buhusi & Meck, 2005).
General Discussion
We evaluated timing accuracy and scalar timing when C57BL/6 mice were trained to time two intervals (Experiment 1) or three intervals (Experiment 2). In both experiments, timing accuracy varied with the to-be-timed criterion: Mice accurately estimated the short 10 s duration, but they mildly (but reliably) underestimated (with about 10%) the 20 s, 30 s and 40 s durations. Although their accuracy varied with the criterion duration, analyses failed to reveal reliable differences in the coefficient of variation, CV, suggesting the use of scalar timing in both experiments. When the response functions were normalized for each individual relative to the objective criterion durations, the normalized functions superimposed to a relatively low degree in both experiments, indicating that mice do not scale their timing relative to the experimenter’s clock. Instead, when normalized in subjectively estimated time, the normalized functions superimposed to a very high degree in both experiments, suggesting that subjects scale their timing in their own subjective time units (Figures 4 and 6). Another measure of superposition, η2, also indicated a high degree of scalar timing in subjective time units. Finally, the data presented in Tables 2 and 3 also suggest that the ICC statistical analysis is a powerful tool to evaluate scalar timing; the ICCs superposition confidence interval increased dramatically when response functions were scaled in individual time units (right columns of Tables 2 and 3).
This is the first report of consistent, reliable scalar timing in a sizable sample of house mice. We investigated scalar property in seventeen mice, a sample size considerably larger in than previous studies (see Table 1). In terms of consistency, all of the mice investigated here showed the scalar property at a liberal level of η2 > 0.8, in contrast to less than 40% in previous studies; when the threshold is raised to η2 > 0.85, 88% of the subjects in our study showed scalar property, with only 10% passing this test in previous studies (see Table 1 and Figure 1.) In terms of reliability, this is the first study to report scalar property using an index of superposition (ICC) which can be directly used in hypothesis testing. While CV is a useful statistic, it does not characterize superposition of the full response function. Moreover, the sampling distribution of η2 is largely unknown; therefore, using these indices may be misleading. In contrast, for the newly introduced ICC measure of the scalar property, we were able to report an associated estimated 95% degree of confidence. Tables 2 and 3 indicate mice consistently show remarkably high ICCs. In Experiments 1 and 2, when mice timed two and three durations, the overall estimated ICC was 0.96 (1 being perfect scalar property) with 95% confidence intervals of [0.96 – 0.98] and [0.96 – 0.98] respectively. Therefore, our report provides a high degree of confidence in scalar property in C57BL/6 mice, thus validate this strain as a suitable animal model for further neurophysiological studies of interval timing, validate the PI task for the independent evaluation of the timing accuracy and precision in mice, and validate the ICC analysis as a statistical test of the scalar property.
The discrepancies between our findings and those from previous studies are apparent. A recent investigation of response switching (Balci, Papachristos et al., 2008, Exp 2) concluded that only half of the four mice investigated show switching responses compatible with scalar timing in C57BL/6 mice. Notably, in the Balci study, responses are scaled in the experimenter’s time units. In similarity to the Balci study, our study revealed that using the experimenter’s objective time obscures the scalar timing phenomenon. In the present study the ICCs were considerably smaller when response functions were scaled in percent criterion time, suggesting that the experimenter’s time units are a poor judge of scalar timing (see Tables 2 and 3, left columns). However, when analyzed in percent subjective time, the response functions superimposed to a very high degree, indicated by reliably and substantially higher ICCs, indicating that C57BL/6 mice do show scalar timing in percent subjective time units. Therefore, the lack of scalar timing in the Balci study may simply reflect a failure to identify the timing scale used by each individual mouse. Proper estimates of individual timing accuracy (individually acquired criterion durations) seem critical for revealing scalar timing at the level of individual mice.
Alternatively, the lack of scalar timing in the Balci study may reflect factors related to the complexity of the task, involving spatial, temporal, and possibly other, components (Lejeune, Ferrara, Simons, & Wearden, 1997; Lejeune & Wearden, 1991, 2006). In the Balci task timing behavior is only indirectly inferred from spatial switching behavior, which is dependent on the limbic system (Floresco, Ghods-Sharifi, Vexelman, & Magyar, 2006; Goto & Grace, 2005; Lee & Knierim, 2007). In contrast, interval timing behavior is thought to reflect activity in the frontal-striatal circuits (Buhusi & Meck, 2005; Buhusi & Meck, 2009; Meck, 2006).
Although it is relatively easier to reconcile our findings with the Balci study, it is more difficult to do so with the Gallistel et al. (2004) study, which reported results incompatible with scalar timing in a PI procedure in Swiss-Webster mice. Both the Gallistel et al. study and the present study use poking behavior in a variant of the PI procedure; both studies use three criterion durations in a similar range of durations; both studies use positive reinforcement; both studies resulted in a similar pattern of response (see Gallistel et al., 2004, p. 7, Figure 2); no timing restrictions were imposed in either study. Instead, it is possible that the differences in results may be due to differences in the strain of mouse analyzed: Swiss-Webster in Gallistel et al. (2004) and C57BL/6 in our study.
Various strains of mice have vastly different performance characteristics in many behavioral paradigms including the Morris water task (Crawley, 2007), fear conditioning (Smith, Gallagher, & Stanton, 2007), radial arm maze (Crawley, 2007), conditional spatial alternation (Crawley et al., 1997), social behavior (Champagne, Curley, Keverne, & Bateson, 2007; Moy et al., 2007), prepulse inhibition (Paylor & Crawley, 1997), and various tests of analgesia (Lariviere, Chesler, & Mogil, 2001; Lariviere et al., 2002) and depression (Cryan & Holmes, 2005; Lucki, Dalvi, & Mayorga, 2001). Therefore, it would not be surprising to find strain differences in interval timing behavior. For example, while Swiss-Webster mice are relatively accurate at all durations (Gallistel et al., 2004), we found that C57BL/6 mice more accurate at short duration than at longer durations. Moreover, while Swiss-Webster mice are more precise at long durations than at shorter durations (see Figure 1, panel B), C57BL/6 mice are as precise at all durations in our behavioral protocol.
These differences correlate with neurophysiological differences in the two strains, particularly in regard to the dopaminergic system, a neurotransmitter system critical for interval timing (Buhusi & Meck, 2005; Meck, 1996). While the Swiss-Webster and C57BL/6 strains show similar performance in serotonin-dependent tests of anxiety (Ralph & Caine, 2005), they differ in regard to dopaminergic-dependent (Bondar & Kudryavtseva, 2005; Wilkerson & Levin, 1999) tasks such as spatial learning (Ralph & Caine, 2005; Wright et al., 2004) and aggressive behavior (Blanchard et al., 2006). The two strains are differentially sensitive to D1-like and D2-like agonists (Ralph & Caine, 2005). Indeed, relative to other strains, C57BL/6 mice are more sensitive to the effects of direct and indirect dopamine agonists (Puglisi-Allegra & Cabib, 1997), and show relatively increased dopaminergic transmission in the mesostriatal projection (Cabib, Puglisi-Allegra, & Ventura, 2002), a dopaminergic circuit critical for interval timing (Buhusi & Meck, 2005; Meck, 1996). This latter feature correlates with the strain’s greater novelty-induced locomotor activity and impulsivity (Cabib et al., 2002), and may account for the underestimation of longer intervals in the present study. Differences in the dopaminergic system between of these two strains may be responsible for the different results in the present timing experiments and in the Gallistel et al. (2004) study.
The fact that accurate, scalar timing was demonstrated by both human participants (Rakitin et al., 1998) and mice (this study), is important for establishing an effective translational value of a finding in genetically altered mice. However, present data suggest the importance of analyses at the level of individual subject and for more rigorous evaluation of the scalar property using measures of superposition—like the intra-cIass correlation ICC used in this study—allowing for the evaluation of the reliability of the timing deficits under various conditions, in different mouse strains, or in genetically altered mice. For example, the use of the ICC measure of scalar timing will prove useful in reliably estimating changes in scalar timing by genetic manipulations.
Acknowledgments
Support for the development of the ICC intraclass correlation analysis was provided by National Institutes of Health grants MH065561 and MH73057 to CVB. The animal work was supported by a 2007 Independent Investigator Award from NARSAD, The Mental Health Research Association, to CVB, and by grant EPS-0447660 from NSF to the Phenomics Center, Medical University of South Carolina. This work was conducted in a facility constructed with support from the National Institutes of Health, Grant Number C06 RR015455 from the Extramural Research Facilities Program of the National Center for Research Resources.
Footnotes
Publisher's Disclaimer: The following manuscript is the final accepted manuscript. It has not been subjected to the final copyediting, fact-checking, and proofreading required for formal publication. It is not the definitive, publisher-authenticated version. The American Psychological Association and its Council of Editors disclaim any responsibility or liabilities for errors or omissions of this manuscript version, any version derived from this manuscript by NIH, or other third parties. The published version is available at www.apa.org/pubs/journals/bne.
References
- Abner RT, Edwards T, Douglas A, Brunner D. Pharmacology of temporal cognition in two mouse strains. International Journal of Comparative Psychology. 2001;14:189–210. [Google Scholar]
- Balci F, Gallistel CR, Allen BD, Frank KM, Gibson JM, Brunner D. Acquisition of peak responding: what is learned? Behav Processes. 2009;80(1):67–75. doi: 10.1016/j.beproc.2008.09.010. [DOI] [PMC free article] [PubMed] [Google Scholar]
- Balci F, Ludvig EA, Gibson JM, Allen BD, Frank KM, Kapustinski BJ, Fedolak TE, Brunner D. Pharmacological manipulations of interval timing using the peak procedure in male C3H mice. Psychopharmacology (Berl) 2008;201(1):67–80. doi: 10.1007/s00213-008-1248-y. [DOI] [PubMed] [Google Scholar]
- Balci F, Papachristos EB, Gallistel CR, Brunner D, Gibson J, Shumyatsky GP. Interval timing in genetically modified mice: a simple paradigm. Genes Brain Behav. 2008;7(3):373–384. doi: 10.1111/j.1601-183X.2007.00348.x. [DOI] [PMC free article] [PubMed] [Google Scholar]
- Barkley RA, Murphy KR, Bush T. Time perception and reproduction in young adults with attention deficit hyperactivity disorder. Neuropsychology. 2001;15(3):351–360. doi: 10.1037//0894-4105.15.3.351. [DOI] [PubMed] [Google Scholar]
- Blanchard RJ, Parmigiani S, Agullana, Rey, Weiss, Scott M, Blanchard DC. Behaviors of Swiss-Webster and C57/BL/6N mice in a fear/defense test battery. Aggressive Behavior. 2006;21(1):21–28. [Google Scholar]
- Boisvert MJ, Sherry DF. Interval timing by an invertebrate, the bumble bee Bombus impatiens. Current Biology. 2006;16(16):1636–1640. doi: 10.1016/j.cub.2006.06.064. M. J. D. F. [DOI] [PubMed] [Google Scholar]
- Bondar NP, Kudryavtseva NN. The effects of the D1 receptor antagonist SCH-23390 on individual and aggressive behavior in male mice with different experience of aggression. Neurosci Behav Physiol. 2005;35(2):221–227. doi: 10.1007/s11055-005-0017-1. [DOI] [PubMed] [Google Scholar]
- Brown BL, Hemmes NS, Cabeza de Vaca S. Effects of intratrial stimulus change on fixed interval performance: the roles of clock and memory processes. Animal Learning & Behavior. 1992;20:83–93. [Google Scholar]
- Brown BL, Richer P, Doyere V. The effect of an intruded event on peak-interval timing in rats: isolation of a postcue effect. Behavioural Processes. 2007;74(3):300–310. doi: 10.1016/j.beproc.2006.11.004. [DOI] [PubMed] [Google Scholar]
- Buhusi CV, Lamoureux JA, Meck WH. Prenatal choline supplementation increases sensitivity to contextual processing of temporal information. Brain Res. 2008 doi: 10.1016/j.brainres.2008.08.072. [DOI] [PMC free article] [PubMed] [Google Scholar]
- Buhusi CV, Meck WH. Timing for the absence of a stimulus: the gap paradigm reversed. Journal of Experimental Psychology: Animal Behavior Processes. 2000;26(3):305–322. doi: 10.1037//0097-7403.26.3.305. [DOI] [PubMed] [Google Scholar]
- Buhusi CV, Meck WH. Differential effects of methamphetamine and haloperidol on the control of an internal clock. Behavioral Neuroscience. 2002;116(2):291–297. doi: 10.1037//0735-7044.116.2.291. [DOI] [PubMed] [Google Scholar]
- Buhusi CV, Meck WH. What Makes Us Tick? Functional And Neural Mechanisms Of Interval Timing. Nature Reviews Neuroscience. 2005;6(10):755–765. doi: 10.1038/nrn1764. [DOI] [PubMed] [Google Scholar]
- Buhusi CV, Meck WH. Effect of clozapine on interval timing and working memory for time in the peak-interval procedure with gaps. Behavioural Processes. 2007;74(2):159–167. doi: 10.1016/j.beproc.2006.10.004. [DOI] [PMC free article] [PubMed] [Google Scholar]
- Buhusi CV, Meck WH. Relative time sharing: new findings and an extension of the resource allocation model of temporal processing. Philos Trans R Soc Lond B Biol Sci. 2009;364(1525):1875–1885. doi: 10.1098/rstb.2009.0022. [DOI] [PMC free article] [PubMed] [Google Scholar]
- Buhusi CV, Paskalis J-PG, Cerutti DT. Time-sharing in pigeons: Independent effects of gap duration, position and discriminability from the timed signal. Behavioural Processes. 2006;71(23):116–125. doi: 10.1016/j.beproc.2005.10.006. [DOI] [PubMed] [Google Scholar]
- Cabib S, Puglisi-Allegra S, Ventura R. The contribution of comparative studies in inbred strains of mice to the understanding of the hyperactive phenotype. Behavioural Brain Research. 2002;130(12):103–109. doi: 10.1016/s0166-4328(01)00422-3. [DOI] [PubMed] [Google Scholar]
- Carvalho OM, Silva AJ, Balleine BW. Evidence of selective learning deficits on tests of pavlovian and instrumental conditioning in α-CaMKII(T286A) mutant mice. International Journal of Comparative Psychology. 2001;14(34):161–174. [Google Scholar]
- Catania AC. Reinforcement schedules and psychophysical judgements: A study of some temporal properties of behavior. In: Schoenfeld WN, editor. The theory of reinforcement schedules. Appleton-Century-Crofts; New York: 1970. pp. 1–42. [Google Scholar]
- Champagne FA, Curley JP, Keverne EB, Bateson PP. Natural variations in postpartum maternal care in inbred and outbred mice. Physiology and Behavior. 2007;91(23):325–334. doi: 10.1016/j.physbeh.2007.03.014. [DOI] [PubMed] [Google Scholar]
- Cheng K, Westwood R. Analysis of single trials in pigeons’ timing performance. Journal of Experimental Psychology: Animal Behavior Processes. 1993;19:56–67. [Google Scholar]
- Church RM, Meck WH, Gibbon J. Application of scalar timing theory to individual trials. Journal of Experimental Psychology: Animal Behavior Processes. 1994;20(2):135–155. doi: 10.1037//0097-7403.20.2.135. [DOI] [PubMed] [Google Scholar]
- Crawley JN. What’s Wrong With My Mouse? Behavioral Phenotyping of Transgenic and Knockout Mice. 2 ed. John Wiley & Sons., Inc.; Hoboken, NJ: 2007. [Google Scholar]
- Crawley JN, Belknap JK, Collins A, Crabbe JC, Frankel W, Henderson N, Hitzemann RJ, Maxson SC, Miner LL, Silva AJ, Wehner JM, Wynshaw-Boris A, Paylor R. Behavioral phenotypes of inbred mouse strains: implications and recommendations for molecular studies. Psychopharmacology (Berl) 1997;132(2):107–124. doi: 10.1007/s002130050327. [DOI] [PubMed] [Google Scholar]
- Cryan JF, Holmes A. The ascent of mouse: advances in modelling human depression and anxiety. Nature Reviews Drug Discovery. 2005;4(9):775–790. doi: 10.1038/nrd1825. [DOI] [PubMed] [Google Scholar]
- Dews PB. The effect of multiple S delta periods on responding on a fixed-interval schedule. Journal of Experimental Analysis of Behavior. 1962;5:369–374. doi: 10.1901/jeab.1962.5-369. [DOI] [PMC free article] [PubMed] [Google Scholar]
- Drew MR, Simpson EH, Kellendonk C, Herzberg WG, Lipatova O, Fairhurst S, Kandel ER, Malapani C, Balsam PD. Transient overexpression of striatal D2 receptors impairs operant motivation and interval timing. Journal of Neuroscience. 2007;27(29):7731–7739. doi: 10.1523/JNEUROSCI.1736-07.2007. [DOI] [PMC free article] [PubMed] [Google Scholar]
- Efron B. Nonparametric estimates of standard error: The jackknife, the bootstrap and other methods. Biometrika. 1981;68:589–599. [Google Scholar]
- Floresco SB, Ghods-Sharifi S, Vexelman C, Magyar O. Dissociable roles for the nucleus accumbens core and shell in regulating set shifting. J Neurosci. 2006;26(9):2449–2457. doi: 10.1523/JNEUROSCI.4431-05.2006. [DOI] [PMC free article] [PubMed] [Google Scholar]
- Gallistel CR. The organization of behavior. MIT Press; Cambridge, MA: 1990. [Google Scholar]
- Gallistel CR, King AP, McDonald RV. Sources of variability and systematic error in mouse timing behavior. Journal of Experimental Psychology: Animal Behavior Processes. 2004;30(1):3–16. doi: 10.1037/0097-7403.30.1.3. [DOI] [PubMed] [Google Scholar]
- Gibbon J. Scalar expectancy theory and Weber’s law in animal timing. Psychological Review. 1977;84(3):279–325. [Google Scholar]
- Gibbon J, Church RM, Meck WH. Scalar timing in memory. Annals of the New York Academy of Sciences. 1984;423:52–77. doi: 10.1111/j.1749-6632.1984.tb23417.x. [DOI] [PubMed] [Google Scholar]
- Goto Y, Grace AA. Dopaminergic modulation of limbic and cortical drive of nucleus accumbens in goal-directed behavior. Nat Neurosci. 2005;8(6):805–812. doi: 10.1038/nn1471. [DOI] [PubMed] [Google Scholar]
- Henderson J, Hurly TA, Bateson M, Healy SD. Timing in free-living rufous hummingbirds, Selasphorus rufus. Current Biology. 2006;16(5):512–515. doi: 10.1016/j.cub.2006.01.054. [DOI] [PubMed] [Google Scholar]
- King AP, Gallistel CR, McDonald RV. Screening for Mice that Remember Incorrectly. International Journal of Comparative Psychology. 2001;14:232–257. [Google Scholar]
- Lachin JM. The role of measurement reliability in clinical trials. Clin Trials. 2004;1(6):553–566. doi: 10.1191/1740774504cn057oa. [DOI] [PubMed] [Google Scholar]
- Landis JR, Koch GG. The measurement of observer agreement for categorical data. Biometrics. 1977;33(1):159–174. [PubMed] [Google Scholar]
- Lariviere WR, Chesler EJ, Mogil JS. Transgenic studies of pain and analgesia: mutation or background genotype? The Journal of Pharmacology and Experimental Therapeutics. 2001;297(2):467–473. [PubMed] [Google Scholar]
- Lariviere WR, Wilson SG, Laughlin TM, Kokayeff A, West EE, Adhikari SM, Wan Y, Mogil JS. Heritability of nociception. III. Genetic relationships among commonly used assays of nociception and hypersensitivity. Pain. 2002;97(12):75–86. doi: 10.1016/s0304-3959(01)00492-4. [DOI] [PubMed] [Google Scholar]
- Lee I, Knierim JJ. The relationship between the field-shifting phenomenon and representational coherence of place cells in CA1 and CA3 in a cue-altered environment. Learn Mem. 2007;14(11):807–815. doi: 10.1101/lm.706207. [DOI] [PMC free article] [PubMed] [Google Scholar]
- Lejeune H, Ferrara A, Simons F, Wearden JH. Adjusting to changes in the time of reinforcement: peak-interval transitions in rats. Journal of Experimental Psychology: Animal Behavior Processes. 1997;23(2):211–231. doi: 10.1037//0097-7403.23.2.211. [DOI] [PubMed] [Google Scholar]
- Lejeune H, Wearden JH. The comparative psychology of fixed-interval responding: some quantitative analyses. Learning and Motivation. 1991;22:84–111. [Google Scholar]
- Lejeune H, Wearden JH. Scalar properties in animal timing: conformity and violations. Quarterly Journal of Experimental Psychology. 2006;59(11):1875–1908. doi: 10.1080/17470210600784649. [DOI] [PubMed] [Google Scholar]
- Lucki I, Dalvi A, Mayorga AJ. Sensitivity to the effects of pharmacologically selective antidepressants in different strains of mice. Psychopharmacology (Berl) 2001;155(3):315–322. doi: 10.1007/s002130100694. [DOI] [PubMed] [Google Scholar]
- Malapani C, Rakitin B, Levy R, Meck WH, Deweer B, Dubois B, Gibbon J. Coupled temporal memories in Parkinson’s disease: a dopamine-related dysfunction. Journal of Cognitive Neuroscience. 1998;10(3):316–331. doi: 10.1162/089892998562762. [DOI] [PubMed] [Google Scholar]
- Marquardt DW. An algorithm for least squares estimation of parameters. Journal of the Society of Industrial and Applied Mathematics. 1963;11:431–441. [Google Scholar]
- Matell MS, Bateson M, Meck WH. Single-trials analyses demonstrate that increases in clock speed contribute to the methamphetamine-induced horizontal shifts in peak-interval timing functions. Psychopharmacology. 2006;188(2):201–212. doi: 10.1007/s00213-006-0489-x. [DOI] [PubMed] [Google Scholar]
- Matell MS, King GR, Meck WH. Differential modulation of clock speed by the administration of intermittent versus continuous cocaine. Behavioral Neuroscience. 2004;118(1):150–156. doi: 10.1037/0735-7044.118.1.150. [DOI] [PubMed] [Google Scholar]
- Matell MS, Meck WH, Nicolelis MA. Interval timing and the encoding of signal duration by ensembles of cortical and striatal neurons. Behavioral Neuroscience. 2003;117(4):760–773. doi: 10.1037/0735-7044.117.4.760. [DOI] [PubMed] [Google Scholar]
- Meck WH. Neuropharmacology of timing and time perception. Cognitive Brain Research. 1996;3(34):227–242. doi: 10.1016/0926-6410(96)00009-2. [DOI] [PubMed] [Google Scholar]
- Meck WH. Interval timing and genomics: What makes mutant mice tick? International Journal of Comparative Psychology. 2001;14(34):211. [Google Scholar]
- Meck WH. Neuroanatomical localization of an internal clock: A functional link between mesolimbic, nigrostriatal, and mesocortical dopaminergic systems. Brain Research. 2006;1109(1):93–107. doi: 10.1016/j.brainres.2006.06.031. [DOI] [PubMed] [Google Scholar]
- MED-Associates . WMPC software, version 1.15 [Computer software] St. Albans, VT: 1999. [Google Scholar]
- Moy SS, Nadler JJ, Young NB, Perez A, Holloway LP, Barbaro RP, Barbaro JR, Wilson LM, Threadgill DW, Lauder JM, Magnuson TR, Crawley JN. Mouse behavioral tasks relevant to autism: phenotypes of 10 inbred strains. Behavioural Brain Research. 2007;176(1):4–20. doi: 10.1016/j.bbr.2006.07.030. [DOI] [PMC free article] [PubMed] [Google Scholar]
- Nichelli P, Venneri A, Molinari M, Tavani F, Grafman J. Precision and accuracy of subjective time estimation in different memory disorders. Brain Research Cognitive Brain Research. 1993;1(2):87–93. doi: 10.1016/0926-6410(93)90014-v. [DOI] [PubMed] [Google Scholar]
- Paulsen JS, Zimbelman JL, Hinton SC, Langbehn DR, Leveroni CL, Benjamin ML, Reynolds NC, Rao SM. fMRI Biomarker of Early Neuronal Dysfunction in Presymptomatic Huntington’s Disease. American Journal of Neuroradiology. 2004;25(10):1715–1721. [PMC free article] [PubMed] [Google Scholar]
- Paylor R, Crawley JN. Inbred strain differences in prepulse inhibition of the mouse startle response. Psychopharmacology (Berl) 1997;132(2):169–180. doi: 10.1007/s002130050333. [DOI] [PubMed] [Google Scholar]
- Penney TB, Meck WH, Roberts SA, Gibbon J, Erlenmeyer-Kimling L. Interval-timing deficits in individuals at high risk for schizophrenia. Brain and Cognition. 2005;58(1):109–118. doi: 10.1016/j.bandc.2004.09.012. T. B. W. H. S. A. J. L. [DOI] [PubMed] [Google Scholar]
- Puglisi-Allegra S, Cabib S. Psychopharmacology of dopamine: The contribution of comparative studies in inbred strains of mice. Progress in Neurobiology. 1997;51(6):637–661. doi: 10.1016/s0301-0082(97)00008-7. [DOI] [PubMed] [Google Scholar]
- Radonovich KJ, Mostofsky SH. Duration judgments in children with ADHD suggest deficient utilization of temporal information rather than general impairment in timing. Child Neuropsychology. 2004;10(3):162–172. doi: 10.1080/09297040409609807. [DOI] [PubMed] [Google Scholar]
- Rakitin BC, Gibbon J, Penney TB, Malapani C, Hinton SC, Meck WH. Scalar expectancy theory and peak-interval timing in humans. Journal of Experimental Psychology: Animal Behavior Processes. 1998;24(1):15–33. doi: 10.1037//0097-7403.24.1.15. [DOI] [PubMed] [Google Scholar]
- Ralph RJ, Caine SB. Dopamine D1 and D2 Agonist Effects on Prepulse Inhibition and Locomotion: Comparison of Sprague-Dawley Rats to Swiss-Webster, 129X1/SvJ, C57BL/6J, and DBA/2J Mice. The Journal of Pharmacology and Experimental Therapeutics. 2005;312(2):733–741. doi: 10.1124/jpet.104.074468. [DOI] [PubMed] [Google Scholar]
- Roberts S, Church RM. Control of an internal clock. Journal of Experimental Psychology: Animal Behavior Processes. 1978;4:318–337. [Google Scholar]
- Smith DR, Gallagher M, Stanton ME. Genetic background differences and nonassociative effects in mouse trace fear conditioning. Learning and Memory. 2007;14(9):597–605. doi: 10.1101/lm.614807. [DOI] [PMC free article] [PubMed] [Google Scholar]
- Systat Software, I . SigmaPlot. San Jose, CA: 2004. [Google Scholar]
- Talton LE, Higa JJ, Staddon JER. Interval schedule performance in the goldfish Carassius auratus. Behavioural Processes. 1999;45:193–206. doi: 10.1016/s0376-6357(99)00018-2. [DOI] [PubMed] [Google Scholar]
- Wilkerson A, Levin ED. Ventral hippocampal dopamine D1 and D2 systems and spatial working memory in rats. Neuroscience. 1999;89(3):743–749. doi: 10.1016/s0306-4522(98)00346-7. [DOI] [PubMed] [Google Scholar]
- Wright JW, Alt JA, Turnera GD, Kruegerb JM. Differences in spatial learning comparing transgenic p75 knockout, New Zealand Black, C57BL/6, and Swiss Webster mice. Behavioural Brain Research. 2004;153(2):453–458. doi: 10.1016/j.bbr.2004.01.001. [DOI] [PubMed] [Google Scholar]