

Abstract
Phenotypic variation in bone mineral density (BMD) among healthy adults is influenced by both genetic and environmental factors. Genetic sequence variations in the adenylate cyclase 10 (ADCY10) gene, which is also called soluble adenylate cyclase, have previously been reported to be associated with low spinal BMD in hypercalciuric patients. Since ADCY10 is located in the region linked to spinal BMD in our previous linkage analysis, we tested whether polymorphisms in this gene are also associated with normal BMD variation in healthy adults. Sixteen single nucleotide polymorphisms (SNPs) distributed throughout ADCY10 were genotyped in two healthy groups of American whites: 1,692 premenopausal women and 715 men. Statistical analyses were performed in the two groups to test for association between these SNPs and femoral neck and lumbar spine areal BMD. We observed significant evidence of association (p<0.01) with one SNP each in men and women. Genotypes at these SNPs accounted for less than 1% of hip BMD variation in men, but 1.5% of spinal BMD in women. However, adjacent SNPs did not corroborate the association in either males or females. In conclusion, we found a modest association between an ADCY10 polymorphism and spinal areal BMD in premenopausal white women.
Keywords: bone mineral density, genetics, adenylate cyclase 10, single nucleotide polymorphism, association
Introduction
Bone mineral density (BMD) is a complex phenotype, which is influenced by both genetic and environmental factors [1]. Environmental factors, including nutrition and physical activity, influence the attainment of peak BMD; however, genetic factors account for as much as 80% of the variability in peak BMD attained in early adulthood [2, 3]. Results from several family-based studies suggest that multiple genes likely contribute to the observed variation in BMD in healthy subjects [4]. Furthermore, there is growing evidence that different genes influence BMD in men and women [4-6] and that there may be skeletal site-specific genes regulating spine and hip BMD [4, 6-8].
Absorptive hypercalciuria is a frequent finding in nephrolithiasis, and it is often associated with low BMD, particularly of the lumbar spine [9, 10]. A genome-wide linkage analysis of three kindreds with absorptive hypercalciuria mapped the disease locus to chromosome 1q23.3-24 [11]. This is the same chromosomal region linked to spinal BMD in healthy premenopausal American white sisters [7, 8] and linked to bone mass in the syntenic chromosomal region in mice [12-16]. Sequence variations in the adenylate cyclase 10 (ADCY10; also called soluble adenylate cyclase) gene located in this region were subsequently reported to be associated with hypercalciuria and low spinal bone density among patients [17]. Particularly, the increasing number of the minor variants was associated with lower lumbar spine BMD in a sample of hypercalciuric patients.
Adenylate cyclase synthesizes cyclic adenosine monophosphate, a second messenger involved in a number of biological processes. A soluble form, ADCY10, is expressed in many tissues, including bone (osteoblast) and kidney [17-19]. Although its role in bone is unclear, the association of genetic variation in ADCY10 with low spinal BMD in hypercalciuric patients [17] and its genomic location within a region linked to spinal BMD in healthy women [7, 8] suggest that this gene may contribute to the variation of BMD in the normal population. Thus, we investigated whether polymorphisms in ADCY10 are associated with normal variation in peak BMD in a sample of healthy men and premenopausal women.
Subjects and Methods
Sample
Families consisting of healthy siblings were recruited from the State of Indiana (Table 1) [6, 7]. Recruitment focused on families with two or more healthy sisters (n=766) or brothers (n=336). Families meeting both criteria (at least 2 healthy sisters and 2 healthy brothers) were also included (n=26). In addition, 633 parents of the sisters and 233 parents of the brothers participated in this study. Studies were performed at the General Clinical Research Center of Indiana University School of Medicine. Both the sister and brother studies were approved by the Institutional Review Board of Indiana University-Purdue University Indianapolis. Informed written consent was obtained from all subjects prior to their participation in the study.
Table 1. Sample Characteristics.
| Men | Women | |
|---|---|---|
| Number of Families | 336 | 766 |
| Number of Sibling Subjects | 715 | 1692 |
| Number of Genotyped Parents | 233 | 633 |
| Age, yearsa | 33.6 ± 10.9 | 33.1 ± 7.2 |
| Height, cma | 178.1 ± 6.9 | 165.5 ± 6.0 |
| Weight, kga | 87.2 ± 16.9 | 69.9 ± 16.5 |
| Lumbar Spine BMD, g/cm2a | 1.272 ± 0.163 | 1.273 ± 0.139 |
| Femoral Neck BMD, g/cm2a | 1.087 ± 0.165 | 1.020 ± 0.132 |
Mean ± SD
Health and lifestyle questionnaires were administered. The sample of sisters ranged in age from 20 to 51 years. Sisters were required to be within 10 years of each other in age. Women who had irregular menses, or a history of pregnancy or lactation within three months prior to enrollment were excluded. Women taking oral contraceptives were not excluded. The sample of brothers ranged in age from 18 to 61 years. There was no exclusion based on the difference in age between the brothers. Exclusion criteria for both sisters and brothers included a history of chronic disease, use of medications known to affect bone mass or metabolism, and an inability to measure BMD because of obesity.
Our linkage finding in chromosome 1q was in American white sisters, and the original findings by Reed et al. [17] were in Caucasian. Therefore, we limited the scope of this study to only include our American white samples.
BMD, Height and Weight Measurements
Areal BMD at the lumbar spine (vertebrae L2-L4) and femoral neck were measured by dual energy X-ray absorptiometry (DXA), using two DPX-L and one Prodigy instrument (GE Lunar Corp., Madison, Wisconsin). All three DXA instruments were cross-calibrated weekly using a step-wedge phantom. There was no detectable systematic difference between the three machines over the course of the study. The coefficient of variation on duplicate measurements after repositioning was 1.0% for femoral neck and 0.52% for lumbar spine. Siblings were measured on the same instrument. Height and weight were measured using a Harpenden stadiometer and a Scale-Tronix weighing scale, which were calibrated regularly.
SNP Genotyping
ADCY10 has 33 exons and spans 104 kb [17]. To ensure appropriate coverage of the entire gene, sixteen SNPs distributed across ADCY10 (including at least 3 kb upstream and downstream of the gene) were selected for genotyping. Most of these SNPs were selected using SNP Tagger [20] by setting the minor allele frequency in the CEPH Utah population to be at least 0.2 in the HapMap Genome Browser. Based on their potential functional importance, three exonic SNPs were also included. Genotyping of SNPs was performed using iPLEX genotyping assays on a MassARRAY® platform (Sequenom Inc., San Diego, CA). The SNPs were also genotyped in the available parental DNA to identify Mendelian inconsistencies in the SNP genotypes, using the program PedCheck [21]. Using one randomly selected individual in each family, each SNP was tested for a significant (p<0.001) deviation from Hardy-Weinberg equilibrium. The average rate for missing SNP genotypes was 3.6% with a range of 0.9-8.1%.
Statistical Analyses
In this sample of men and women, only age and weight are significant covariates of BMD [6, 7]. Therefore, regression residuals, representing age- and weight-adjusted BMD were computed separately in men and women and used in all subsequent analyses.
The presence of genetically distinct subgroups within a sample, termed population stratification, can increase the likelihood of a false positive association. This is particularly true when a sample of unrelated individuals is analyzed. Since genotypic data from 402 microsatellite markers were available from a previously completed 10 cM genome screen [6], we tested for population stratification in our sample using the program Structure [22]. A sample consisting of only one member from each of the genome screened American white families (n=982) was tested for stratification.
The program Haploview [23] was employed to examine the extent of linkage disequilibrium (LD) between the SNPs to ensure that the SNP density was sufficient to evaluate evidence of association. LD (r2 statistic) was evaluated using one randomly selected individual in each family. SNP Tagger [20] (http://www.broad.mit.edu/mpg/tagger/) was used to estimate how well the selected SNPs represented the genetic information contained in non-genotyped SNPs in the ADCY10 region. The extent to which the genotyped SNPs correlated with all HapMap SNPs in the ADCY10 region was evaluated for different levels of LD, with the r2 statistic.
A population-based association test was performed using a linear mixed model framework. SNP genotype was modeled as a fixed effect (taking on three levels corresponding to the observed genotypes), and family (sibship) as a random effect in the mixed model. Correlation between subjects in the same family was modeled by assuming an error covariance matrix exhibiting compound symmetry. The model was fitted using the MIXED procedure in the SAS statistical software (version 9.1). The mixed model association test employs data from all siblings with both genotype and phenotype. The proportion of BMD variation explained by each SNP was estimated by the R2 measure for the mixed model framework [24]. This measure is analogous to the common R2 measure in traditional ANOVA. Given the large size of our samples, we employed a stringent threshold of p<0.01 to ensure that we detected robust evidence of association and a clinically significant portion of the BMD variability.
Results
Analysis with the program Structure [22] indicated that there was no evidence of population stratification. The mean probability of classification into the group was 0.99. Mean age in women and men were similar, but men were heavier and taller (Table 1). Mean femoral neck BMD was higher in men than women although BMD at lumbar spine was similar.
Sixteen SNPs were genotyped throughout ADCY10, including upstream and downstream flanking regions (Fig. 1; Table 2). There was no deviation (p<0.001) from Hardy-Weinberg equilibrium for any of the SNPs. LD between adjacent SNPs was moderate (Fig. 2). However, the patterns of LD were consistent with those found in the HapMap sample of Utah residents with ancestry from northern and western Europe [25]. Further, the 16 SNPs genotyped in this study captured the genotypic information (with an r2 ≥ 0.5) contained in 78% of all ADCY10 SNPs genotyped in the HapMap Utah sample that have a minor allele frequency ≥ 0.05.
Figure 1.
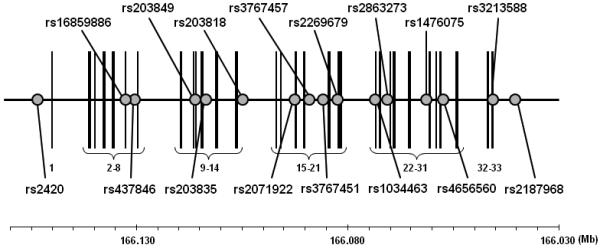
Structure of ADCY10 and location of the genotyped SNPs (NCBI Build 36.1). The circles indicate SNPs genotyped in this study. The vertical lines denote exons numbered from 1 to 33. The gene is depicted based on its orientation in the genome, and the chromosome location is shown in the baseline.
Table 2. SNP Association P-values.
| Men | Women | ||||||
|---|---|---|---|---|---|---|---|
| SNP | Positiona | Locationb | MAFc | Lumbar Spine P-value |
Femoral Neck P-value |
Lumbar Spine P-value |
Femoral Neck P-value |
| rs2420 | 166,153,126 | 5′ | 0.24 | 0.25 | 0.47 | 0.21 | 0.049 |
| rs16859886 | 166,132,495 | Exon7 | 0.08 | 0.51 | 0.48 | 0.00083 | 0.12 |
| rs437846 | 166,130,330 | Intron 7 | 0.21 | 0.10 | 0.023 | 0.25 | 0.16 |
| rs203849 | 166,116,038 | Exon 11 | 0.47 | 0.18 | 0.19 | 0.47 | 0.97 |
| rs203835 | 166,113,252 | Intron 12 | 0.31 | 0.42 | 0.10 | 0.27 | 0.70 |
| rs203818 | 166,104,598 | Intron 14 | 0.27 | 0.077 | 0.0039 | 0.86 | 0.18 |
| rs2071922 | 166,092,230 | Exon 17 | 0.11 | 0.094 | 0.52 | 0.64 | 0.58 |
| rs3767457 | 166,088,837 | Intron18 | 0.31 | 0.34 | 0.091 | 0.14 | 0.028 |
| rs3767451 | 166,085,641 | Intron 18 | 0.36 | 0.21 | 0.17 | 0.50 | 0.034 |
| rs2269679 | 166,082,234 | Intron 19 | 0.36 | 0.25 | 0.16 | 0.67 | 0.034 |
| rs1034463 | 166,073,271 | Intron 21 | 0.34 | 0.10 | 0.37 | 0.63 | 0.39 |
| rs2863273 | 166,070,520 | Intron 23 | 0.19 | 0.87 | 0.95 | 0.14 | 0.67 |
| rs1476075 | 166,061,030 | Intron 26 | 0.44 | 0.47 | 0.72 | 0.53 | 0.18 |
| rs4656560 | 166,057,242 | Intron 30 | 0.38 | 0.26 | 0.57 | 0.77 | 0.094 |
| rs3213588 | 166,045,467 | 3′ | 0.41 | 0.21 | 0.50 | 0.35 | 0.92 |
| rs2187968 | 166,040,062 | 3′ | 0.35 | 0.65 | 0.88 | 0.27 | 0.64 |
Chromosome positions are based on NCBI Human Genome Assembly v. 36.2.
SNP location within or near gene.
Minor allele frequency.
Figure 2.
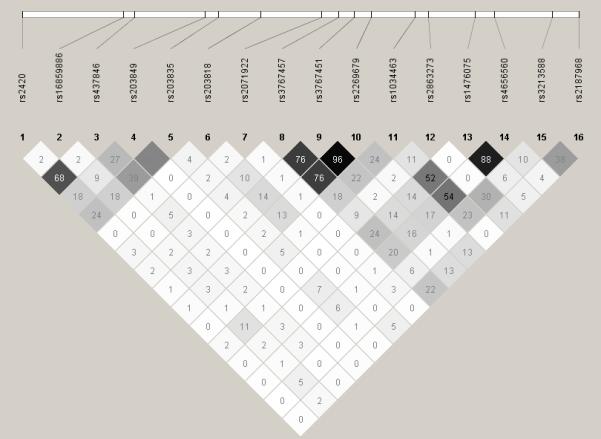
Linkage disequilibrium (LD) computed between the genotyped SNPs in ADCY10. The pair-wise r2 statistic is shown within each box (range 0-100; 0 indicating no LD; 100 indicating complete LD). The degree of shading represents the extent of LD. Darker shades indicate greater LD, lighter shades indicate less LD.
Among the 16 SNPs analyzed, only one SNP yielded positive evidence for association in each sex (p<0.01; Table 2). In the sister sample, rs16859886 was associated with spinal BMD (p=0.00083), with an estimated effect size (R2) of 1.5%. Women with at least one copy of the A allele at this SNP had significantly lower BMD than those with the GG genotype (Table 3). In the brother sample, rs203818 was associated with hip BMD (p=0.0039; R2<1%) and showed a trend for association with spinal BMD (p=0.077). Men homozygous for the AA genotype had higher hip BMD, compared to those with at least one G allele (Table 4).
Table 3. Effect of rs16859886 genotypes on spinal BMD in women.
| Genotype | N | Mean ± SD (g/cm2) | P-value (vs. GG) |
|---|---|---|---|
| AA | 8 | 1.195 ± 0.076 | 0.080 |
| AG | 233 | 1.250 ± 0.125 | 0.0050 |
| GG | 1377 | 1.276 ± 0.131 | N/A |
Table 4. Effect of rs203818 genotypes on hip BMD in men.
| Genotype | N | Mean ± SD (g/cm2) | P value (vs. AA) |
|---|---|---|---|
| AA | 350 | 1.111 ± 0.143 | N/A |
| AG | 275 | 1.071 ± 0.131 | 0.00028 |
| GG | 52 | 1.050 ± 0.129 | 0.0038 |
Discussion
We previously detected linkage of spinal BMD to chromosome 1q in a sample of premenopausal American white women [7, 8]. ADCY10 is an excellent positional candidate gene in the linked region due to its reported association with low BMD among hypercalciuric patients [17]. Based on these findings, we tested 16 sequence variations in ADCY10 for BMD in healthy American white men and women. Our study design had 80% power to detect an association accounting for 1.5% of the variation in BMD in women with an alpha of 0.01, and an association accounting for 2.1% of BMD variability in men.
Only one SNP met stringent significance level for association (p<0.01) in each sex. SNP rs203818 was associated with hip BMD in men, but the effect size was small (R2<1%). The significant association detected in women was with SNP rs16859886, the same nonsynonymous SNP in exon 7 (Thr234Met) that was associated with hypercalciuria and low BMD in the earlier study [17]. However, more polymorphic SNPs nearby (intron 7 and upstream of ADCY10) did not show any evidence of association. We estimated that the genotypes at SNP rs16859886 account for approximately 1.5% of the variation in lumbar spine BMD in women. This effect size is moderately clinically significant. These data suggest that functional genetic variations in ADCY10 might affect BMD although the function of ADCY10 in bone accrual is not clear. It is also possible that the variations in ADCY10 may cause mild calcium wasting in urine, which could lead to subsequent low BMD in the general population. Regardless, given the relatively modest effect size, the findings in this study do not likely explain our previous linkage between chromosome 1q and spinal BMD in premenopausal white sisters [7, 8]
It is interesting to speculate why variations in ADCY10 were significantly associated with spinal BMD in the earlier study [17] but explain a smaller proportion of the BMD variability in our sample of healthy women. The original association with spinal BMD was found in a sample of 45 hypercalciuric patients. This small sample size may have resulted in the overestimation of effect size in the earlier study. SNP rs16859886 is relatively uncommon in the European American population (MAF=0.08 in our sample; 0.11 in HapMap CEU sample). Therefore, it is also possible that this SNP is in LD with a relatively rare variant that might contribute to BMD variation in hypercalciuric patients, but accounts for only a small proportion of BMD variation in the general American white population.
This study had several strengths. There was no evidence of stratification in our sample. Further, we genotyped 16 SNPs distributed throughout the coding region of ADCY10 and also extending upstream and downstream of the gene. This allowed us to evaluate the evidence of association anywhere within the gene. All analyses were performed in men and women separately because of the sex-specific linkages detected for BMD. We also employed rigorous statistical criteria to limit the likelihood of a false positive result.
In summary, we have evaluated the evidence for association between 16 SNPs in ADCY10 and variation in areal BMD in both male and female study populations. We detected the most significant association between one nonsynonymous SNP and lumbar spine BMD variation in women, but the effect on BMD of genotype at this SNP was modest. We interpret these data to suggest that variation in ADCY10 may have a modest effect on peak spinal BMD in women. Results of the previous study [17] and the present study warrant additional replication in other populations.
Acknowledgements
We thank the siblings who participated in this study, as well as the study coordinators, without whom this work would not have been possible. This work was supported by National Institutes of Health grants P01 AG-18397 and M01 RR-00750. SNP genotyping by MALDI-TOF mass spectrometry used the facilities of the Center for Medical Genomics at Indiana University School of Medicine, which is supported in part by a grant from the Indiana Genomics Initiative (INGEN). INGEN is supported in part by the Lilly Endowment, Inc.
Footnotes
Conflict of interest statement
No disclosures.
References
- 1.Peacock M, Turner CH, Econs MJ, Foroud T. Genetics of osteoporosis. Endocr Rev. 2002;23:303–326. doi: 10.1210/edrv.23.3.0464. [DOI] [PubMed] [Google Scholar]
- 2.Hustmyer FG, Peacock M, Hui S, Johnston CC, Christian J. Bone mineral density in relation to polymorphism at the vitamin D receptor gene locus. J Clin Invest. 1994;94:2130–2134. doi: 10.1172/JCI117568. [DOI] [PMC free article] [PubMed] [Google Scholar]
- 3.Slemenda CW, Christian JC, Williams CJ, Norton JA, Johnston CC., Jr. Genetic determinants of bone mass in adult women: a reevaluation of the twin model and the potential importance of gene interaction on heritability estimates. J Bone Miner Res. 1991;6:561–567. doi: 10.1002/jbmr.5650060606. [DOI] [PubMed] [Google Scholar]
- 4.Ioannidis JP, Ng MY, Sham PC, Zintzaras E, Lewis CM, Deng HW, Econs MJ, Karasik D, Devoto M, Kammerer CM, Spector T, Andrew T, Cupples LA, Duncan EL, Foroud T, Kiel DP, Koller D, Langdahl B, Mitchell BD, Peacock M, Recker R, Shen H, Sol-Church K, Spotila LD, Uitterlinden AG, Wilson SG, Kung AW, Ralston SH. Meta-analysis of genome-wide scans provides evidence for sex- and site-specific regulation of bone mass. J Bone Miner Res. 2007;22:173–183. doi: 10.1359/jbmr.060806. [DOI] [PMC free article] [PubMed] [Google Scholar]
- 5.Huang QY, Ng MY, Cheung CL, Chan V, Sham PC, Kung AW. Identification of two sex-specific quantitative trait loci in chromosome 11q for hip bone mineral density in Chinese. Hum Hered. 2006;61:237–243. doi: 10.1159/000095216. [DOI] [PubMed] [Google Scholar]
- 6.Peacock M, Koller DL, Fishburn T, Krishnan S, Lai D, Hui S, Johnston CC, Foroud T, Econs MJ. Sex-specific and non-sex-specific quantitative trait loci contribute to normal variation in bone mineral density in men. J Clin Endocrinol Metab. 2005;90:3060–3066. doi: 10.1210/jc.2004-2143. [DOI] [PubMed] [Google Scholar]
- 7.Econs MJ, Koller DL, Hui SL, Fishburn T, Conneally PM, Johnston CC, Jr., Peacock M, Foroud TM. Confirmation of linkage to chromosome 1q for peak vertebral bone mineral density in premenopausal white women. Am J Hum Genet. 2004;74:223–228. doi: 10.1086/381401. [DOI] [PMC free article] [PubMed] [Google Scholar]
- 8.Koller DL, Econs MJ, Morin PA, Christian JC, Hui SL, Parry P, Curran ME, Rodriguez LA, Conneally PM, Joslyn G, Peacock M, Johnston CC, Foroud T. Genome screen for QTLs contributing to normal variation in bone mineral density and osteoporosis. J Clin Endocrinol Metab. 2000;85:3116–3120. doi: 10.1210/jcem.85.9.6778. [DOI] [PubMed] [Google Scholar]
- 9.Bataille P, Achard JM, Fournier A, Boudailliez B, Westeel PF, el Esper N, Bergot C, Jans I, Lalau JD, Petit J, et al. Diet, vitamin D and vertebral mineral density in hypercalciuric calcium stone formers. Kidney Int. 1991;39:1193–1205. doi: 10.1038/ki.1991.151. [DOI] [PubMed] [Google Scholar]
- 10.Pietschmann F, Breslau NA, Pak CY. Reduced vertebral bone density in hypercalciuric nephrolithiasis. J Bone Miner Res. 1992;7:1383–1388. doi: 10.1002/jbmr.5650071205. [DOI] [PubMed] [Google Scholar]
- 11.Reed BY, Heller HJ, Gitomer WL, Pak CYC. Mapping a gene defect in absorptive hypercalciuria to chromosome 1q23.3-q24. J Clin Endocrinol Metab. 1999;84:3907–3913. doi: 10.1210/jcem.84.11.6155. [DOI] [PubMed] [Google Scholar]
- 12.Beamer WG, Shultz KL, Churchill GA, Frankel WN, Baylink DJ, Rosen CJ, Donahue LR. Quantitative trait loci for bone density in C57BL/6J and CAST/EiJ inbred mice. Mamm Genome. 1999;10:1043–1049. doi: 10.1007/s003359901159. [DOI] [PubMed] [Google Scholar]
- 13.Beamer WG, Shultz KL, Donahue LR, Churchill GA, Sen S, Wergedal JR, Baylink DJ, Rosen CJ. Quantitative trait loci for femoral and lumbar vertebral bone mineral density in C57BL/6J and C3H/HeJ inbred strains of mice. J Bone Miner Res. 2001;16:1195–1206. doi: 10.1359/jbmr.2001.16.7.1195. [DOI] [PubMed] [Google Scholar]
- 14.Klein OF, Carlos AS, Vartanian KA, Chambers VK, Turner EJ, Phillips TJ, Belknap JK, Orwoll ES. Confirmation and fine mapping of chromosomal regions influencing peak bone mass in mice. J Bone Miner Res. 2001;16:1953–1961. doi: 10.1359/jbmr.2001.16.11.1953. [DOI] [PubMed] [Google Scholar]
- 15.Koller DL, Schriefer J, Sun Q, Shultz KL, Donahue LR, Rosen CJ, Foroud T, Beamer WG, Turner CH. Genetic effects for femoral biomechanics, structure, and density in C57BL/6J and C3H/HeJ inbred mouse strains. J Bone Miner Res. 2003;18:1758–1765. doi: 10.1359/jbmr.2003.18.10.1758. [DOI] [PubMed] [Google Scholar]
- 16.Orwoll ES, Belknap JK, Klein RF. Gender specificity in the genetic determinants of peak bone mass. J Bone Miner Res. 2001;16:1962–1971. doi: 10.1359/jbmr.2001.16.11.1962. [DOI] [PubMed] [Google Scholar]
- 17.Reed BY, Gitomer WL, Heller HJ, Hsu MC, Lemke M, Padalino P, Pak CYC. Identification and characterization of a gene with base substitutions associated with the absorptive hypercalciuria phenotype and low spinal bone density. J Clin Endocrinol Metab. 2002;87:1476–1485. doi: 10.1210/jcem.87.4.8300. [DOI] [PubMed] [Google Scholar]
- 18.Chen Y, Cann MJ, Litvin TN, Iourgenko V, Sinclair ML, Levin LR, Buck J. Soluble adenylyl cyclase as an evolutionarily conserved bicarbonate sensor. Science. 2000;289:625–628. doi: 10.1126/science.289.5479.625. [DOI] [PubMed] [Google Scholar]
- 19.Geng W, Wang Z, Zhang J, Reed BY, Pak CY, Moe OW. Cloning and characterization of the human soluble adenylyl cyclase. Am J Physiol Cell Physiol. 2005;288:C1305–1316. doi: 10.1152/ajpcell.00584.2004. [DOI] [PubMed] [Google Scholar]
- 20.de Bakker PIW, Yelensky R, Pe’er I, Gabriel SB, Daly MJ, Altshuler D. Efficiency and power in genetic association studies. Nat Genet. 2005;37:1217–1223. doi: 10.1038/ng1669. [DOI] [PubMed] [Google Scholar]
- 21.O’Connell JR, Weeks DE. PedCheck: a program for identification of genotype incompatibilities in linkage analysis. Am J Hum Genet. 1998;63:259–266. doi: 10.1086/301904. [DOI] [PMC free article] [PubMed] [Google Scholar]
- 22.Pritchard JK, Stephens M, Rosenberg NA, Donnelly P. Association mapping in structured populations. Am J Hum Genet. 2000;67:170–181. doi: 10.1086/302959. [DOI] [PMC free article] [PubMed] [Google Scholar]
- 23.Barrett JC, Fry B, Maller J, Daly MJ. Haploview: analysis and visualization of LD and haplotype maps. Bioinformatics. 2005;21:263–265. doi: 10.1093/bioinformatics/bth457. [DOI] [PubMed] [Google Scholar]
- 24.Xu R. Measuring explained variation in linear mixed effects models. Stat Med. 2003;22:3527–3541. doi: 10.1002/sim.1572. [DOI] [PubMed] [Google Scholar]
- 25.The_International_HapMap_Consortium The International HapMap Project. Nature. 2003;426:789–796. doi: 10.1038/nature02168. [DOI] [PubMed] [Google Scholar]