

Abstract
Neuronal Ca2+ sensors (NCS) are high affinity Ca2+-binding proteins critical for regulating a vast range of physiological processes. Guanylate cyclase-activating proteins (GCAPs) are members of the NCS family responsible for activating retinal guanylate cyclases (GCs) at low Ca2+ concentrations, triggering synthesis of cGMP and recovery of photoreceptor cells to the dark-adapted state. Here we use amide hydrogen-deuterium exchange and radiolytic labeling, and molecular dynamics simulations to study conformational changes induced by Ca2+ and modulated by the N-terminal myristoyl group. Our data on the conformational dynamics of GCAP1 in solution suggest that Ca2+ stabilizes the protein but induces relatively small changes in the domain structure; however, loss of Ca+2 mediates a significant global relaxation and movement of N- and C-terminal domains. This model and the previously described “calcium-myristoyl switch” proposed for recoverin indicate significant diversity in conformational changes among these highly homologous NCS proteins with distinct functions.
Keywords: Guanylate cyclase, guanylate cyclase-activating protein, Ca2+-binding protein, signal transduction, mass spectrometry, footprinting, amide hydrogen-deuterium exchange, molecular dynamics, cGMP
INTRODUCTION
In neurons, cytoplasmic Ca2+ levels regulate a variety of events such as membrane traffic, ion channel activity and even cell survival. Neuronal Ca2+ sensor (NCS) proteins are high affinity Ca2+-binding macromolecules that undergo conformational changes resulting from Ca2+ binding, and selectively respond to Ca2+ mediated signals (Burgoyne et al., 2004). Members of class E neuronal Ca2+ sensor proteins are designated as guanylate cyclase-activating proteins (GCAPs) and are expressed in photoreceptors in the retina. (Coleman et al., 2004; Haeseleer et al., 2002; Palczewski et al., 2000; Stephen et al., 2007) and testis (Jankowska et al., 2007). Immunocytochemical analysis suggested that GCAP1 is more abundant in cones than in rods (Otto-Bruc et al., 1997b).
GCAP1 plays a crucial role in dark adaptation following illumination of photoreceptor cells under the control of intracellular cGMP and Ca2+ levels (Palczewski, 2006; Polans et al., 1996). The initial high level of cGMP is restored through efficient catalysis of GTP to cGMP by guanylate cyclase 1 (GC1), which is regulated in turn by GCAP1 (Gorczyca et al., 1995; Palczewski et al., 1994). The importance of GCAP1 in phototransduction is underlined by the fact that point mutations are linked to autosomal-dominant cone, cone-rod, and macular dystrophies that ultimately lead to retinal degeneration (Dizhoor et al., 1998; Jiang et al., 2005; Kitiratschky et al., 2009; Michaelides et al., 2006; Newbold, 2001; Nishiguchi et al., 2004; Sokal et al., 2005 ; Wilkie et al., 2001).
Like many proteins from the Ca2+ sensor family, GCAP1 (Mr 22,917) has four EF hand motifs, of which only EF hands 2, 3 and 4 bind Ca2+, and a posttranslationally myristoylated N-terminus (Palczewski et al., 1994). Fig. 1 displays the crystal structure of Ca2+-bound myristoylated chicken GCAP1 (Stephen et al., 2007). The structure shows the myristoyl group buried inside the core of the protein (Stephen et al., 2007), providing the first direct evidence for a reaction mechanism different from the “calcium-myristoyl switch” proposed for recoverin (Ames et al., 1997). This result was recently corroborated by another study involving 1H–15N NMR experiments that also suggested enclosure of the myristoyl group within the GCAP1 interior (Lim et al., 2009). There is yet no available structure of GCAP1 in the Ca2+ free form, i.e., the form required to activate GC1-mediated conversion of GTP to cGMP.
Figure 1. Cartoon representation of GCAP1.
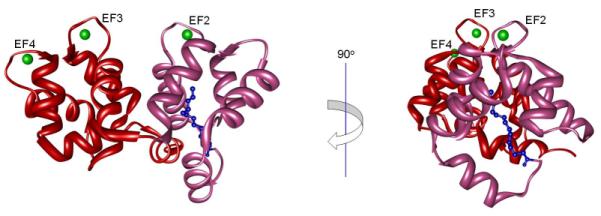
The N-terminal region (2R2I.pdb (Stephen et al., 2007)) is colored hot pink and the C-terminal region is red. The myristoyl group is shown as blue balls and sticks and Ca2+ ions are pictured as green spheres. A view rotated 90° is also provided to facilitate location of the myristoyl group.
Here, we used amide hydrogen-deuterium exchange and radiolytic labeling, both coupled to mass spectrometry, and molecular dynamics simulations of GCAP1 and myr-GCAP1 in the Ca2+-free and Ca2+-bound forms to study conformational changes induced by the presence of the myristoyl group and Ca2+ to better understand the activation process mediated by GCAP1. We found that in presence of the myristoyl group and Ca2+ GCAP1 is in a compact conformation, including rigid conformation of the EF hand 4. Conversely, all EF hand regions were found to be disordered in the absence of Ca2+.
RESULTS
Total deuterium uptake by GCAP1 and myr-GCAP1
Fig. 2 shows the total deuterium uptake of intact GCAP1, both in the presence of 25 mM Ca2+ (Ca2+-bound form - panel A) and in the presence of 25 mM EDTA (Ca2+-free form - panel B). Overall, all experiments showed a fast phase where at least half of all amide protons exchange within one minute while the remainder of the exchange was 100-fold slower. The rate constant of deuterium incorporation for the fast uptake rate (i.e., >1 min−1) was 3.5 min−1 for the Ca2+-bound form and 6 min−1 in the Ca2+-free form of GCAP1. After 5 h incubation in D2O, both the Ca2+-free and Ca2+-bound forms exchanged only ~90 Da which represents less than half of the theoretical maximum. This suggests that both forms of the protein still have globular structures with well protected amide hydrogen atoms since only ~50% of the maximal number of backbone positions participated in the exchange process for both forms. A global view of the intact protein deuterium uptake profile suggests that deuterium uptake followed an EX1 limiting regimen (Busenlehner and Armstrong, 2005). This mechanism predominates in cases where the dynamics of protein folding and unfolding rather than amide hydrogen-deuterium exchange is the rate-limiting step. In these situations, several protein populations consisting of distinct conformers are present at any given time. This type of mechanism is observable in the case of the Ca2+-free form of GCAP1 where the rate of deuterium incorporation had a higher observed error that of the Ca2+-bound form. Higher error bars in this case show that at a given incubation time, for example at 10 sec, GCAP1 picks up a maximum of ~65 deuteriums in a more open form and up to ~35 in a more compact form. This difference suggests that several unique conformations, denoted by the availability of variable numbers of exchangeable sites, exist at a given time. These populations are clearly distinguishable in the case of the Ca2+-free form (data not shown). Presence of the myristoyl group changed the deuterium uptake profile of myr-GCAP1 when compared to the unmyristoylated form (Figs. 2A-D). The maximum number of deuterium exchanging sites measured after 5 h of the deuteration reaction was reduced in Ca2+-bound myr-GCAP1 (Figs. 2A and 2C) while it was increased for the Ca+2-free myr-GCAP1 form (Figs. 2B and 2D). A smaller number of deuterium atoms exchanged suggests a more compact overall structure with more stable secondary structural elements.
Figure 2. Deuterium uptake of intact GCAP1 and myr-GCAP1 in their Ca2+-bound and Ca2+-free states.
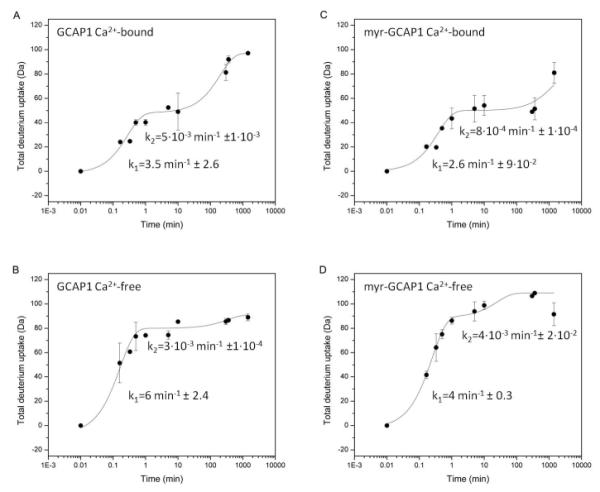
Panel A shows total deuterium uptake of intact GCAP1 at a high (25 mM) Ca2+ concentration (Ca2+-bound form) and panel B shows deuterium uptake of intact GCAP1 in the Ca2+-free state, i.e., 25 mM EDTA. Panels C and D show deuterium uptake of intact myr-GCAP1 in the Ca2+-bound and Ca2+-free states, respectively. Deuterium uptake experiments were performed as described in “Experimental procedures”. Error bars represent standard deviation between experimental repeats.
Deuterium uptake by peptic fragments
To further study the conformational dynamics of GCAP1 and its modulation by Ca2+ and myristoylation, the uptake of deuterium by specific peptic fragments was analyzed by mass spectrometry. Sequence coverage was found to be >95% in all four experimental setups, i.e., Ca2+-free and Ca2+-bound forms of either GCAP1 or myr-GCAP1 (Supplementary Material, Fig. S1). The general cleavage pattern was similar among the four groups but more overlapping peptides were found in the Ca2+-free forms. Although the sequence coverage was >95% in the non-deuterated samples, several peptides were not included in the analyses due to either their unsatisfactory resolution or overlap with other fragments. Peptides used in the four experimental setups are listed together with their sequences, charged state utilized for extraction of incorporated deuterium, and values for specific parameters obtained after fitting the experimental uptake profile to equation 2 (Supplementary Material, Tables S1-S4). The parameters A1 and A2 from equation 2 were used to calculate the percent of deuterium incorporation and are represented as described in “Deuterium exchange analysis and representation” (Supplementary Material, Fig. S2). Panels A and C of Fig. 3 show Ca2+-bound GCAP1 and myr-GCAP1, respectively, whereas panels B and D indicate Ca2+-free GCAP1 and myr-GCAP1. The amount of deuterium uptake was visibly less (Fig. 2C) in the case of myr-GCAP1-Ca2+-bound as compared with the other conformations (Figs. 2A, 2B, and 2D). With Ca2+ bound, the regions encompassing EF hands 2 and 3 of GCAP1- and EF hands 2, 3, and 4 of myr-GCAP1- had limited exchange (Figs. 3A and 3C). The stable Ca2+-free forms (Figs. 3B and 3D) showed increased exchange indicating increased flexibility for these motifs except for EF hand 3 of the GCAP1 Ca2+-free form. The peptide 117RAINRCNE, found in both Ca2+-free forms of GCAP1, and myr-GCAP1, exhibits the greatest exchange (Figs. 3B and 3D, in red).
Figure 3. Amide hydrogen-deuterium exchange with fragments resulting from pepsin cleavage and modified amino acids from footprinting experiments.
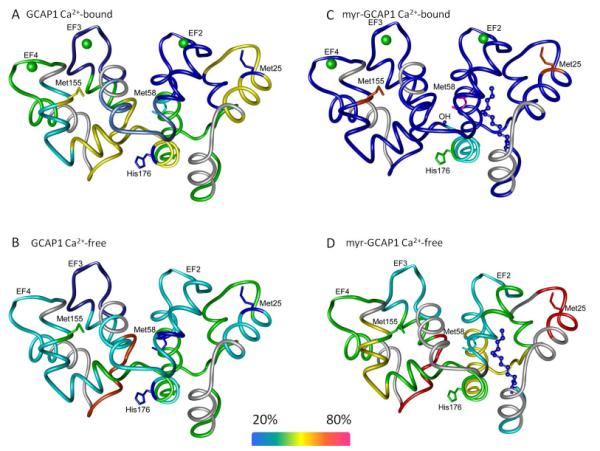
Amide hydrogen-deuterium exchange of the peptide fragments is represented as described in: “Representation of amide hydrogen-deuterium exchange results”. In short, color coding was performed by calculating the percentage of actual uptake from the theoretical maximum for each peptide. Deuterium uptake experiments were performed as described in “Experimental procedures”. Residues found modified by footprinting experiments are shown as sticks whereas the color denotes percent modification. Labels for residues present in the X-ray structure are labeled except Pro191 which is not present in the X-ray structure (Stephen et al., 2007).
Radiolytic footprinting
The sequence coverage with trypsin used as the protease (Supplementary Material, S1) was found to be ~90% and footprinting data was collected for five different peptide fragments (Supplementary Material Fig. S3 and Table S5). The unmodified fraction of each considered fragment was plotted as a function of the exposure time (ms) and represents the average of two measurements. Footprinting analysis of these fragments shows that less modification of these residues (Supplementary Material Fig. S3A, amino acid in red) occurred in the Ca2+-free form of GCAP1 ( ). A difference in modification was also observed when comparing GCAP1 and myr-GCAP1 (Supplementary Material Figs. 3A, 3B, 3D). Modifications of Met25 and Met58 residues were influenced by the presence of the myristoyl group located in their vicinity (distances ranged from 5 to 10 Å). For Met155, there was a cumulative effect of the myristoyl group and Ca2+ ions (Supplementary Material Fig. S3C). The distance between Met155 and the myristoyl group is ~23 Å, which could explain the decreased influence of this group on this region of the macromolecule. The extent of unmodified fraction for all peptides examined by radiolysis was found to be in the range of 0.870 to 0.999 except for peptide 54YVEQMFETFDFNK of the Ca2+-bound form of myr-GCAP1, where the unmodified fraction was ~0.6 after 10 ms of exposure. Close inspection of the X-ray structure of myr-GCAP1 Ca2+-bound revealed that Met58 is sequestered in the hydrophobic core of the protein and not exposed to bulk solvent; thus its high reactivity compared to residues Met25, His176, and Met155, which are exposed to solvent appears counterintuitive. The high modification rate of Met58 can be explained by the presence of a crystallographic water in the X-ray structure within ~3.5 Å of the side chain of Met58. Such ordered waters can be activated by direct interactions with x-rays and can effectively label adjacent and reactive side-chains. In this regard, we recently demonstrated the reactivity of such crystallographically conserved water molecules buried inside the hydrophobic core of proteins and have demonstrated their labeling properties within the transmembrane region of rhodopsin (Angel et al., 2009). This ordered water molecule and Met58 are located at the interface between the N- and C- terminal domains (Fig. 3C – blue sphere). The reduction in reactivity of Met58 for the three other conformational states of GCAP1 suggests that the relationship and proximity between this water molecule and Met58 is altered for these other states of GCAP1 and that a conformational alteration in the relationship of the N- and C-terminal domains occurs in response to Ca2+ release.
GCAP1 and myr-GCAP1 dynamics at the C-terminus region
The C-terminal peptide was found disordered in the X-ray structure, hence it was not modeled (Stephen et al., 2007). Footprinting of the peptide N187PHAPEEAEEAAQ; however, provided data on the solvent exposure of Pro191 in the case of myr-GCAP1. Fig. 4A indicates that Pro191 is more exposed in the presence of the myristoyl group, and that its modification rate is minimally affected by the presence of Ca2+. The deuterium exchange experiments offer a cumulative dynamic view of the last 16 amino acids where the myr-GCAP1 Ca2+-bound form was found to exchange the least, and thus possibly be involved in secondary structure.
Figure 4. Dynamics of the C-terminus region.
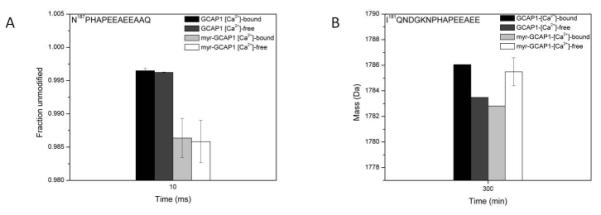
Panel A shows the unmodified fraction of the region 187NPHAPEEAEEAAQ whereas panel B indicates the deuterium uptake profile of the region 181IQNDGKNPHAPEEAEE. The experimental setup (i.e., Ca2+-free and Ca2+-bound states of GCAP1 and myr-GCAP1) was the same as described in Fig. 3.
Molecular dynamics simulations
Superposition of the conformer of GCAP1-Ca2+-bound after 5 ns of molecular dynamics simulation on the X-ray structure of the myristoylated form shows that the N-terminus region adopts a different conformation in the absence of the myristoyl group (see Gly2-Glu16, Supplementary Material, Fig. S4A). Without the myristoyl group, the N-terminus becomes more flexible. When the GCAP1-Ca2+-free form is compared with the X-ray structure, a high deviation is clear in the region encompassing Thr14 to Pro48. The EF hands are clearly affected, with EF1 and 4 being the most disturbed (Supplementary Material, Fig. S4B). The RMSD of the α-carbons determined over the 5 ns simulation time also showed that the myr-GCAP1 in the Ca2+-bound form had the smallest deviation from the X-ray structure while the other conformations exhibited larger deviations from the initial structure (Supplementary Material, Fig. S4E).
DISCUSSION
The Ca2+-bound myr-GCAP1 (myr-Gly2 to Gly185) X-ray structure exhibits a valuable snapshot of this conformation of the macromolecule (Stephen et al., 2007). Using amide hydrogen-deuterium exchange and radiolytic footprinting coupled to mass spectrometry and molecular dynamics simulations, we now provide a study of the dynamics of GCAP1 obtained in four different forms including the above crystallographic form: Ca2+-bound and Ca2+-free states of both GCAP1 and myr-GCAP1 (Figs. 1 and 3). Comparisons were achieved by changing one parameter at a time; first, the presence and absence of Ca2+, and second, the presence and absence of the myristoyl group. We chose to express GCAP1 in an insect cell based system because of its more suitable folding machinery as compared with a bacterial expression system (Sokal et al., 2000). The isolated GCAP1 molecule was active and highly purified as assessed by SDS-PAGE and MS analyses. Moreover, its myristoylated counterpart was found to be homogenous in terms of this posttranslational modification.
The crystal structure reveals a molecule composed of 74% α-helices, 22% loops, and 4% β-sheets. Amide hydrogen–deuterium exchange is significantly reduced when amide hydrogens participate in hydrogen bonding networks such as those found in secondary structural elements (Busenlehner and Armstrong, 2005). Amino acid residues found in unstructured loops (~ 40 amino acids) exchange rapidly if exposed to solvent. Our experiments revealed that the Ca2+-bound form of myr-GCAP1 exchanged deuterium the least among all four conformational states. This was suggested by the deuterium uptake profile of the intact protein (Fig. 2C) and was further corroborated by the results of experiments that quantified deuterium uptake of the peptic fragments (Fig. 3C).
Experimental evidence of conformational changes in GCAP1 in response to Ca2+ concentration
Footprinting experiments revealed that in the case of Ca2+-bound myr-GCAP1 radiolytic modification of bulk solvent inaccessible Met58 occurs due to the presence of an ordered water molecule within 3.5 Å. This water molecule is not part of bulk solvent but seems rather encapsulated within the core of Ca2+-bound myr-GCAP1 (Fig. 3C). Met58 is only modestly reactive for the other states of GCAP1 examined. This further supports the contention that the Ca2+-bound form of myr-GCAP1 is more compact and that water molecules trapped inside the hydrophobic core of the protein are tightly bound. Molecular dynamic simulations showed that the Ca2+-bound form of GCAP1 had higher root mean square deviation (RMSD) values for the N-terminal region as compared to the X-ray structure of the Ca2+-bound myristoylated form. For myr-GCAP1, the N-terminus would be expected to have reduced dynamics because of the restricted degrees of freedom as compared with the unmyristoylated form. The Ca2+-free form of GCAP1 had large RMSD values in the EF4 hand region. This finding is also consistent with the amide hydrogen-deuterium exchange experiments that show high uptake in the EF4 region of unmyristoylated GCAP1 (Figs. 3A-B). The flanking α-helix structures of EF hands 2 and 3 comprise the central region of the protein whereas the flanking α-helix of the EF 4 hand interfaces with the solvent, thus being more prone to amide hydrogen-deuterium exchange. Our study suggests that the conformational changes that occur in the four experimental groups can be summarized as follows. When the myristoyl group and Ca2+ are both present GCAP1 is more compact. In the absence of Ca2+the EF hands become more disordered. Finally, EF hand 4 exists in a more stable state only in the Ca2+-bound form of myr-GCAP1 (Figs. 3C and 5). Our results (Fig. 3) are in agreement with the recent differential scanning calorimetry study that shows that the binding of Ca2+ to GCAP1’s EF hands increases stability to a much higher extent than the presence of the myristoyl group alone (Lim et al., 2009).
Figure 5. Regulation of neuronal Ca2+-binding proteins.
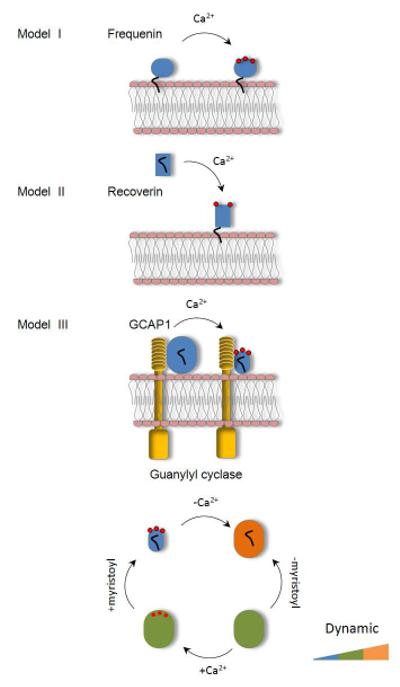
Model I illustrates the interaction of frequenin with phospholipid membranes. Model II illustrates interaction of recoverin with membranes showing the “calcium-myristoyl switch”, and model III illustrates the mode of action of GCAP1 with GC. Conformational changes that occur in GCAP1 following myristoylation and addition of Ca2+ are described by using the following color coding scheme based on deuterium uptake manifested by the intact protein (Fig. 3): blue - 50 Da, green - 90 Da, and orange - 110 Da.
Unifying models of conformational changes in GCAP1 and GC regulation
The structure of the activating Ca2+-free form of a GCAP1 is not yet available. However, our data on the conformational dynamics of GCAP1 in solution suggest that the conformational change induced by Ca2+ release involves a relatively small change in domain structure but may involve a substantial relaxation of both the N-terminal domain and the C-terminal domain. Furthermore, tryptophan fluorescence experiments with GCAP1 support a conformational change involving reorientation of the N- and C- terminal domains because Trp93, located in the central helix, is exposed only under low Ca2+ conditions (Sokal et al., 2000). Experiments with GCAP1 chimeras suggest that the N- and C-terminal helices of GCAP1 are the most important for GC1 binding (Sokal et al., 2000). The structure of myristoylated chicken GCAP1 shows these regions in close proximity to each other and clustered with the myristoyl group in the Ca2+-bound, inhibitory conformation of this protein (Fig. 1). Any rotation of the N- and C-terminal domains relative to each other would necessarily pull the terminal helices apart. We propose that this separation of the N- and C-terminal helices in GCAP1 is crucial to induce the activated conformation of GC1 (Stephen et al., 2008). This earlier proposal is now further supported by footprinting and classical amide hydrogen-deuterium exchange experiments. Our model represents an alternative to the previously described reaction mechanism termed the “calcium-myristoyl switch” proposed for recoverin (Ames et al., 1997) (Fig. 5; Models II), and Ca2+ independent interaction of frequenin with the membranes or target proteins (Fig. 5; Models I). Thus, despite a significant sequence and structural similarity, particularly among class E neuronal Ca2+ sensor proteins, their mechanisms of conformational transformation could be highly distinct and specific to the physiological function (Fig. 5; Models I, II, and III).
EXPERIMENTAL PROCEDURES
Myristoylation of GCAP1
The complete myristoylation reaction mixture contained 100 μM NMT, 50 μM myristoyl Coenzyme A (Avanti Polar Lipids, Alabaster, AL) and 25 μM GCAP (prepared as described in the supplement) in 50 mM HEPES, 90 mM KCl, 10 mM NaCl, pH 7.4. NMT prepared as described in the supplement was combined with myristoyl Coenzyme A in a glass test tube and incubated for 10 min at 4 °C prior to addition of GCAP1. We found it crucial that all the myristoyl Coenzyme A had bound to the NMT before GCAP1 was added (Supplementary Material, S5C). Otherwise, myristoyl groups bind to the hydrophobic surfaces of GCAP1 resulting in reduced substrate availability and difficulty in separating GCAP1 from excess substrate. After addition of GCAP1, myristoylation was carried out for 1 h at 4 °C. The NMT (6×His-tag fusion) and the excess substrate (bound to NMT) were removed by passing the reaction mixture through a column packed with 2.15 ml of TALON resin per 10 mg of NMT and equilibrated with 50 mM HEPES, pH 7.4, 90 mM KCl, 10 mM NaCl. Myristoylated GCAP1 was aliquoted, frozen in liquid nitrogen, and stored at −80 °C. The activity of myr-GCAP1 was assayed in the presence of high and low [Ca2+]. Presence of the myristoyl group was initially confirmed by mass spectrometry and deconvolution of the final mass from the charged state was achieved as described for GCAP1. Because this method only probes for a mass increase of 210 Da, i.e., the mass of the myristoyl modification, we also performed MS/MS analysis of N-terminal fragments resulting from proteolysis of myr-GCAP1 with trypsin and pepsin, respectively (Supplementary Material, Fig. S7), to ascertain that modification had indeed occurred at Gly2. Ions resulting after collision-induced dissociation of the myristoyl group also were compared with those described in the literature (Hoffman and Kast, 2006). Stock solutions of purified myr-GCAP1 were used to test GC-stimulating activity (Fig. 6D) with an assay that measures cGMP production as a function of free Ca2+ concentration (Otto-Bruc et al., 1997a). Charged states, i.e. (myr-GCAP1+12H)12+ to (myr-GCAP1+12H)28+, were used to calculate the deconvoluted mass (Fig. 6F).
Figure 6. Activity and purity of GCAP1 and myr-GCAP1.
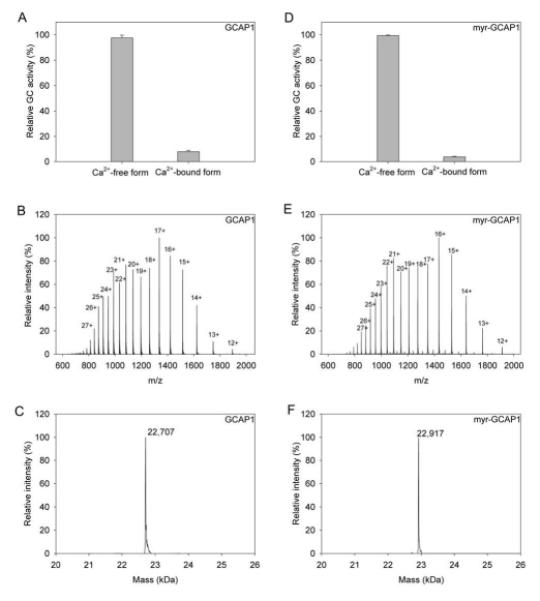
Panels A and D illustrate the activities of GCAP1 and myr-GCAP1, respectively, as a function of Ca2+ concentration. Panels B and E show the intact protein spectrum whereas panels C and F show the deconvoluted mass of intact GCAP1 and myr-GCAP1, respectively. The GC assays were performed as described in “Experimental procedures”.
Mass spectrometry of intact GCAP1
D2O used for the amide hydrogen-deuterium exchange experiments (Norell, Landisvill, NJ) was 99.9% pure. 10 μg of intact GCAP1 in a buffer solution made with H2O (50 mM HEPES, pH 7.4, 90 mM KCl, 10 mM NaCl) was diluted 10-times with D2O, and incubated for various durations in the presence of either 25 mM Ca2+ or 25 mM EDTA. After the deuteration reaction, the protein solution was loaded on a Mercury MS column (Phenomenex, Torrance, CA) equilibrated for 20 min with 2% isopropanol/0.1% HCOOH (v/v). Loading was performed with an auto-sampler cooled to 4 °C (Agilent Technologies 1100 Series). After 4 min of washing with 2% isopropanol/0.1% HCOOH, the deuterated protein was eluted by a linear gradient ranging from 2% to 98% isopropanol in 0.1% HCOOH over 14 min. The eluate from the HPLC column was directed into a Finnigan LXQ (Thermo Scientific, Waltham, MA) mass spectrometer equipped with an electrospray ionization source. Spectra of multiply charged GCAP1 species were deconvoluted with Promass software (Thermo Scientific). Experiments were not started until 4 °C temperature was achieved. The column was immersed in ice throughout the experiment.
Pepsin digests of GCAP1 and myr-GCAP1
In a typical experiment, 5 μg of GCAP1 in 25 mM NH4HCO3, pH 7.4, made with H2O were diluted 10-times with D2O and incubated for 10, 20, 30, 60, 300, 600, 1,200, 1,800, and 18,000 s at 4 °C. The amide hydrogen-deuterium exchange reaction was stopped by lowering the temperature to 0 °C and adding 10 μl of 20 mM NH4HCO3/HCOOH (1/1, v/v) to the reaction mixture. Lowering both the temperature and pH was done to minimize deuterium back exchange. Next, digestion of GCAP1 was initiated by the addition of pepsin (Worthington, Lakewood, NJ) (pepsin : GCAP1, 1:1 w/w) dissolved in H2O and incubated for 10 min on ice. After 5 min incubation with pepsin, 100 μl of the peptic digest was loaded on a Mercury MS column (Phenomenex, Torrance, CA) equilibrated for 20 min with 2% isopropanol/0.1% HCOOH using an auto-sampler cooled to 4 °C. The column was attached to an Agilent Technologies 1100 Series HPLC system. After sample loading, the column was washed for 4 min with 2% isopropanol/0.1% HCOOH (v/v). To minimize deuterium back-exchange, the column was immersed in ice and buffers were cooled to 4 °C with the aid of a Peltier heating/cooling module. Peptides were eluted within 14 min by a linear gradient of 2% - 98% isopropanol in 0.1% HCOOH (v/v).
Trypsin digest of GCAP1
Trypsin (Promega) was dissolved to a final concentration of 0.1 μg/μl in 50 mM NH4HCO3, pH 8.0. The enzyme substrate ratio was set at 1:10 and the reaction was carried out for 24 h in a water bath at 37 °C.
Amide hydrogen-deuterium exchange mass spectrometry
For this procedure, the HPLC was coupled to a Finnigan LXQ (Thermo Scientific, Waltham, MA) mass spectrometer with an ESI source. Eluted peptides (Fig. 7A) were identified by the fragmentation patterns of the precursor ions produced by collision-induced dissociation (Figs. 7B-C) using a Mascot database search software (Matrix Science). The general mass spectrometric conditions were a temperature of 300 °C and the normalized collision energy was 35% for MS/MS. The ion selection threshold was 500 counts for MS/MS.
Figure 7. Probing deuterium uptake by GCAP1 with electrospray ionization mass spectrometry.
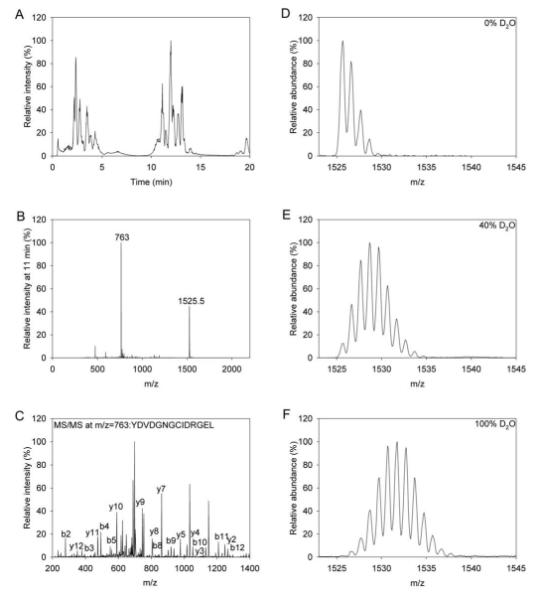
Panel A displays a typical elution profile of GCAP1 fragments generated following pepsin digestion in the presence of EDTA. Panel B shows the most abundant singly (m/z=1525.5) and doubly (m/z=763) charged ions, that eluted at 11 min. Panel C identifies the peptide having the largest signal from Panel B based on its MS/MS spectrum analyzed by comparing its b and y ions with the theoretical b and y ions. Panels D, E, and F show a typical data set used to analyze deuterium incorporation where the raw data set shows various deuterium incorporation levels of 0, 40, and 100%, respectively. MS analyses were performed as described in “Experimental procedures”.
Amide hydrogen-deuterium exchange analysis and representation
The semi-automatic process of deuterated peak analysis was performed as follows: deuterated peaks were identified by comparison of their retention times with those of their nondeuterated counterparts. Next, the selected m/z interval was determined from the width of a peak at 100% deuteration (i.e., 18,000 s). After the data was collected for all time points (Figs. 7D-F), they were used as input for HX-Express software (Weis et al., 2006). Visual inspection of peak widths also comprised part of the analysis. To account for back exchange at a specific time point after deuterium incorporation, we calculated the corrected uptake, D0, by using the equation described by Zhang shown below (Zhang and Marshall, 1998):
| (1) |
where: m represents the observed mass, m0% represents the mass with no deuterium, m100% - is the mass at full deuteration, and N- is the uncorrected mass.
One of several outputs of HX-Express software is a plot of deuterium uptake (Da) as a function of time (min). This plot was fitted to a model equation that accounts for fast (rate > 1 min−1) and slow (rate < 1 min−1) deuterium uptake (equation 1). The raw data were then fitted to equation 2 by using Origin 8.0 software (OriginLab Corporation):
| (2) |
where k1 and k2 represent the rates of fast and slow deuterium exchange, respectively. D100% represents the total amount of deuterium incorporated at t = 18, 000 s whereas A1 and A2 each represent the number of deuterons exchanging with rates k1 and k2, respectively. The same equation was used to fit incorporation of deuterium as a function of time into peptides generated following pepsin cleavage of GCAP1. The percent deuterium incorporation was calculated by assuming 100% deuteration to be the theoretical maximum number of deuteriums for each peptide. Color representation was performed as follows: 0-20%, blue; 30-40%, cyan; 40-50%, green; 50-60%, yellow; 60-70%, orange; and 70-80%, red.
Radiolytic footprinting of GCAP1
Samples of GCAP1 in the presence and absence of Ca2+ were prepared as described above. Those used for X-ray exposure were: (1) Ca2+-bound GCAP1 in 100 mM sodium cacodylate, 25 mM CaCl2, pH 7.2, and (2) Ca2+-free GCAP1 in 100 mM sodium cacodylate, pH 7.2. After exposure to X-ray radiation for 4, 5, and 10 ms, the sample (100 μl) was quenched with methionine amide as described (Xu et al., 2005) and the sample pH was increased to 8.2 by addition of 20 μl of 50 mM NH4HCO3, pH 9.0. MS/MS was used to identify cleavage patterns resulting from digestion with trypsin (Supplementary Material, Fig. S1). Only peptides that had one amino acid modified were used for analysis. A typical flow chart for the footprinting analyses is displayed in the (Supplementary Material, Fig. S1) (Takamoto and Chance, 2006; Xu and Chance, 2007).
Trypsin digests of GCAP1 and myr-GCAP1 exposed to X-rays
Proteolytic digestion, performed as described above, was initiated by adding 5 μl of trypsin to 95 μl of GCAP1 solution (4.4 μM). LC-MS/MS analyses of the digests were carried out on a Thermo-Finnigan Fourier Transform LTQ mass spectrometer operated with a Dionex capillary LC system, and employed a gradient of 0-60% acetonitrile in 0.1% HCOOH for 30 min. The digest was analyzed by data-dependent methods consisting of a preliminary full scan followed by a MS/MS scan of the 4 most abundant precursor ions. Obtained data were submitted to Mascot Daemon to search for oxidation of Glu, Phe, Lys, Met, Pro, and Tyr residues as variable modifications. Identification of cleavage patterns that resulted after digestion with trypsin was based on their MS/MS spectra (Supplementary Material, Fig. S1). After modified and unmodified fragments were identified (modified fragments eluted earlier) the unmodified fraction was calculated by using the area under the total ion current of the unmodified (AUNMODIFIED) and modified (AMODIFIED) fragments according to the formula shown below (Guan et al., 2002; Kiselar et al., 2003):
| (3) |
The fraction unmodified for each peptide at time 0 was set to 1. The data (unmodified fraction as a function of exposure time) were fit to the equation:
| (4) |
where y represents the unmodified fraction at time t and k is the first-order rate constant.
Molecular dynamics simulations
We constructed four different systems (Ca2+-bound / Ca2+- free GCAP1 and myr-GCAP1) by using the X-ray structure of myr-GCAP1 in the Ca2+-bound state (Stephen et al., 2007). Each system was solvated by using the SPC (Berendsen et al., 1981 ) water model and Na+ ions were used to neutralize the charge of the system. The topology and parameters such as charges, bonds, angles, dihedrals and impropers for the myristoylated Gly1 residue were generated using the PRODRG server (Schuettelkopf and van Aalten, 2004). Simulations were performed by using the GROMACS 4.05 (Hess et al., 2008) package with the GROMOS united atom force field. Systems were solvated by setting the distance between the protein and the simulation box walls to 10 Å. Energy minimization was performed using the steepest descent method with a step size set to 0.1 Å. Following energy minimization, a 10 ps position restraint run was done wherein the protein atoms were fixed around their initial positions and water molecules could move freely. Periodic boundary positions were employed in all three spatial dimensions and the system was treated as an NPT ensemble with a constant number of atoms, temperature (300 K), and pressure (1 bar). Electrostatic interactions were evaluated by the particle mesh Ewald summation method with the grid dimension for fast Fourier transform set to 1.6 Å and an interpolation order of 4 (Darden et al., 1993; Essmann et al., 1995). Constant pressure was achieved by employing the Parrinello-Rahman isotropic pressure coupling scheme (Parrinello and Rahman, 1980). The full molecular dynamics setup was similar to that used for position restraint except protein atoms were not restrained. The simulation time was set to 5 ns. Equilibration of the simulations was assessed by monitoring the root mean square displacement as a function of the simulation time for the α-carbon atoms of GCAP1. Several other parameters also were checked for internal consistency such as the temperature and pressure as a function of simulation time. Root mean square displacement (RMSD) calculations were carried out using the “g_rms” utility from the GROMACS package (Hess et al., 2008). Simulations were performed on eight processors at the high performance computing facility at Case Western Reserve University.
Supplementary Material
Acknowledgements
This research was supported by NIH grants EY 09339, EY 019050, EB 01979 and EB 9998. Beamline X28C of the National Synchrotron Light Source (NSLS) is supported by the National Institute of Biomedical Imaging and Bioengineering. The NSLS is financed by the Department of Energy. We thank Dr. Leslie T. Webster, Jr. for critical comments on the manuscript, and Drs. Thomas E. Angel and Sayan Gupta for help with footprinting experiments.
Abbreviations used
- GC
guanylate cyclase
- GCAP1
guanylate cyclase–activating protein 1
- myr-GCAP1
myristoylated guanylate cyclase-activating protein 1
- cGMP
cyclic guanosine monophosphate
- GTP
guanosine triphosphate
- HPLC
high performance liquid chromatography
- MS
mass spectrometry
- MS/MS
tandem mass spectrometry
- NCS
neuronal Ca2+ sensor
- NMT
N-myristoyl transferase
- RMSD
root mean square displacement
- EDTA
ethylenediaminetetraacetic acid
- TEV
tobacco etch virus
- HEPES
4-(2-hydroxyethyl)-1-piperazineethanesulfonic acid
- IPTG
isopropyl-β-D-thiogalactopyranoside
- SPC
single point charge
- RMSD
root mean square displacement
- SDS-PAGE
sodium dodecyl sulfate polyacrylamide gel electrophoresis
Footnotes
Publisher's Disclaimer: This is a PDF file of an unedited manuscript that has been accepted for publication. As a service to our customers we are providing this early version of the manuscript. The manuscript will undergo copyediting, typesetting, and review of the resulting proof before it is published in its final citable form. Please note that during the production process errors may be discovered which could affect the content, and all legal disclaimers that apply to the journal pertain.
REFERENCES
- Ames JB, Ishima R, Tanaka T, Gordon JI, Stryer L, Ikura M. Molecular mechanics of calcium–myristoyl switches. Nature. 1997;389:198–202. doi: 10.1038/38310. [DOI] [PubMed] [Google Scholar]
- Angel TE, Chance MR, Palczewski K. Conserved waters mediate structural and functional activation of family A (rhodopsin-like) G protein-coupled receptors. Proc. Natl. Acad. Sci. USA. 2009;106:8555–8560. doi: 10.1073/pnas.0903545106. [DOI] [PMC free article] [PubMed] [Google Scholar]
- Berendsen HJC, Postma JPM, van Gunsteren WF, Hermans J. Interaction models for water in relation to protein hydration. In: Pullman B.e.D., editor. Intermolecular Forces. Reidel Publishing Company Dordrecht; 1981. pp. 331–342. [Google Scholar]
- Burgoyne RD, O’Callaghan DW, Hasdemir B, Haynes LP, Tepikin AV. Neuronal Ca2+-sensor proteins: multitalented regulators of neuronal function. Trends Neurosci. 2004;27:203–209. doi: 10.1016/j.tins.2004.01.010. [DOI] [PubMed] [Google Scholar]
- Busenlehner LS, Armstrong RN. Insights into enzyme structure and dynamics elucidated by amide H/D exchange mass spectrometry. Arch. Biochem. Biophys. 2005;433:34–46. doi: 10.1016/j.abb.2004.09.002. [DOI] [PubMed] [Google Scholar]
- Coleman JE, Zhang Y, Brown GA, Semple-Rowland SL. Cone cell survival and downregulation of GCAP1 protein in the retinas of GC1 knockout mice. Invest Ophthalmol Vis Sci. 2004;45:3397–3403. doi: 10.1167/iovs.04-0392. [DOI] [PubMed] [Google Scholar]
- Darden T, York D, Pedersen L. Particle mesh Ewald: An N·log(N) method for Ewald sums in large systems. J. Chem. Phys. 1993;98:10089–10092. [Google Scholar]
- Dizhoor AM, Boikov SG, Olshevskaya EV. Constitutive activation of photoreceptor guanylate cyclase by Y99C mutant of GCAP-1. Possible role in causing human autosomal dominant cone degeneration. J. Biol. Chem. 1998;273:17311–17314. doi: 10.1074/jbc.273.28.17311. [DOI] [PubMed] [Google Scholar]
- Essmann U, Perera L, Berkowitz ML, Darden T, Lee H, Pedersen LG. A smooth particle mesh Ewald method. J. Chem. Phys. 1995;103:8577–8593. [Google Scholar]
- Gorczyca WA, Polans AS, Surgucheva IG, Subbaraya I, Baehr W, Palczewski K. Guanylyl cyclase activating protein. A calcium-sensitive regulator of phototransduction. J. Biol. Chem. 1995;270:22029–22036. doi: 10.1074/jbc.270.37.22029. [DOI] [PubMed] [Google Scholar]
- Guan JQ, Vorobiev S, Almo SC, Chance MR. Mapping the G-actin binding surface of cofilin using synchrotron protein footprinting. Biochemistry. 2002;41:5765–5775. doi: 10.1021/bi0121104. [DOI] [PubMed] [Google Scholar]
- Haeseleer F, Imanishi Y, Sokal I, Filipek S, Palczewski K. Calcium-binding proteins: intracellular sensors from the calmodulin superfamily. Biochem. Biophys. Res. Commun. 2002;290:615–623. doi: 10.1006/bbrc.2001.6228. [DOI] [PubMed] [Google Scholar]
- Hess B, Kutzner C, van der Spoel D, Lindahl E. GROMACS 4: Algorithms for Highly Efficient, Load-Balanced, and Scalable Molecular Simulation. J. Chem. Theory Comput. 2008;4:435–447. doi: 10.1021/ct700301q. (2008) 4, 435-447. [DOI] [PubMed] [Google Scholar]
- Hoffman MD, Kast J. Mass spectrometric characterization of lipid-modified peptides for the analysis of acylated proteins. J. Mass Spectrom. 2006;41:229–241. doi: 10.1002/jms.981. [DOI] [PubMed] [Google Scholar]
- Jankowska A, Burczynska B, Duda T, Warchol JB, Sharma RK. Calcium-modulated rod outer segment membrane guanylate cyclase type 1 transduction machinery in the testes. J. Androl. 2007;28:50–58. doi: 10.2164/jandrol.106.000182. [DOI] [PubMed] [Google Scholar]
- Jiang L, Katz BJ, Yang Z, Zhao Y, Faulkner N, Hu J, Baird J, Baehr W, Creel DJ, Zhang K. Autosomal dominant cone dystrophy caused by a novel mutation in the GCAP1 gene (GUCA1A) Mol Vis. 2005;11:143–151. [PubMed] [Google Scholar]
- Kiselar JG, Janmey PA, Almo SC, Chance MR. Structural analysis of gelsolin using synchrotron protein footprinting. Mol Cell Proteomics. 2003;2:1120–1132. doi: 10.1074/mcp.M300068-MCP200. [DOI] [PubMed] [Google Scholar]
- Kitiratschky VB, Behnen P, Kellner U, Heckenlively JR, Zrenner E, Jagle H, Kohl S, Wissinger B, Koch KW. Mutations in the GUCA1A gene involved in hereditary cone dystrophies impair calcium-mediated regulation of guanylate cyclase. Hum Mutat. 2009 doi: 10.1002/humu.21055. [DOI] [PubMed] [Google Scholar]
- Lim S, Peshenko I, Dizhoor A, Ames JB. Effects of Ca2+, Mg2+, and myristoylation on guanylyl cyclase activating protein 1 structure and stability. Biochemistry. 2009;48:850–862. doi: 10.1021/bi801897p. [DOI] [PMC free article] [PubMed] [Google Scholar]
- Michaelides M, Hardcastle AJ, Hunt DM, Moore AT. Progressive cone and cone-rod dystrophies: phenotypes and underlying molecular genetic basis. Surv Ophthalmol. 2006;51:232–258. doi: 10.1016/j.survophthal.2006.02.007. [DOI] [PubMed] [Google Scholar]
- Newbold RJ, Deery EC, Walker CE, Wilkie SE, Srinivasan N, Hunt DM, Bhattacharya SS, Warren MJ. The destabilization of human GCAP1 by a proline to leucine mutation might cause cone-rod dystrophy. Hum. Mol. Genet. 2001;10:47–54. doi: 10.1093/hmg/10.1.47. [DOI] [PubMed] [Google Scholar]
- Nishiguchi KM, Sokal I, Yang L, Roychowdhury N, Palczewski K, Berson EL, Dryja TP, Baehr W. A novel mutation (I143NT) in guanylate cyclase-activating protein 1 (GCAP1) associated with autosomal dominant cone degeneration. Invest. Ophthalmol. Vis. Sci. 2004;45:3863–3870. doi: 10.1167/iovs.04-0590. [DOI] [PMC free article] [PubMed] [Google Scholar]
- Otto-Bruc A, Buczylko J, Surgucheva I, Subbaraya I, Rudnicka-Nawrot M, Crabb JW, Arendt A, Hargrave PA, Baehr W, Palczewski K. Functional reconstitution of photoreceptor guanylate cyclase with native and mutant forms of guanylate cyclase-activating protein 1. Biochemistry. 1997a;36:4295–4302. doi: 10.1021/bi963000d. [DOI] [PubMed] [Google Scholar]
- Otto-Bruc A, Fariss RN, Haeseleer F, Huang J, Buczylko J, Surgucheva I, Baehr W, Milam AH, Palczewski K. Localization of guanylate cyclase-activating protein 2 in mammalian retinas. Proceedings of the National Academy of Sciences of the United States of America. 1997b;94:4727–4732. doi: 10.1073/pnas.94.9.4727. [DOI] [PMC free article] [PubMed] [Google Scholar]
- Palczewski K. G protein-coupled receptor rhodopsin. Annu. Rev. Biochem. 2006;75:743–767. doi: 10.1146/annurev.biochem.75.103004.142743. [DOI] [PMC free article] [PubMed] [Google Scholar]
- Palczewski K, Polans AS, Baehr W, Ames JB. Ca(2+)-binding proteins in the retina: structure, function, and the etiology of human visual diseases. Bioessays. 2000;22:337–350. doi: 10.1002/(SICI)1521-1878(200004)22:4<337::AID-BIES4>3.0.CO;2-Z. [DOI] [PubMed] [Google Scholar]
- Palczewski K, Subbaraya I, Gorczyca WA, Helekar BS, Ruiz CC, Ohguro H, Huang J, Zhao X, Crabb JW, Johnson RS. Molecular cloning and characterization of retinal photoreceptor guanylyl cyclase-activating protein. Neuron. 1994;13:395–404. doi: 10.1016/0896-6273(94)90355-7. al., e. [DOI] [PubMed] [Google Scholar]
- Parrinello M, Rahman A. Structure and pair potentials: a molecular-dynamics study. Phys. Rev. Lett. 1980;45:1196–1199. [Google Scholar]
- Polans A, Baehr W, Palczewski K. Turned on by Ca2+! The physiology and pathology of Ca(2+)-binding proteins in the retina. Trends Neurosci. 1996;19:547–554. doi: 10.1016/s0166-2236(96)10059-x. [DOI] [PubMed] [Google Scholar]
- Schuettelkopf AW, van Aalten DMF. PRODRG - a tool for high-throughput crystallography of protein-ligand complexes. Acta Crystallographica. 2004;D60:1355–1363. doi: 10.1107/S0907444904011679. [DOI] [PubMed] [Google Scholar]
- Sokal I, Dupps WJ, Grassi MA, Brown J, Jr, Affatigato LM, Roychowdhury N, Yang L, Filipek S, Palczewski K, Stone EM, Baehr W. A novel GCAP1 missense mutation (L151F) in a large family with autosomal dominant cone-rod dystrophy (adCORD) Invest. Ophthalmol. Vis. Sci. 2005;46:1124–1132. doi: 10.1167/iovs.04-1431. [DOI] [PMC free article] [PubMed] [Google Scholar]
- Sokal I, Li N, Verlinde CL, Haeseleer F, Baehr W, Palczewski K. Ca(2+)-binding proteins in the retina: from discovery to etiology of human disease(1) Biochim. Biophys. Acta. 2000;1498:233–251. doi: 10.1016/s0167-4889(00)00099-9. [DOI] [PubMed] [Google Scholar]
- Stephen R, Bereta G, Golczak M, Palczewski K, Sousa MC. Stabilizing function for myristoyl group revealed by the crystal structure of a neuronal calcium sensor, guanylate cyclase-activating protein 1. Structure. 2007;15:1392–1402. doi: 10.1016/j.str.2007.09.013. [DOI] [PMC free article] [PubMed] [Google Scholar]
- Stephen R, Filipek S, Palczewski K, Sousa MC. Ca2+-dependent Regulation of Phototransduction. Photochem. Photobiol. 2008;84:903–910. doi: 10.1111/j.1751-1097.2008.00323.x. [DOI] [PMC free article] [PubMed] [Google Scholar]
- Takamoto K, Chance MR. Radiolytic protein footprinting with mass spectrometry to probe the structure of macromolecular complexes. Annu. Rev. Biophys. Biomol. Struct. 2006;35:251–276. doi: 10.1146/annurev.biophys.35.040405.102050. [DOI] [PubMed] [Google Scholar]
- Weis DD, Kass IJ, Engen JR. Semi-automated analysis of hydrogen exchange mass spectra using HX-Express. J. Amer. Soc. Mass Spectrom. 2006;17:1700–1703. doi: 10.1016/j.jasms.2006.07.025. [DOI] [PubMed] [Google Scholar]
- Wilkie SE, Li Y, Deery EC, Newbold RJ, Garibaldi D, Bateman JB, Zhang H, Lin W, Zack DJ, Bhattacharya SS, et al. Identification and functional consequences of a new mutation (E155G) in the gene for GCAP1 that causes autosomal dominant cone dystrophy. Am. J. Hum. Genet. 2001;69:471–480. doi: 10.1086/323265. [DOI] [PMC free article] [PubMed] [Google Scholar]
- Xu G, Chance MR. Hydroxyl radical-mediated modification of proteins as probes for structural proteomics. Chem. Rev. 2007;107:3514–3543. doi: 10.1021/cr0682047. [DOI] [PubMed] [Google Scholar]
- Xu G, Kiselar J, He Q, Chance MR. Secondary reactions and strategies to improve quantitative protein footprinting. Anal Chem. 2005;77:3029–3037. doi: 10.1021/ac048282z. [DOI] [PubMed] [Google Scholar]
- Zhang Z, Marshall AG. A universal algorithm for fast and automated charge state deconvolution of electrospray mass-to-charge ratio spectra. J. Am. Soc. Mass. Spectrom. 1998;9:225–233. doi: 10.1016/S1044-0305(97)00284-5. [DOI] [PubMed] [Google Scholar]
Associated Data
This section collects any data citations, data availability statements, or supplementary materials included in this article.