

Abstract
Background
The genetic contributions to human common disorders and mouse genetic models of disease are complex and often overlapping. In common human diseases, unlike classical Mendelian disorders, genetic factors generally have small effect sizes, are multifactorial, and are highly pleiotropic. Likewise, mouse genetic models of disease often have pleiotropic and overlapping phenotypes. Moreover, phenotypic descriptions in the literature in both human and mouse are often poorly characterized and difficult to compare directly.
Methods
In this report, human genetic association results from the literature are summarized with regard to replication, disease phenotype, and gene specific results; and organized in the context of a systematic disease ontology. Similarly summarized mouse genetic disease models are organized within the Mammalian Phenotype ontology. Human and mouse disease and phenotype based gene sets are identified. These disease gene sets are then compared individually and in large groups through dendrogram analysis and hierarchical clustering analysis.
Results
Human disease and mouse phenotype gene sets are shown to group into disease and phenotypically relevant groups at both a coarse and fine level based on gene sharing.
Conclusion
This analysis provides a systematic and global perspective on the genetics of common human disease as compared to itself and in the context of mouse genetic models of disease.
Background
Common complex diseases such as cardiovascular disease, cancer, and autoimmune disorders; metabolic conditions such as diabetes and obesity, as well as neurological and psychiatric disorders make up a majority of health morbidity and mortality in developed countries. The specific genetic contributions to disease etiology and relationships to environmental factors in common disorders are unclear; complicated by many factors such as gene-gene interactions, the balance between susceptibility and protective alleles, copy number variation, low relative risk contributed by each gene, and a myriad of complex environmental inputs.
Genetic association studies using a candidate gene approach and more recently whole genome association studies (GWAS) have produced a large and rapidly increasing amount of information on the genetics of common disease. In parallel, mouse genetic models for human disease have provided a wealth of genetic and phenotypic information. While not always perfect models for human common complex disorders, the genetic purity and experimental flexibility of mouse disease models have produced valuable insights relevant to human disease.
Gene nomenclature standardization[1], database efforts [2-4], and phenotype ontology projects[5] in both human and mouse over the past decade have provided the foundation for integration of information on genetic contributions to disease and phenotypes. This allows the opportunity for systematic comparison and higher order systems analysis of disease and phenotypic information. In this report, we summarize and integrate large scale information on human genetic association information and mouse genetically determined phenotypic information with the goal of identifying fundamental relationships in human disease and mouse models of human disease.
Methods
The Genetic Association Database
The Genetic Association Database [2] (GAD) http://geneticassociationdb.nih.gov is an archive of summary data of published human genetic association studies of many common disease types. GAD is primarily focused on archiving information on common complex human disease rather than rare Mendelian disorders as found in the Online Mendelian Inheritance in Man (OMIM)[6]. GAD contains curated information on candidate gene studies and more recently on genome wide association studies. It builds on the curation of the CDC HuGENet info literature database [3] in part by adding molecular and ontological annotation creating a bridge between epidemiological and molecular information. This allows the large-scale integration of disease based genetic association information with genomic and molecular information as well as with the software tools and computational approaches and that use genomic information [7-12]. This report is a summary and analysis of the genes and diseases with positive associations in the Genetic Association Database with regard to replication, comparisons between diseases, and within broad phenotypic disease classes. Although GAD contains information on gene variation, this report is at the gene level only and does not consider specific gene variation or genetic polymorphism.
The Genetic Association Database (GAD) currently contains approximately 40,000 individual gene records of genetic association studies taken from over 23,000 independent publications. Importantly, a large number (11,568) of the records in GAD have a designation of whether the gene of record was reported to be associated (Y) or was not (N) associated with the disease phenotype for that specific record. Many records, for various reasons, do not have such a designation. In addition, a portion of the database records have been annotated with standardized disease phenotype keywords from the MeSH http://www.nlm.nih.gov/mesh/ vocabulary. The GAD summations shown below are a subset of the records in GAD. They only include those records that are both; a) positively associated with a disease phenotype, and b) have a MeSH disease phenotype annotation. This represents a subset of 10,324 records having both positive associations to disease and records with MeSH annotations. Records designated as not associated (N) with a disease phenotype and those without MeSH disease annotation are not considered at this time in this report.
Mouse phenotypic database
The mouse phenotypic information described here was obtained from the Mouse Genome Informatics (MGI) database [4]http://www.informatics.jax.org/ Phenotypes, Alleles and Disease Models section. The file used for mouse phenotypic information (see methods) is comprised of 5011 unique genes and 5142 unique phenotypic terms derived from information from specific gene mutations in multiple mouse strains. The mouse phenotypic information had been annotated to the mouse gene mutation records using Mammalian Phenotype terms and codes in the mouse phenotype database as a component of the Mouse Phenotyping Project [5,13].
Quantitation of genes and disease phenotypes
Quantitation of how often a disease phenotype was positively associated with a gene was performed as follows. GAD records having both recorded positive associations and annotated MeSH disease keywords were extracted and stored in a database according to their relationships. Using a perl script, the number of times of co-occurrence of a MeSH disease keyword was positively associated with a specific gene was recorded as found in the GAD database. These counts were sorted in declining order for each unique gene grouped by the disease MeSH term with which they are associated.
Mouse phenotypic information
The mouse phenotypic information described here was obtained from the Mouse Genome Informatics (MGI) http://www.informatics.jax.org/; Phenotypes, Alleles and Disease Models section; ftp://ftp.informatics.jax.org/pub/reports/index.html#pheno
Using these three files downloaded on 4-4-2008
ftp://ftp.informatics.jax.org/pub/reports/MPheno_OBO.ontology
ftp://ftp.informatics.jax.org/pub/reports/MGI_PhenotypicAllele.rpt
ftp://ftp.informatics.jax.org/pub/reports/MGI_PhenoGenoMP.rpt
The mouse phenotype files were extracted using a perl script annotating each gene with the phenotype term associated with each Mammalian Phenotype (MP) code.
Venn Diagram overlap of individual gene lists
Individual GAD primary gene sets were analyzed using Venny[14]http://bioinfogp.cnb.csic.es/tools/venny/index.html. Pathway Venn Diagram comparisons were performed by placing individual GAD primary gene sets into WebGestalt [15]http://bioinfo.vanderbilt.edu/webgestalt/ to identify KEGG pathways, then placing the resulting pathway names into Venny.
Dendrogram analysis of gene sets
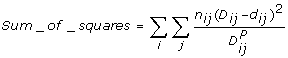
Relationships between diseases were identified by a unique method similar to phyologenetic classification. First the distance between the diseases were calculated by pairwise comparison of the diseases by finding the common genes between the pairs and dividing it by the smallest group of the pair. This number was then subtracted from 1. This step was done because if two lists are identical (100% match) then the resultant distance should be 0. This is represented in the formula:
Where: Ck: Genes in each disease set (where k = i, j); N(Ck): Number of genes in each disease set (where k = i, j); dij is the pairwise distance; i, j: index of genes in each disease set where; i = 1, 2, 3, ........., n; j = 1, 2, 3, ........., m
The disease relationships were calculated from the distance matrix using the Fitch program from the Phylip package[16]. It calculates the relationships based on the Fitch and Margoliash method of constructing the phylogenetic trees[17] using the following formula (from the Phylip manual):
 |
where D is the observed distance between gene sets i and j and d is the expected distance, computed as the sum of the lengths of the segments of the tree from gene set i to gene set j. The quantity n is the number of times each distance has been replicated. In simple cases n is taken to be one. If n is chosen more than 1, the distance is then assumed to be a mean of those replicates. The power P is what distinguished between the Fitch and Neighbor-Joining methods. For the Fitch-Margoliash method P is 2.0 and for Neighbor-Joining method it is 0.0. As running Fitch took a long time when the gene-set size was huge (weeks for the human gene-sets and months for the mouse gene-sets), Neighbor-Joining method was used to create the replicate dendrograms (not shown) after randomizing the input order for greater confidence. The resulting coefficient matrix files were displayed using the Phylodraw graphics program[18].
Hierarchical clustering of gene sets
Ward's minimum variance method[19] was used to find the distance between two diseases. The distance between the clusters is the ANOVA sum of squares between the two clusters added up over all the variables. At each generation, the within-cluster sum of squares is minimized over all partitions obtainable by merging two clusters from the previous generation. Ward's method joins clusters to maximize the likelihood at each level of the hierarchy under the assumptions of multivariate normal mixtures, spherical covariance matrices, and equal sampling probabilities. Distance for Ward's method is: 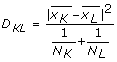 (taken from JMP Manual) where NK is the number of observations in CK (which is the Kth cluster, subset of {1, 2, ..., n) where n is the number of observations).
  is the mean vector for cluster CK.
Results
Each record in GAD represents a specific gene from a unique publication of a human population based genetic association study and is categorized into one of 24 general disease classes corresponding to broad MeSH disease or disease phenotypic groupings. Table 1 is a summary of the number of positively associated human genes in each MeSH human disease class. As represented by these disease classes the GAD database covers a broad selection of diseases falling into major disease classes including; aging studies, cancer, immune disorders, psychiatric diseases, metabolic conditions, pharmacogenomic studies, and studies of chemical dependency, among others. Similarly, each record in the phenotype files from the MGI phenotype database represents a unique mouse gene specific genetic model. Table 2 shows the general categories represented by the mouse phenotype summary files and the number of mouse genes found in each top level phenotype class. The mouse files contain a greater number of intermediate developmental and morphological phenotypes (e.g. insulin resistance, absent CD4+ T cells, abnormal spatial learning) while the human files tend to comprise a greater number of end stage clinical disease phenotypes (e.g. Type 2 Diabetes, multiple sclerosis, autism).
Table 1.
Number of human genes associated in each Disease Class
| DISEASE CLASS | # of human genes in each disease class |
|---|---|
| Neoplasms | 1835 |
| Cardiovascular Diseases | 1112 |
| Pathological Conditions, Signs and Symptoms | 938 |
| Nervous System Diseases | 902 |
| Nutritional and Metabolic Diseases | 838 |
| Mental Disorders | 554 |
| Digestive System Diseases | 407 |
| Male Urogenital Diseases | 396 |
| Musculoskeletal Diseases | 366 |
| Respiratory Tract Diseases | 362 |
| Bacterial Infections and Mycoses | 256 |
| Disorders of Environmental Origin | 243 |
| Female Urogenital Diseases and Pregnancy Complications | 226 |
| Virus Diseases | 224 |
| Skin and Connective Tissue Diseases | 212 |
| Hemic and Lymphatic Diseases | 183 |
| Eye Diseases | 176 |
| Congenital, Hereditary, and Neonatal Diseases and Abnormalities | 142 |
| Stomatognathic Diseases | 130 |
| Immune System Diseases | 116 |
| Endocrine System Diseases | 98 |
| Parasitic Diseases | 57 |
| Otorhinolaryngologic Diseases | 35 |
| Animal Diseases | 4 |
Table 2.
Number of Mouse genes in each General Phenotypic Class
| PHENOTYPIC CLASS | # of Mouse genes in each class |
|---|---|
| unassigned top level | 19186 |
| nervous system phenotype | 8149 |
| immune system phenotype | 6414 |
| homeostasis/metabolism phenotype | 5976 |
| skeleton phenotype | 5559 |
| growth/size phenotype | 5556 |
| behavior/neurological phenotype | 5417 |
| cardiovascular system phenotype | 5221 |
| hematopoietic system phenotype | 5163 |
| reproductive system phenotype | 4762 |
| lethality-prenatal/perinatal | 4409 |
| embryogenesis phenotype | 3416 |
| skin/coat/nails phenotype | 3048 |
| vision/eye phenotype | 2710 |
| hearing/vestibular/ear phenotype | 2447 |
| muscle phenotype | 2370 |
| cellular phenotype | 2335 |
| normal phenotype | 2120 |
| renal/urinary system phenotype | 2104 |
| endocrine/exocrine gland phenotype | 1871 |
| life span-post-weaning/aging | 1857 |
| respiratory system phenotype | 1832 |
| digestive/alimentary phenotype | 1780 |
| lethality-postnatal | 1777 |
| liver/biliary system phenotype | 1498 |
| limbs/digits/tail phenotype | 1282 |
| tumorigenesis | 1268 |
| adipose tissue phenotype | 1067 |
| craniofacial phenotype | 1016 |
| pigmentation phenotype | 634 |
| touch/vibrissae phenotype | 625 |
| no phenotypic analysis | 403 |
| other phenotype | 343 |
| taste/olfaction phenotype | 156 |
Table 3 introduces examples of human genes from fundamental biological pathways that have been consistently associated with major disease phenotypes highlighting the sometimes-broad pleiotropic effects that major regulatory molecules have on multiple disease phenotypes. Genes such as NOS3, nitric oxide synthase 3, regulating nitrous oxide production; HLA-DQB1, the MHC class II molecule DQ beta 1, involved in antigen presentation; ACE, angiotensin I converting enzyme, central to the renin-angiotensin system and PPARG, peroxisome proliferator-activated receptor gamma, regulating transcription in pathways important in lipid metabolism are examples of genes that affect multiple tissues and different organ systems through the complex course of disease progression. Importantly, all the mouse orthologs of the human genes in Table 3 have experimentally determined phenotypes that are similar or broadly overlapping with human clinical disease phenotypes (see below).
Table 3.
Selected Major Genes and Disease Phenotypes
| Gene | Gene | ||
|---|---|---|---|
| APOE | ALZHEIMER DISEASE (70) | VDR | PROSTATIC NEOPLASMS (10) |
| CORONARY DISEASE (8) | OSTEOPOROSIS, POSTMENOPAUSAL (8) | ||
| CARDIOVASCULAR DISEASES (7) | BREAST NEOPLASMS (7) | ||
| MYOCARDIAL INFARCTION (6) | DIABETES MELLITUS, TYPE 1 (6) | ||
| DIABETES MELLITUS, TYPE 2 (6) | OSTEOPOROSIS (6) | ||
| ACE | HYPERTENSION (47) | MTHFR | NEURAL TUBE DEFECTS (6) |
| DIABETES MELLITUS, TYPE 2 (25) | COLORECTAL NEOPLASMS (5) | ||
| MYOCARDIAL INFARCTION (17) | DIABETES MELLITUS, TYPE 2 (5) | ||
| CORONARY DISEASE (16) | ESOPHAGEAL NEOPLASMS (5) | ||
| DIABETIC NEPHROPATHIES (15) | ADENOCARCINOMA (4) | ||
| HLA-DQB1 | DIABETES MELLITUS, TYPE 1 (30) | CYP17A1 | BREAST NEOPLASMS (10) |
| PAPILLOMAVIRUS INFECTIONS (7) | PROSTATIC NEOPLASMS (9) | ||
| CELIAC DISEASE (6) | PROSTATIC HYPERPLASIA (4) | ||
| AUTOIMMUNE DISEASES (5) | OSTEOPOROSIS, POSTMENOPAUSAL (3) | ||
| TUBERCULOSIS, PULMONARY (5) | ENDOMETRIAL NEOPLASMS (2) | ||
| DRD2 | ALCOHOLISM (17) | ADRB2 | ASTHMA (12) |
| SCHIZOPHRENIA (14) | OBESITY (10) | ||
| PERSONALITY DISORDER (2) | HYPERTENSION (8) | ||
| DEPRESSIVE DISORDER (2) | DIABETES MELLITUS, TYPE 2 (4) | ||
| DYSKINESIA, DRUG INDUCED (2) | BRONCHIAL HYPERREACTIVITY (4) | ||
| PPARG | DIABETES MELLITUS, TYPE 2 (18) | NOS3 | HYPERTENSION (20) |
| OBESITY (11) | MYOCARDIAL INFARCTION (18) | ||
| DIABETES MELLITUS (6) | CORONARY ARTERY DISEASE (15) | ||
| INSULIN RESISTANCE (4) | CORONARY DISEASE (12) | ||
| GLUCOSE INTOLERANCE (2) | DIABETES MELLITUS, TYPE 2 (10) |
Summaries of genes and phenotypes in human and mouse
The majority of this report is built upon large non-redundant general summary lists for both human and mouse, shown below. These lists take two complimentary forms in both human and mouse. The first sets are GENE-to-Disease/Phenotype lists. These are non-redundant lists of genes showing the diseases or phenotypes that have been associated with each gene (Table 4 human, table 5 mouse, and table 6 human-mouse). The second sets of basic lists are DISEASE/PHENOTYPE-to-Gene lists. These are non redundant lists of diseases or phenotypes with the genes that have been associated with that disease or phenotype (Table 7 human and table 8 mouse).
Table 4.
Selected Human Genes and Disease Phenotype (MeSH counts), positive associations
| Gene ID | HUGO Gene Sym. | MESH TERM 1 | MESH TERM 2 | MESH TERM 3 | MESH TERM 4 |
|---|---|---|---|---|---|
| 348 | APOE | Alzheimer Disease(70) | Coronary Disease(8) | Cardiovascular Diseases(7) | Diabetes Mellitus, Type 2(6) |
| 1636 | ACE | Hypertension(47) | Diabetes Mellitus, Type 2(25) | Myocardial Infarction(17) | Coronary Disease(16) |
| 3119 | HLA-DQB1 | Diabetes Mellitus, Type 1(30) | Papillomavirus Infections(7) | Celiac Disease(6) | Tuberculosis, Pulmonary(5) |
| 1493 | CTLA4 | Diabetes Mellitus, Type 1(28) | Graves Disease(21) | Thyroiditis, Autoimmune(10) | Autoimmune Diseases(8) |
| 183 | AGT | Hypertension(24) | Coronary Disease(6) | Diabetic Nephropathies(5) | Myocardial Infarction(5) |
| 1814 | DRD3 | Schizophrenia(24) | Dyskinesia, Drug-Induced(6) | Psychotic Disorders(5) | Alcoholism(2) |
| 4846 | NOS3 | Hypertension(20) | Myocardial Infarction(18) | Coronary Artery Disease(15) | Coronary Disease(12) |
| 3075 | CFH | Macular Degeneration(19) | Choroidal Neovascularization(3) | Hemolytic-Uremic Syndrome(2) | Atrophy(2) |
| 3077 | HFE | Hemochromatosis(18) | Cardiovascular Diseases(1) | Colorectal Neoplasms(1) | Liver Cirrhosis(1) |
| 3356 | HTR2A | Schizophrenia(18) | Alzheimer Disease(4) | Depressive Disorder(4) | Depressive Disorder, Major(4) |
| 1585 | CYP11B2 | Hypertension(18) | Cardiovascular Diseases(2) | Ventricular Dysfunction, Left(2) | Cardiomyopathy, Dilated(2) |
| 5468 | PPARG | Diabetes Mellitus, Type 2(18) | Obesity(11) | Diabetes Mellitus(6) | Insulin Resistance(4) |
| 2784 | GNB3 | Hypertension(18) | Insulin Resistance(4) | Diabetes Mellitus, Type 2(3) | Obesity(3) |
| 1815 | DRD4 | Attention Def. Dis. with Hyperact. (17) | Schizophrenia(8) | Substance-Related Disorders(4) | Mood Disorders(4) |
| 1813 | DRD2 | Alcoholism(17) | Schizophrenia(14) | Personality Disorders(2) | Depressive Disorder(2) |
| 155 | ADRB3 | Obesity(17) | Diabetes Mellitus, Type 2(9) | Insulin Resistance(6) | Endometrial Neoplasms(2) |
| 9370 | ADIPOQ | Diabetes Mellitus, Type 2(17) | Insulin Resistance(11) | Obesity(8) | Hypertension(4) |
| 3123 | HLA-DRB1 | Arthritis, Rheumatoid(16) | Diabetes Mellitus, Type 1(16) | Multiple Sclerosis(8) | Lupus Erythematosus, Systemic(7) |
| 118 | ADD1 | Hypertension(16) | Cardiovascular Diseases(3) | Cerebral Hemorrhage(1) | Diabetic Angiopathies(1) |
| 3117 | HLA-DQA1 | Diabetes Mellitus, Type 1(15) | Graves Disease(4) | Autoimmune Diseases(4) | Celiac Disease(4) |
| 1956 | EGFR | Lung Neoplasms(15) | Carcinoma, Non-SC Lung(10) | Adenocarcinoma(6) | Neoplasm Recurrence, Local(3) |
| 6690 | SPINK1 | Pancreatitis(15) | Chronic Disease(11) | Acute Disease(3) | Pancreatitis, Alcoholic(3) |
| 6934 | TCF7L2 | Diabetes Mellitus, Type 2(15) | Insulin Resistance(4) | Diabetes Mellitus(2) | Liver Neoplasms(1) |
| 1234 | CCR5 | HIV Infections(14) | Diabetes Mellitus, Type 2(4) | Diabetic Nephropathies(4) | Asthma(3) |
| 5663 | PSEN1 | Alzheimer Disease(14) | Down Syndrome(2) | Dementia(1) | Cerebral Amyloid Angiopathy(1) |
| 11132 | CAPN10 | Diabetes Mellitus, Type 2(14) | Insulin Resistance(3) | Polycystic Ovary Syndrome(2) | Obesity(2) |
| 3553 | IL1B | Stomach Neoplasms(14) | Helicobacter Infections(6) | Alzheimer Disease(5) | Periodontitis(3) |
| 6532 | SLC6A4 | Depressive Disorder, Major(13) | Depressive Disorder(13) | Bipolar Disorder(10) | Alcoholism(8) |
| 4210 | MEFV | Familial Mediterranean Fever(13) | Amyloidosis(4) | Behcet Syndrome(3) | Colitis, Ulcerative(2) |
| 3172 | HNF4A | Diabetes Mellitus, Type 2(13) | Glucose Intolerance(2) | Birth Weight(1) | Fetal Macrosomia(1) |
| 7157 | TP53 | Carcinoma, Squamous Cell(13) | Lung Neoplasms(12) | Breast Neoplasms(10) | Carcinoma, Non-SC Lung(9) |
| 672 | BRCA1 | Breast Neoplasms(12) | Ovarian Neoplasms(5) | Carcinoma, Endometrioid(1) | DNA Damage(1) |
| 185 | AGTR1 | Hypertension(12) | Myocardial Infarction(3) | Coronary Disease(3) | Pregnancy Comp., Cardiovascular(2) |
| 154 | ADRB2 | Asthma(12) | Obesity(10) | Hypertension(8) | Diabetes Mellitus, Type 2(4) |
| 3953 | LEPR | Obesity(12) | Body Weight(4) | Insulin Resistance(4) | Glucose Intolerance(3) |
| 2169 | FABP2 | Diabetes Mellitus, Type 2(12) | Insulin Resistance(10) | Obesity(7) | Hyperlipidemias(4) |
| 929 | CD14 | Asthma(12) | Myocardial Infarction(5) | Arteriosclerosis(4) | Colitis, Ulcerative(4) |
| 26191 | PTPN22 | Arthritis, Rheumatoid(11) | Diabetes Mellitus, Type 1(9) | Lupus Erythematosus, Systemic(5) | Arthritis, Psoriatic(2) |
| 3596 | IL13 | Asthma(11) | Hypersensitivity, Immediate(4) | Pulmonary Dis., Chronic Obstr. (4) | Respiratory Hypersensitivity(2) |
| 1080 | CFTR | Cystic Fibrosis(10) | Pancreatitis(5) | Chronic Disease(3) | Acute Disease(2) |
Table 5.
Selected Mouse Genes-Disease Phenotypes
| Mouse Gene Sym. | Human Ortholog Gene Sym. | Mouse Phenotype 1 | Mouse Phenotype 2 | Mouse Phenotype 3 | Mouse Phenotype 4 | Mouse Phenotype 5 |
|---|---|---|---|---|---|---|
| A4galt | A4GALT | abnormal induced morb./mort. | abnormal resp./metab. to xenobiotics | life span-post-weaning/aging | homeostasis/metab. phenotype | |
| Abca2 | ABCA2 | tremors | decreased body weight | behavior/neurological phenotype | hyperactivity | increased startle reflex |
| Abcc2 | ABCC2 | abnormal blood chemistry | abnormal liver physiology | abnormal urine chemistry | abnormal kidney physiology | Abn. resp./metabolism to xenobiotics |
| Abi2 | ABI2 | abn. corpus callosum morph. | abnormal cerebral cortex morph. | abnormal hippocampus morph. | abnormal dentate gyrus morph. | microphthalmia |
| Acaca | ACACA | abnormal liver physiology | abnormal lipid level | incr. circulating free fatty acid level | hyperglycemia | embryonic growth arrest |
| Acads | ACADS | hypoglycemia | behavior/neurological phenotype | abnormal drinking behavior | abnormal food preference | abnormal urine chemistry |
| Accn1 | ACCN1 | retinal degeneration | vision/eye phenotype | abnormal eye electrophysiology | ||
| Adad1 | ADAD1 | impaired fertilization | male infertility | asthenozoospermia | oligozoospermia | reproductive system phenotype |
| Adam23 | ADAM23 | tremors | behavior/neurological phenotype | ataxia | postnatal lethality | lethality-postnatal |
| Adarb1 | ADARB1 | behavior/neurological phenot. | seizures | postnatal lethality | behavior/neurological phenotype | normal phenotype |
| Adipoq | ADIPOQ | vasculature congestion | increased body weight | decreased body weight | abnormal CNS syn. transmission | abnormal coat appearance |
| Adora1 | ADORA1 | behavior/neurological phenot. | increased anxiety-related response | abnormal body temperature regulation | abnormal angiogenesis | abnormal nervous system electrophys. |
| Ager | AGER | increased bone density | abnormal cancellous bone morph. | abnormal blood chemistry | reproductive system phenotype | abnormal cell proliferation |
| Akap1 | AKAP1 | reduced female fertility | decreased litter size | abnormal female meiosis | increased cholesterol level | |
| Apoc1 | APOC1 | abnormal circ. cholesterol level | abnormal lipid level | increased circulating triglyceride level | abnormal immune sys. Morph. | abnormal bile composition |
| B2m | B2M | decreased hematocrit | abnormal interleukin-10 physiology | rectal prolapse | abnormal dorsal root gang. morph. | enlarged spleen |
| Bax | BAX | enlarged spleen | increased thymocyte number | abnormal motor neuron morph. | short snout | abnormal sympathetic neuron morph. |
| Bcl2 | BCL2 | small ears | absent melanin granules in hair follicle | abnormal snout morph. | herniated abdominal wall | abnormal small intestine morph. |
| Bmp1 | BMP1 | abnormal heart morph. | abnormal aorta morph. | abnormal ventricular septum morph. | abnormal awl hair | prenatal lethality |
| Brca1 | BRCA1 | abnormal cell death | increased cell proliferation | decreased cell proliferation | decreased anxiety-related resp. | kinked tail |
| Capn10 | CAPN10 | abnormal pancreas physiology | endocrine/exocrine gland phenotype | digestive/alimentary phenotype | decreased inflammatory response | |
| Casp1 | CASP1 | abnormal apoptosis | abnormal induced morbidity/mortality | abnormal inflammatory response | decr. suscep. to endotoxin shock | tumorigenesis |
| Ccr4 | CCR4 | immune system phenotype | decreased tumor necrosis factor secr. | decreased interleukin-1 beta secretion | abnormal induced morbid./mort. | |
| Dusp1 | DUSP1 | thick alveolar septum | abnormal circ. alanine transaminase | hypotension | increased thymocyte number | lung inflammation |
| E2f1 | E2F1 | abnormal cell death | decreased salivation | enlarged thymus | pale liver | exencephaly |
| Epo | EPO | abnormal erythropoiesis | abnormal pericardium morph. | small liver | postnatal growth retardation | abnormal hepatocyte morph. |
| Ercc4 | ERCC4 | abnormal cell content/morph. | abnormal liver morph. | decreased body weight | absent blood islands | liver/biliary system phenotype |
| F5 | F5 | behavior/neurological phenot. | abnormal somite development | abnormal yolk sac morph. | increased suscep. to bact. Infect. | hemorrhage |
| Fcgr1 | FCGR1A | impaired macrophage phagocyt. | abnormal inflammatory response | decreased inflammatory response | abnormal yolk sac morph. | abnormal cell-mediated immunity |
| Foxo1 | FOXO1 | absent organized vascular net. | abnormal looping morphogenesis | abnormal vasculature | exencephaly | absent vitelline blood vessels |
| Gadd45a | GADD45A | decreased leukocyte cell num. | increased cell proliferation | increased thymocyte number | postnatal lethality | skin irradiation sensitivity |
| Gap43 | GAP43 | decreased body weight | abnormal optic nerve innervation | absent optic tract | abnormal erythropoiesis | nervous system phenotype |
| Gata1 | GATA1 | decreased hematocrit | abnormal thrombopoiesis | extramedullary hematopoiesis | overexpanded resp. alveoli | liver hypoplasia |
| Grin1 | GRIN1 | abn. trigeminal nerve morph. | atelectasis | lung hemorrhage | abnormal tympanic ring morph. | decreased body weight |
| Hoxa1 | HOXA1 | small ears | abnormal inner ear morph. | abnormal malleus morph. | increased susceptibility to injury | abnormal cochlea morph. |
| Hspa1a | HSPA1A | decreased body weight | increased cell. Sens. to gamma-irrad. | chromosome breakage | increased body weight | homeostasis/metabolism phenotype |
| Icam1 | ICAM1 | increased leukocyte cell number | increased neutrophil cell number | increased monocyte cell number | abnormal spatial learning | abnormal retina morph. |
| Igbp1 | IGBP1 | decreased thymocyte number | behavior/neurological phenotype | abnormal cued conditioning behavior | intestinal ulcer | abnormal thymus lobule morph. |
Table 6.
Selected Human-Mouse Phenotype Overlap
| Mouse Gene Sym | Human Gene Sym | Human Gene ID # | Human Disease MeshTerm | Mouse Phenotype Term |
|---|---|---|---|---|
| Npc1l1 | NPC1L1 | 29881 | Hypercholesterolemia(1) | abnormal circulating LDL cholesterol level; decreased circulating HDL cholesterol level; abnormal triglyceride level; abnormal lipid homeostasis; ... |
| Nkx2-5 | NKX2-5 | 1482 | Heart Defects, Congenital(1), Heart Block(1) |
abnormal heart development; abnormal looping morphogenesis; abnormal heart tube morphology; abnormal heart shape; thin ventricular wall; ... |
| Oprm1 | OPRM1 | 4988 | Alcoholism(9), Substance-Related Disorders(5), Heroin Dependence(2), Pain, Postoperative(2), Epilepsy, Generalized(1), Substance Withdrawal Syndrome(1), Cocaine-Related Disorders(1), Diabetes Mellitus, Type 2(1), Kidney Failure, Chronic(1), Pain(1), Ischemia(1), Opioid-Related Disorders(1), Postoperative Nausea and Vomiting(1) |
abnormal response to addictive substance; preference for addictive substance; abnormal touch/nociception; abnormal pain threshold; decreased chemically-elicited antinociception; sensitivity to addictive substance; excitatory postsyn. potential; resistance to addictive substance; altered response to anesthetics; ... |
| Homer1 | HOMER1 | 9456 | Cocaine-Related Disorders(1) | cocaine preference; abnormal conditioning behavior; abnormal response to addictive substance; nervous system phenotype; abnormal nervous system physiology; behavior/neurological phenotype, ... |
| Insl3 | INSL3 | 3640 | Cryptorchidism(3), Abnormalities, Multiple(1), Hypospadias(1), Gonadal Dysgenesis(1), Infertility, Male(1), Testicular Diseases(1) |
abnormal male reproductive anatomy; small testis; abnormal spermatogenesis; behavior/neurological phenotype; male infertility; female infertility; abnormal estrous cycle; abnormal gametogenesis; decreased germ cell number; cryptorchism; ... |
| Stat6 | STAT6 | 6778 | Asthma(3), Hypersensitivity(3), Dermatitis, Atopic(2), Anaphylaxis(2), Nut Hypersensitivity(1), Nephrotic Syndrome(1), Infertility(1), Hypersensitivity, Immediate(1), Graves Disease(1), Endometriosis(1), ... |
abnormal humoral immune response; decreased IgM level; decreased IgA level; decreased susceptibility to viral infection; decreased IgE level; increased IgG level; increased IgA level; abnormal interleukin physiology; abnormal interferon physiology; abnormal CD8-positive T cell morphology; ... |
| En2 | EN2 | 2020 | Autistic Disorder(1), Asperger Syndrome(1) |
abnormal social investigation; abnormal spatial learning; abnormal social/conspecific interaction; abnormal cerebellum morphology; abnormal cerebellar foliation; abnormal vermis morphology; abnormal cerebellar granule layer; abnormal colliculi morphology; hyperactivity; impaired coordination; abnormal grooming behavior; ... |
| Hsd11b1 | HSD11B1 | 3290 | Diabetes Mellitus, Type 2(2), Obesity(2), Hypertension(2), Insulin Resistance(2), Polycystic Ovary Syndrome(1), Hyperandrogenism(1) |
abnormal abdominal fat pads; abnormal circulating cholesterol level; decreased circulating LDL cholesterol level; enlarged adrenal glands; increased circulating HDL cholesterol level; abnormal glucose homeostasis; decreased circulating triglyceride level; abnormal corticosterone level; improved glucose tolerance; ... |
| Msh3 | MSH3 | 4437 | Lung Neoplasms(1), Head and Neck Neoplasms(1), Colonic Neoplasms(1), Carcinoma, Squamous Cell(1), Carcinoma, Small Cell(1) |
tumorigenesis; increased tumor incidence; premature death; life span-post-weaning/aging |
| Crb1 | CRB1 | 23418 | Optic Atrophies, Hereditary(1), Blindness(1) |
abnormal retinal photoreceptor morphology; abnormal retina morphology; retinal degeneration; decreased retinal photoreceptor cell number; photosensitivity; abnormal ocular fundus morphology; nervous system phenotype; abnormal retinal photoreceptor layer; abnormal photoreceptor inner segment morph; ... |
| Chrna7 | CHRNA7 | 1139 | Schizophrenia(3), Auditory Perceptual Disorders(1), Memory Disorders(1) |
pharmacologically induced seizures; decreased anxiety-related response; abnormal spatial learning; abnormal hippocampus function; abnormal tumor necrosis factor physiology; homeostasis/metabolism phenotype |
| Inha | INHA | 3623 |
Ovarian Failure, Premature(2), Amenorrhea(1) |
kyphoscoliosis; abnormal liver morphology; abnormal ovarian follicle morphology; enlarged testes; abnormal spermatogenesis; increased circulating follicle stimulating hormone; male infertility; female infertility; tumorigenesis; ovary hemorrhage; cachexia; diffuse hepatic necrosis; pancytopenia; liver/biliary system phenotype; ... |
| Slc6a3 | SLC6A3 | 6531 | Attention Deficit Disorder w/Hyp.(7), Tobacco Use Disorder(3), Schizophrenia(2), Alcohol Withdrawal Delirium(2), Eating Disorders(1), Substance Withdrawal Syndrome(1), Stress Disorders, Post-Traumatic(1), Child Behavior Disorders(1), Bulimia(1), Alcoholism(1), |
abnormal maternal nurturing; hyperactivity; hypoactivity; impaired coordination; increased exploration in new environment; decreased exploration in new environment; abnormal spatial learning; abnormal pituitary secretion; abnormal lactation; increased dopamine level; cocaine preference; ... |
| Cyp11b2 | CYP11B2 | 1585 | Hypertension(18), Cardiovascular Diseases(2), Ventricular Dysfunction, Left(2), Cardiomyopathy, Dilated(2), Arteriosclerosis(1), Acromegaly(1), Fibrosis(1), Arthritis, Rheumatoid(1), Polycystic Ovary Syndrome(1), Metabolic Syndrome X(1), |
decreased body size; hypotension; increased circulating corticosterone level; decreased circulating aldosterone level; decreased circulating chloride level; increased circulating renin level; abnormal enzyme/coenzyme level; lethality-postnatal; homeostasis/metabolism phenotype; growth/size phenotype; ... |
| Ptpn22 | PTPN22 | 26191 | Arthritis, Rheumatoid(11), Diabetes Mellitus, Type 1(9), Lupus Erythematosus, Systemic(5), Arthritis, Psoriatic(2), Autoimmune Diseases(2), Arthritis, Juvenile Rheumatoid(2), Nephritis(1), Multiple Sclerosis(1), Asthma(1), Cholangitis, Sclerosing(1), |
enlarged spleen; enlarged lymph nodes; abnormal Peyer's patch germinal center morph; abnormal T cell physiology; increased IgE level; increased B cell number; immune system phenotype; hematopoietic system phenotype; increased follicular B cell number; increased spleen germinal center number; increased IgG1 level; increased IgG2a level; ... |
Table 7.
Selected Human Disease Phenotypes (MeSH) and Gene counts, positive associations
| Disease Mesh Term | Gene Rank 1 | Gene Rank 2 | Gene Rank 3 | Gene Rank 4 | Gene Rank 5 | Gene Rank 6 | Gene Rank 7 | Gene Rank 8 |
|---|---|---|---|---|---|---|---|---|
| DISEASE CLASS - CARDIOVASCULAR | ||||||||
| Hypertension | ACE(47) | AGT(24) | NOS3(20) | CYP11B2(18) | GNB3(18) | ADD1(16) | AGTR1(12) | ADRB2(8) |
| Myocardial Infarction | NOS3(18) | ACE(17) | SERPINE1(11) | ITGA2(7) | LPL(6) | APOE(6) | GP1BA(5) | F7(5) |
| Coronary Disease | ACE(16) | NOS3(12) | PON1(11) | APOB(11) | APOE(8) | LPL(7) | AGT(6) | SERPINE1(6) |
| Coronary Artery Disease | NOS3(15) | PON1(9) | ACE(7) | APOA5(6) | APOE(5) | AGT(4) | ABCA1(4) | APOA1(4) |
| Hypertrophy, Left Ventricular | ACE(15) | GNB3(3) | AGTR2(2) | EDN1(2) | TNNT2(2) | NOS3(2) | ENPP1(1) | ACE2(1) |
| Venous Thrombosis | F5(8) | F2(5) | SERPINE1(4) | MTHFR(3) | ABO(2) | F8(2) | JAK2(2) | PROCR(2) |
| Cardiovascular Diseases | APOE(7) | CETP(6) | ACE(5) | NOS3(5) | PON1(4) | APOA5(4) | APOC3(4) | SERPINE1(3) |
| Myocardial Ischemia | ACE(6) | LPL(5) | NOS3(2) | ITGB3(2) | APOB(2) | AGT(1) | AGTR1(1) | SELPLG(1) |
| Arteriosclerosis | ACE(5) | CD14(4) | PON1(3) | FGB(3) | MTHFR(3) | NOS3(3) | APOE(3) | TLR4(2) |
| Cardiomyopathies | TTR(5) | HFE(1) | APOA1(1) | HLADQB1(1) | SOD2(1) | CCR2(1) | SELE(1) | MMP9(1) |
| Heart Failure | ADRA2C(5) | ADRB1(5) | ACE(3) | NOS3(3) | ADRB2(3) | AMPD1(2) | SCNN1B(1) | EDN1(1) |
| DISEASE CLASS - DIGESTIVE SYS. DISEASES | ||||||||
| Pancreatitis | SPINK1(15) | CFTR(5) | PRSS1(3) | HLA-DRB1(2) | HLA-A(1) | TLR4(1) | UGT1A7(1) | KRT8(1) |
| Cystic Fibrosis | CFTR(10) | NOS1(2) | SERPINA1(2) | SPINK1(1) | CAPN10(1) | SFTPA2(1) | GCLC(1) | FCGR2A(1) |
| Celiac Disease | HLADQB1(6) | CTLA4(6) | HLADQA1(4) | TNF(2) | PTPN22(1) | IFNG(1) | TIPARP(1) | IL21(1) |
| Crohn Disease | IL23R(6) | NOD2(5) | TNF(5) | ABCB1(4) | CD14(4) | IBD5(3) | DLG5(3) | MIF(3) |
| Liver Cirrhosis, Alcoholic | ALDH2(6) | ACE(1) | TNF(1) | SOD2(1) | ADH1C(1) | ADH1B(1) | DRD2(1) | CYP2E1(1) |
| Colitis, Ulcerative | ABCB1(5) | IL23R(5) | TNF(4) | CD14(4) | TLR4(3) | ICAM1(3) | IL1RN(3) | CTLA4(3) |
| Gastritis, Atrophic | MPO(3) | TLR4(1) | IL13(1) | PTPN11(1) | TNF(1) | ABO(1) | CMA1(1) | IL1B(1) |
| Inflammatory Bowel Diseases | TNF(3) | ABCB1(3) | IL23R(3) | ITPA(2) | NOD2(2) | DLG5(2) | HP(2) | PON1(1) |
| Cholangitis, Sclerosing | HLADRB1(2) | HP(2) | PTPN22(1) | MMP1(1) | HLADQA1(1) | TNF(1) | HLADQB1(1) | MMP3(1) |
| DISEASE CLASS - DIS. OF ENVIRONMENTAL ORIGIN | ||||||||
| Alcoholism | DRD2(17) | OPRM1(9) | SLC6A4(8) | ALDH2(7) | MAOA(6) | GABRA2(4) | NPY(4) | ADH1B(3) |
| DNA Damage | XRCC1(7) | TP53(3) | CYP1A1(3) | GSTM1(3) | OGG1(3) | LIG4(2) | APEX1(2) | BRCA2(2) |
| Substance-Related Disorders | SLC6A4(5) | OPRM1(5) | DRD4(4) | DRD5(2) | BDNF(2) | ADH4(2) | CNR1(2) | DRD2(2) |
| Fractures, Bone | ESR1(4) | ESR2(2) | COL1A1(2) | CYP19A1(1) | IGF1(1) | TNFRSF11B(1) | P2RX7(1) | TGFB1(1) |
| Tobacco Use Disorder | CYP2A6(3) | SLC6A3(3) | CHRNA4(2) | TH(2) | BDNF(1) | PPP1R1B(1) | SLC18A2(1) | PTEN(1) |
| Cocaine-Related Disorders | PDYN(2) | HOMER1(1) | TTC12(1) | ANKK1(1) | DBH(1) | GSTP1(1) | OPRM1(1) | |
| Heroin Dependence | OPRM1(2) | BDNF(1) | OPRD1(1) | SLC6A4(1) | COMT(1) | MAOA(1) | ||
| Spinal Fractures | COL1A1(2) | CYP19A1(1) | TNFRSF11B(1) | GC(1) | PLXNA2(1) | AR(1) | NOS3(1) | |
| DISEASE CLASS - IMMUNE SYSTEM | ||||||||
| Autoimmune Diseases | CTLA4(8) | HLADQB1(5) | HLADRB1(4) | HLADQA1(4) | PTPN22(2) | HLA-A(2) | CYP2D6(2) | CIITA(2) |
| Hypersensitivity, Immediate | IL4R(8) | IL13(4) | CD14(4) | IL4(2) | SERPINE1(2) | CCL5(2) | NOS2A(2) | CTLA4(2) |
| Graft vs Host Disease | IFNG(3) | TNF(2) | TLR4(1) | NOD2(1) | HLA-DPB1(1) | HLA-A(1) | IL10(1) | IL1R1(1) |
| Hypersensitivity | IL4(3) | STAT6(3) | IL4R(2) | IFNG(1) | IFNGR1(1) | TLR2(1) | FADS1(1) | IL13(1) |
| Antiphospholipid Syndrome | F2(2) | SELPLG(1) | SERPINE1(1) | FCGR2A(1) | HLADMA(1) | |||
| Food Hypersensitivity | IL4(1) | IL4R(1) | STAT6(1) | IL13(1) | HLADQB1(1) | CD14(1) | ||
| DISEASE CLASS - MENTAL DISORDERS | ||||||||
| Schizophrenia | DRD3(24) | HTR2A(18) | DRD2(14) | COMT(10) | HTR2C(8) | BDNF(8) | DRD4(8) | NOTCH4(8) |
| Attention Deficit Disorder with Hyperactivity | DRD4(17) | SLC6A3(7) | SLC6A4(6) | ADRA2A(4) | MAOA(3) | SNAP25(3) | SLC6A2(2) | DRD5(2) |
| Depressive Disorder | SLC6A4(13) | HTR2A(4) | TPH1(3) | CYP2D6(2) | CYP2C19(2) | MAOA(2) | BDNF(2) | DRD2(2) |
| Depressive Disorder, Major | SLC6A4(13) | TPH1(5) | HTR2A(4) | TPH2(3) | BDNF(2) | DRD2(2) | GNB3(2) | DTNBP1(1) |
| Bipolar Disorder | SLC6A4(10) | BDNF(6) | MAOA(5) | COMT(5) | XBP1(3) | GABRA5(3) | HTR2A(3) | TPH2(3) |
| Anxiety Disorders | SLC6A4(7) | MAOA(3) | PLXNA2(1) | BDNF(1) | DBI(1) | MED12(1) | GABRB3(1) | DRD2(1) |
| Mood Disorders | SLC6A4(5) | DRD4(4) | CLOCK(2) | MAOA(2) | BDNF(2) | ACE(1) | CRH(1) | DRD3(1) |
| Psychotic Disorders | DRD3(5) | SLC6A4(3) | DRD4(3) | HTR2A(3) | DTNBP1(2) | DISC1(2) | DRD2(2) | MAOA(1) |
| Obsessive-Compulsive Disorder | SLC6A4(4) | HTR2A(3) | COMT(3) | SLC1A1(2) | DRD4(2) | HTR1B(1) | BDNF(1) | NRCAM(1) |
| Panic Disorder | CCK(4) | HTR1A(2) | MAOA(2) | HTR2A(2) | DBI(1) | CCKAR(1) | ADORA2A(1) | PGR(1) |
| Cognition Disorders | APOE(3) | BDNF(3) | DRD4(2) | COMT(2) | HMGCR(1) | DTNBP1(1) | SLC6A4(1) | NQO1(1) |
| DISEASE CLASS - NERVOUS SYSTEM DISEASES | ||||||||
| Alzheimer Disease | APOE(70) | PSEN1(14) | A2M(10) | CYP46A1(8) | ACE(7) | BCHE(7) | IL1A(7) | BDNF(6) |
| Parkinson Disease | PARK2(9) | LRRK2(9) | CYP2D6(7) | MAOB(7) | BDNF(5) | SNCA(5) | PON1(4) | PINK1(4) |
| Multiple Sclerosis | HLADRB1(8) | APOE(5) | CTLA4(4) | PTPRC(4) | MBP(3) | HLA-DQB1(3) | IFNG(2) | CRYAB(2) |
| Amyotrophic Lateral Sclerosis | SOD1(6) | PON1(2) | PON2(2) | VEGFA(2) | SMN1(1) | MAPT(1) | MT-ND5(1) | PON3(1) |
| Brain Ischemia | FGB(5) | PDE4D(3) | NOS3(3) | ACE(2) | PON1(2) | MTHFR(2) | ITGB3(2) | TLR4(1) |
| Cerebrovascular Accident | NOS3(5) | APOE(5) | FGB(5) | PON1(4) | SERPINE1(3) | ALOX5AP(3) | ACE(2) | KL(2) |
| Carotid Artery Diseases | NOS3(4) | PON1(3) | MTHFR(3) | CCL2(2) | IL6(2) | APOE(2) | CD14(2) | ACE(1) |
| Dementia | APOE(4) | MAPT(3) | MT-ND1(1) | PRNP(1) | PSEN1(1) | TNF(1) | CDC2(1) | IGF1R(1) |
| DISEASE CLASS - NUTR. AND METABOLIC DISEASES | ||||||||
| Diabetes Mellitus, Type 2 | ACE(25) | PPARG(18) | ADIPOQ(17) | TCF7L2(15) | CAPN10(14) | HNF4A(13) | FABP2(12) | NOS3(10) |
| Obesity | ADRB3(17) | LEPR(12) | MC4R(11) | PPARG(11) | UCP2(11) | ADRB2(10) | UCP1(8) | ADIPOQ(8) |
| Insulin Resistance | ADIPOQ(11) | FABP2(10) | INSR(7) | IRS1(7) | ENPP1(7) | ADRB3(6) | NOS3(6) | ACE(5) |
| Diabetes Mellitus | PPARG(6) | ACE(3) | INS(3) | NOS3(3) | PON1(2) | UBL5(2) | IRS1(2) | TCF7L2(2) |
| Hyperlipidemias | APOA5(5) | FABP2(4) | LPL(3) | APOE(3) | ACE(2) | APOA1(2) | PPARA(2) | PPARG(2) |
| Hypertriglyceridemia | APOC3(5) | APOA5(4) | LPL(3) | APOE(3) | ADRB2(2) | APOA4(2) | GP1BA(1) | LTA(1) |
| Glucose Intolerance | LEPR(3) | ADIPOQ(3) | IGF1(2) | KCNJ11(2) | PTPN1(2) | PPARG(2) | HNF4A(2) | NEUROG3(1) |
| Hypercholesterolemia | APOA1(3) | APOB(3) | F12(3) | ACE(2) | LDLR(2) | LPL(2) | PCSK9(2) | ABCG8(2) |
| Metabolic Syndrome | APOC3(3) | UBL5(2) | NOS3(2) | ACE(1) | PPARD(1) | NPY5R(1) | ACE2(1) | RGS2(1) |
| DISEASE CLASS - EYE DISEASES | ||||||||
| Macular Degeneration | CFH(19) | APOE(4) | PON1(2) | C2(1) | CFB(1) | ABCA1(1) | HTRA1(1) | MELAS(1) |
| Diabetic Retinopathy | VEGFA(7) | AKR1B1(4) | PON1(3) | RAGE(3) | AGER(3) | ACE(2) | ITGA2(2) | ICAM1(2) |
| Glaucoma | CYP1B1(3) | OPTN(2) | OPA1(2) | OPTC(1) | EDNRA(1) | MYOC(1) | ||
| Ocular Hypertension | OPTN(2) | CYP1B1(1) | OLFM2(1) | OPA1(1) | ||||
| Cataract | GALT(1) | AIPL1(1) | IFNGR1(1) | GCNT2(1) | ||||
| Retinal Degeneration | NDP(1) | GUCA1A(1) | AIPL1(1) | COL2A1(1) | RHO(1) | GUCA1B(1) | ABCA4(1) | |
| Myopia | HLADPB1(1) | LUM(1) | COL2A1(1) | NYX(1) | MYOC(1) |
Table 8.
Selected Mouse Disease Related Phenotypes
| PhenoCode | PhenoType | |||||||
|---|---|---|---|---|---|---|---|---|
| DISEASE CLASS CARDIOVASCULAR | Gene 1 | Gene 2 | Gene 3 | Gene 4 | Gene 5 | Gene 6 | Gene 10 | |
| MP:0005048 | thrombosis | Abca5 | Actc1 | Adamts13 | Ahr | Alox12 | Anxa2 | F2rl2 |
| MP:0005341 | decreased sus. to atherosclerosis | APOA1 | Apoe | Artles | Ath17 | Ath29 | Ath37 | Icam1 |
| MP:0000231 | hypertension | Abcc9 | Ace2 | Add2 | Agt | Alb1-Ren | Bpq5 | Chga |
| MP:0004181 | abnormal carotid artery morphology | Aldh1a2 | Chrd | Crk | Ednra | Fgf8 | Foxm1 | Shc1 |
| MP:0004111 | abnormal coronary artery morph. | Adm | Ahr | Fgf8 | Gja1 | Hspg2 | Itga4 | Vegfa |
| MP:0005338 | atherosclerotic lesions | Aorls1 | Aorls2 | Apoe | Ath29 | Ath6 | Ath8 | Fabp4-Aebp1 |
| MP:0000343 | altered resp. to myocardial infarction | Agtr2 | Aifm1 | Ak1 | Bnip3 | CMV-Abcc9 | Ccr1 | Ckm-Prkaa2 |
| MP:0006058 | decreased cerebral infarction size | ACTB-Ngb | EGFP | Adora2a | Cx3cl1 | F11 | F12 | Plat |
| MP:0003037 | increased infarction size | Aifm1 | Fgf2 | Hmox1 | Kit | Mapk1 | Myh6-tTA | Thbd |
| MP:0004875 | Inc. mean arterial blood pressure | Ddah1 | Edn1 | Ednrb | Kcnn3 | Ptger1 | Tagln-tTA | |
| MP:0005339 | Inc. susceptibility to atherosclerosis | Apoa1 | Apoe | Artles | Ascla1 | Ascla2 | Ascla3 | Ath18 |
| DISEASE CLASS - DIGESTIVE SYSTEM DISEASES | Gene 1 | Gene 2 | Gene 3 | Gene 4 | Gene 5 | Gene 6 | Gene 10 | |
| MP:0003119 | abnormal digestive system dev. | Cdkn1c | Cyp26a1 | Foxp4 | Mapk7 | Mcm4 | Nckap1 | Tbx6 |
| MP:0000462 | abnormal digestive system morph. | Apc | Bmp5 | Cdcs1 | Cdkn1c | Cftr | Ctnnbip1 | Gast |
| MP:0001663 | abnormal digestive system phys. | Apoe | Cd44 | Cftr | Clec7a | Col2a1 | Fut2 | Gpx1 |
| MP:0000474 | abnormal foregut morphology | Apc | Foxa2 | Gata4 | Gdf1 | Hgs | Ldb1 | Otx2 |
| MP:0000488 | abnormal intestinal epithelium morph | Atr | B4galt1 | B9d2 | Bdkrb2 | Cbfa2t2 | Col1a1 | Elf3 |
| MP:0003449 | abnormal intestinal goblet cells | Areg | Cbfa2t2 | Cftr | Clca3 | Ctnnb1 | E2f4 | Il13 |
| MP:0006001 | abnormal intestinal transit time | Drd2 | Gfra2 | Gucy1b3 | Hmox2 | Mrvi1 | Smtn | |
| MP:0000470 | abnormal stomach morphology | Ahr | Aire | Barx1 | Celsr3 | Cfc1 | Col1a1 | Gdf11 |
| DISEASE CLASS - DIS. OF ENVIRONMENTAL ORIGIN | Gene 1 | Gene 2 | Gene 3 | Gene 4 | Gene 5 | Gene 6 | Gene 10 | |
| MP:0001425 | abnormal alcohol consumption | Aaq1 | Alcp1 | Alcp19 | Alcp2 | Ap7q | Ap8q | Ppp1r1b |
| MP:0005443 | abnormal ethanol metabolism | Adh1 | Adh7 | Afteq1 | Afteq2 | Alcw3 | Htas2 | |
| MP:0002552 | abnormal response to addictive sub. | Adora2a | Adra1d | Alcw1 | Alcw2 | Alcw3 | Alcw4 | Chrna4 |
| MP:0001987 | alcohol preference | Alcp1 | Alcp25 | Alcp3 | Alcp4 | Alprf | Ap1q | Ap5q |
| MP:0001988 | cocaine preference | Grm2 | Homer1 | Homer2 | Per2 | Slc6a3 | Slc6a4 | |
| MP:0003546 | decreased alcohol consumption | Camk2a | Gnas | Gria3 | Prkce | tmgc55 | ||
| MP:0004048 | resistance to addictive substance | Adora2a | Adra1b | Apba1 | Aqp4 | Btbd14b | Chrna4 | Slc6a3 |
| DISEASE CLASS - IMMUNE SYSTEM DISEASES | Gene 1 | Gene 2 | Gene 3 | Gene 4 | Gene 5 | Gene 6 | Gene 10 | |
| MP:0001844 | autoimmune response | Tcra | Tcrb | ACTB | Aire | Cd1d1 | Fas | Ikzf3 |
| MP:0005016 | decreased lymphocyte cell number | Atm | Bcl2 | Bcl6b | Birc2 | C3ar1 | Ccr9 | Ctsd |
| MP:0008088 | abnormal T-helper 1 cell diff. | Cbfb | Ifngr2 | Il2 | Il4 | Irf4 | Mapk8 | Sit1 |
| MP:0002499 | chronic inflammation | Ccr7 | Gstz1 | Hmox1 | Il10 | Il1rn | Jak3 | Plcg2 |
| MP:0004804 | dec. sus. to autoimmune diabetes | HLA-DQA1 | HLA-DQB1 | Art2a | B2m | Cd4 | Cd4DsRed | Cdk4 |
| MP:0002411 | decreased sus. to bacterial infection | Anth | Anth2 | B2m | C4b | Casp1 | Cd97 | Dcn |
| MP:0005597 | dec. sus. to type I hypers-reaction | Alox5 | Alox5ap | Cysltr1 | Cysltr2 | Fcer1a | Fcer1g | Orai1 |
| MP:0003725 | increased autoantibody level | Tcra | Tcrb | Acla1 | Acla2 | Aire | Cd276 | Cia38 |
| MP:0005014 | increased B cell number | BCL2 | Bak1 | Bax | Bcl11b | Bcl2l11 | Bst1 | Cdkn2c |
| MP:0005013 | increased lymphocyte cell number | Axl | B4galt1 | Bak1 | Casp8 | Cd19 | Ewsr1 | Galnt1 |
| MP:0004803 | Inc. sus. to autoimmune diabetes | Ins1-Cat | Tyr | B2m | Cd274 | Cd28 | Cd38 | Cdk2 |
| MP:0005350 | Inc. sus. to autoimmune disorder | Tcra | Tcrb | Ads1 | Ads2 | Ads3 | Ads4 | Bak1 |
| MP:0002412 | increased sus. to bacterial infection | Adamts13 | Adcyap1r1 | Adh5 | Atf2 | Bbaa21 | Bcl10 | C3 |
| DISEASE CLASS - MENTAL DISORDERS DISEASE CLASS - MENTAL DISORDERS | Gene 1 | Gene 2 | Gene 3 | Gene 4 | Gene 5 | Gene 6 | ||
| MP:0001412 | excessive scratching | Atp2b4 | Bdnf | Ctsl | EIF1AX | Lck-Il31ra | Mapt | Gene 10 |
| MP:0001362 | abnormal anxiety-related response | App | Araf | Axtofd1 | Axtofd3 | Axtofd4 | Axtofd5 | |
| MP:0001458 | abnormal object recognition memory | Gabbr1 | Gal | Grin1 | Prnp | Prnp-App | Psen1 | Crhr1 |
| MP:0001360 | abnormal social investigation | Avpr1a | Avpr1b | Cadps2 | En2 | Gnao1 | Grin1 | |
| MP:0002557 | abnormal social/conspecific int. | Ar | Cadps2 | Disc1 | En2 | Grin1 | Grin3b | Maoa |
| MP:0002065 | abnormal fear/anxiety-related beh. | APPV717I | App | Atp1a2 | Crebbp | Egr1 | Gnai1 | Oxt |
| MP:0001364 | decreased anxiety-related response | APP | Adcy8 | Adcyap1 | Adcyap1r1 | Avpr1a | B3galt2 | Nos3 |
| MP:0002573 | behavioral despair | Adra2c | B3gnt2 | Cacna1c | Crhr2 | Desp1 | Desp2 | Camk2a |
| MP:0001462 | abn. avoidance learning behavior | Aal | Aap | Dcx | Idua | Ntrk2 | Nr3c1 | |
| DISEASE CLASS - NUTR. AND METABOLIC DISEASES | Gene 1 | Gene 2 | Gene 3 | Gene 4 | Gene 5 | Gene 6 | ||
| MP:0005560 | decreased circulating glucose level | Ins1-Cat | Tyr | Acadm | Adipoq | Apcs-Lep | Apoe | Gene 10 |
| MP:0004185 | abnormal adipocyte glucose uptake | Akt2 | Bglap1 | Cebpa | Pik3r1 | Prkci | Ptprv | Cd36 |
| MP:0000188 | abnormal circulating glucose level | Adipor1 | Cidea | Ciita | Ckm | Crh | Dbm3 | |
| MP:0001560 | abnormal circulating insulin level | Cacna1c | Cebpa | Foxa1 | Gal | Gck | IGFBP2 | Irs2 |
| MP:0003383 | abnormal gluconeogenesis | Adipoq | Adipor1 | Cebpa | Cebpb | Lpin1 | Mc2r | Mgat4a |
| MP:0005291 | abnormal glucose tolerance | Adipoq | Fstl3 | Irs4 | Lep | Pcsk1 | Pnpla2 | Smarcb1 |
| MP:0003564 | abnormal insulin secretion | Eif2ak3 | Gast | Gck | Gjd2 | Ins2 | Lep | |
| MP:0002727 | decreased circulating insulin level | Adcyap1r1 | Adipor2 | Ahsg | Akt2 | Apcs-Lep | Apoa2 | |
| MP:0002711 | decreased glucagon secretion | Cacna1e | Dbh | Kcnj11 | Nkx2-2 | Pcsk2 | Bglap1 | |
| MP:0003059 | decreased insulin secretion | Abcc8 | Anxa7 | Bglap1 | Cacna1e | Cartpt | Chrm3 | |
| MP:0001548 | hyperlipidemia | APOC1 | Acox1 | Apc | Apoe | Cdkn1b | Cpt1c | Eif2s1 |
| MP:0005293 | impaired glucose tolerance | APPswe | PSEN1dE9 | Abcc8 | Acadvl | Adcyap1r1 | Adipoq | Lepr |
| MP:0005292 | improved glucose tolerance | Adipor2 | Ahsg | Bcat2 | Cbl | Crebbp | Cxcl14 | Akt2 |
| MP:0004892 | increased adiponectin level | Actb | Adipor2 | Cideb | Crebbp | Pde3b | Pten | Gcgr |
| MP:0002575 | Inc. circulating ketone body level | Acacb | Adcyap1 | Gck | AZIP | Ins2 | Ins2-Nos2 | Scd1 |
| MP:0003645 | Inc. pancreatic beta cell number | ACTB | Akt2 | Arx | Hnf4a | Cdkn1b | Foxo1 | Ins2-rtTA |
| MP:0001759 | increased urine glucose level | Aqp1 | Aqp7 | Cdk4 | Cdk4 | Cryaa-TAg | Dnajc3a | Ins1 |
| MP:0005331 | insulin resistance | APOB | Adipoq | Adipor1 | Clcn5 | Adra1b | Akt2 | Bglap1 |
| DISEASE CLASS - EYE DISEASES | Gene 1 | Gene 2 | Gene 3 | Gene 4 | Gene 5 | Gene 6 | Gene 10 | |
| MP:0001299 | abnormal eye distance/position | Dst | Edg2 | Hectd1 | Hesx1 | Itgb1 | Nrtn | |
| MP:0000776 | abnormal inferior colliculus | Atg5 | En1 | Ext1 | Fgf17 | Fgf8 | Fgfr1 | |
| MP:0003236 | abnormal lens capsule morphology | Abi2 | Cdkn2a | Cryaa | Cryga | Hsf1 | Hsf4 | Otx2 |
| MP:0002864 | abnormal ocular fundus morphology | Crb1 | Gpr143 | Mitf | Pitx3 | Rd9 | Rp1h | |
| MP:0002638 | abnormal pupillary reflex | Cat4 | Cnga3 | Cry1 | Eccp | Foxe3 | Iac | tmgc25 |
| MP:0002699 | abnormal vitreous body | Aldh1a1 | Aldh1a3 | Bmp4 | Cdkn2a | Fzd4 | Gas1 | |
| MP:0001314 | corneal opacity | Alm | Apo | Areg | Bmp4 | Cat4 | Col4a1 | Lim2 |
| MP:0001851 | eye inflammation | Adam17 | Atf2 | Eda | Fign | ITGA2 | ITGA5 | Dsc1 |
| MP:0005542 | corneal vascularization | Dstn | Eda | Fign | Flt1 | Foxe3 | Ifnar1 | Plg |
| MP:0003011 | delayed dark adaptation | Rbp1 | Rdh11 | Rdh12 | Rdh5 | Rdh8 | Rlbp1 | Pgf |
| MP:0005172 | reduced eye pigmentation | Ap3b1 | Ap3d1 | Hps5 | Hps6 | Mitf | Nf1 | Sema4a |
Human
Table 4 shows examples of selected genes in each row that have been positively associated with specific disease phenotype keywords. Each human gene symbol is followed by a specific MeSH disease term and the number of times that gene has been positively associated with the term, in declining order. A major feature of Table 4 is that individual genes have been positively associated with sometimes overlapping disease phenotypes over a broad range from more frequently to less frequently. Table 4 is a small representative subset, truncated in the number of genes (rows) and the number of MeSH terms (columns). The complete list of 1,584 human genes with additional information can be found in Table S1a [20]. An interactive version of the same list can be found in Table S1b[21].
Quite often the resulting list of phenotypes associated with a specific gene may include the major disease phenotype followed by specific sub-phenotypes of the disease that contribute distinct aspects to the overall clinical disease phenotype. For example, IL13 has been associated with asthma at least 11 times as well as to the asthma sub-phenotype immediate hypersensitivity 4 times. Similarly, the gene CFH has been associated with macular degeneration at least 19 times, as well as to the endo-phenotype of macular degeneration, choroidal neovascularization 3 times. Although replication in genetic association studies has been widely debated[22], consistent replication by independent groups, although sometimes with both modest risk and significance values[23], suggests a fundamental measure of scientific validity. This is true for both candidate gene as well as GWAS studies.
In other cases, individual genes have been associated with independent but related disorders that may share fundamental biological pathways in disease etiology, such as HLA-DQB1, CTLA4, and PTPN22 as in the case of autoimmune disorders. This gene overlap emphasizes the fundamental, often step-wise biochemical role each gene plays in shared disease etiology [24-27]. That is, HLA-DQB1 in antigen presentation, CTLA4 in regulation of the expansion of T cell subsets, and PTPN22 in T cell receptor signaling, all contributing to immunological aberrations and progression to clinical disease, as in rheumatoid arthritis, systemic lupus erythematosus, and type 1 diabetes. In other cases, the same gene has been associated with quite different clinical phenotypes, suggesting sharing of complex biological mechanisms at a more underlying level. For example, the gene CFTR, widely recognized as the cause of cystic fibrosis, has been consistently associated with pancreatitis, may be implicated in chronic rhinitis [28], and may play a protective role in gastrointestinal disorders [29].
Mouse
Tables 5 and S2 are the mouse equivalents of the human GENE-to-Disease/Phenotype lists (tables 4 and S1 for human). These were developed from the mouse phenotype table of genes with mouse phenotype ontological codes ftp://ftp.informatics.jax.org/pub/reports/index.html#pheno, downloaded on 4-4-08. To build tables 5 and S2, the matching phenotypic terms were exchanged for each Mammalian Phenotype code (MP:#). This resulted in the mouse GENE-to-Disease/Phenotype tables (tables 5 and S2) similar in structure to human GENE-to-Disease/Phenotype tables (tables 4 and S1). Unlike the human tables, the mouse GENE-to-Disease/Phenotype tables come from individual mouse experimental knockout or other genetic studies. They are not based on population based epidemiological studies. They also do not have the quantitative aspect of the human tables with publication frequency counts tagged to each record. In addition, although they include a wide variety of physiological, neurological, and behavioral phenotypes, they do emphasize developmental studies and observational morphological phenotypes common in mouse knockout studies. Table 5 is a small representative subset, truncated in the number of genes (rows) and the number of Phenotype terms (columns). The complete list of 5011 mouse genes with annotated phenotypes and additional information can be found in Table S2a[30]. An interactive version of the same list can be found in Table S2b[31].
Direct comparison of human and mouse genes disease/phenotypes
We can now compare these tables directly, thereby allowing gene-by-gene comparison of human disease phenotypes and mouse genetic phenotypes. Tables 6 and S3 are comparisons of the genes that overlap between the human and mouse gene lists (Table S1 and Table S2) showing mouse gene symbols and their human orthologs. Table 6 is a small subset of selected gene-phenotype cross species comparisons. Even though in some cases the human studies have not been replicated, there is often a striking concordance between human disease phenotypes and mouse genetically determined phenotypes. For example, the human gene inhibin alpha (INHA) has been associated with premature ovarian failure[32], and shows mouse phenotypes of abnormal ovarian follicle morphology, female infertility, and ovarian hemorrhage[33], among other phenotypes relevant to human disease. Similarly, in humans the engrailed homeobox 2 gene (EN2) has been associated with autistic disorder[34] while the comparison to mouse En2 has genetic mutations involved in abnormal social integration, spatial learning, and social/consecutive interaction, among others[35]. Importantly, the few mouse studies highlighted above, and many found in the main table S3, were published after the corresponding human genetic population based epidemiological studies. Given concerns of false positives and publication bias in human genetic association studies, direct comparisons to related mouse phenotypes may provide supporting evidence that a given gene may be relevant to a specific human disease phenotype. Table S3[36] is a full listing of the 1104 shared genes between the human disease and mouse phenotype summaries.
Summaries of phenotypes and genes in human and mouse
The second type of main summary tables are DISEASE/PHENOTYPE-to-Gene lists. Disease/Phenotype gene summaries are essentially transposed versions of the GENE-to-Disease/Phenotype summaries (Tables S1 & S2) that allow different types of comparisons. These are non-redundant lists of phenotype keywords, MeSH disease terms in the case of human and Mammalian Phenotype Terms (MP) in the case of mouse, followed by the genes associated or annotated to those disease phenotype keywords.
Human
Table 7 shows examples of selected human disease phenotypes in each row positively associated with specific human genes for 8 major MeSH disease classes including cardiovascular, digestive system diseases, diseases of environmental origin, immune system diseases, mental disorders, nervous system diseases, nutritional and metabolic diseases, and eye diseases. Each Mesh phenotype term is followed by the number of times that a specific disease term has been positively associated with a particular gene in each row, in decreasing order. Table 7 is a small representative set, truncated in the number of disease phenotypes (rows) and the number of genes (columns). The complete list of 1,318 MeSH disease phenotype terms with additional information can be found in Table S4a[37]. An interactive version of the complete list can be found in Table S4b[38].
Mouse
Tables 8 and S5 constitute the mouse DISEASE/PHENOTYPE-to-Gene summaries. Table 8 consists of selected mouse phenotypes which fall into similar general classes of the human table 7 followed by 6 representative genes that have been assigned to the appropriate phenotypic term due to a specific mouse genetic model. Unlike the human Disease/Phenotype-to-gene tables 7 and S4, the mouse tables 8 and S5 do not have quantitative information. Table 8 is also a small representative set, truncated in the number of disease phenotypes (rows) and the number of genes (columns). The complete list of 5,142 mouse phenotype terms with their corresponding Mammalian PhenoCode designations can be found in Table S5a[39]. An interactive version of the complete list can be found in Table S5b[40].
Using disease and gene lists
The purpose of this project is not simply to generate lists and information. It is to provide a distillation of disease and phenotype information that can be used in dissecting the complexities of human disease and mouse biology. Now that we have generated GENE-to-disease/phenotype summaries and DISEASE/PHENOTYPE-to-gene summaries for both mouse and human, they can be used for systematic analysis, comparison, and integrating of orthologous data with the goal of providing higher order interpretations of human disease and mouse genetically determined phenotypes.
Human disease and mouse phenotype based gene sets
Gene sets have been defined simply as groups of genes that share common biological function, chromosomal location, or regulation[41]. Gene sets are used in high-throughput systematic analysis of microarray data using a priori knowledge. Unlike previously defined gene sets based on biological pathways or differentially expressed genes[41], GAD disease gene sets are unique in that they are composed of genes that have been previously shown to be both polymorphic and have been determined to be genetically positively associated with a specific disease phenotype in a human population based genetic association study. Similarly, Table S5a[39] the mouse DISEASE/PHENOTYPE-to-Gene list is used as a source for gene sets for mouse phenotypes (MP gene sets) comprised of unique gene based mouse genetic models. These gene set files are currently the largest set of gene set files publicly available and the only gene sets files where each gene is based on direct human or mouse genetic studies.
Comparison of individual GAD disease gene sets
One aspect of common complex disease is that the development of disease and disease phenotypes quite often present along a broad spectrum of symptoms and share clinical characteristics, endo-phenotypes, or quantitative traits with closely related disorders [25]. This is evident in gene sharing, as mentioned above, and equally in the overlap of biological pathways between related disorders. Using GAD disease gene sets, Venn diagram comparisons among related disorders shows modest gene sharing. However, when gene sets are then placed into biological pathways and compared by Venn analysis, there is a marked increase in the overlap in pathways between related disorders. This was not found in gene sets from unrelated disorders. For example, major autoimmune disorders quite often share endophenotypes of lymphoproliferation, autoantibody production, and alterations in apoptosis, as well as other immune cellular and biochemical aberrations. As shown in Figure 1a, genes that have been positively associated with type 1 diabetes, rheumatoid arthritis, and Crohn's disease show a modest overlap. However, when individual gene sets are fitted into biological pathways, then compared for overlap of pathway membership, there is a striking increase in the overlap at the pathway level. This is true in a comparison of gene and pathways for type 2 diabetes, insulin resistance, and obesity as well (Figure 1b). This pattern of major pathway overlap does not seem to occur between unrelated disorders, such as insulin resistance, rheumatoid arthritis and bipolar disorder (Figure 1c). This disease related sharing at the pathway level suggests common regulatory mechanisms between these disorders and that the original positive associations are not necessarily due to random chance alone.
Figure 1.

Venn Diagram analysis of individual GAD disease gene sets (circles) versus pathways (rectangles) produced from the corresponding gene set. All Venn Diagrams were produced with Venny http://bioinfogp.cnb.csic.es/tools/venny/index.html.
Group analysis of GAD disease gene sets between major classes of disease/phenotypes
Dendrogram analysis of human disease gene sets
As archival information grows, analysis of complex molecular and genetic datasets using clustering or network approaches has become increasingly more useful [13,42-45]. Therefore, in addition to comparisons between individual diseases using human and mouse gene sets, we analyzed large gene groups using dendrogram and clustering approaches based on gene sharing between gene sets. Figure 2 shows a broad based dendrogram comparison based on gene sharing between 480 GAD disease gene sets, using gene sets each containing at least 3 genes. A striking feature of this analysis is that at a coarse level, major disease groups cluster together in space demonstrating shared genes between major clinically important disease groups. Disease domains are represented by groups such as cardiovascular disorders, metabolic disorders, cancer, immune and inflammatory disorders, vision, and chemical dependency. At finer detail within a specific broader group, it becomes clear that individual diseases with overlapping phenotypes are found close in space, such as asthma, allergic rhinitis, and atopic dermatitis. This overlap due to gene sharing recapitulates an overlap in clinical characteristics between these related disorders. Similarly, phenotypes within the metabolic group related to diabetes are closely aligned in space including; insulin resistance, hyperglycemia, hyperinsulinemia, and hyperlipidemia. This close apposition of related disease phenotypes and sub-phenotypes at both a coarse and fine level is a consistent feature of the overall display. The human gene sets used in creating this tree diagram can be found in Table S6[46]. It is important to emphasize that this display and the distance relationships between diseases are calculated through an unbiased gene-sharing algorithm independent of disease phenotype labels and not as a result of an imposed logical hierarchy or an ontological annotation system. This grouping of major disease phenotypes based solely on gene sharing provides supporting evidence that the underlying disease based gene sets may have a fundamental relevance to disease and may not be reported in the literature by chance alone.
Figure 2.

Human dendrogram comparison of 480 GAD disease gene sets based on gene sharing. The input GAD gene set file for this figure can be found in Table S6[46].
Dendrogram analysis of mouse phenotypic gene sets
Figure 3 is a similar dendrogram to the human tree using 1056 mouse phenotypic gene sets, using gene sets each containing at least 10 genes. This was produced using the same gene sharing algorithm as for the human gene sets in Figure 2. As with the human dendrogram, the mouse tree displays informative groupings at both a coarse and fine level. This tree groups into major groupings nominally assigned as brain development and brain function, embryonic development, cardiovascular, reproduction, inflammation, renal function, bone development, metabolism, and skin/hair development. The identification of major groupings emphasizing developmental processes reflects the emphasis of gene knockouts and developmental models resulting in observable morphological traits and less so with regard to end stage clinical diseases as in the human dendrogram. Like the human dendrogram (Figure 2) discrete major functional groupings in the mouse dendrogram suggests that individual experimental observations are not random. Fundamental complex processes such as metabolism, cardiovascular phenomena, and developmental processes are integrated by extensive sharing of related pliotropic genes. Moreover, like the human tree, fine structure in the mouse tree shows related mouse phenotypes are closely positioned in space. For example, in the metabolism major grouping, the individual phenotypes of body mass, adipose phenotypes, and weight gain are closely positioned. Similarly, in the brain function group, the behavioral phenotypes of anxiety, exploration, and responses to novel objects are found next to one another. This pattern is a fundamental feature of this tree. Like the human tree, the mouse dendrogram shown here is based solely on a gene sharing algorithm using genes assigned to individual phenotypes. It is not based on an imposed predetermined hierarchy or ontology. Importantly, unlike the human tree, the information contained in the mouse tree is derived from individual independent mouse genetic studies and phenotypic observations and not from large case controlled population based epidemiological studies. Controversial issues such as publication bias or study size which confound human genetic association studies are not as relevant here in the context of studies of experimentally determined individual mouse gene knockouts and related studies. The mouse gene sets used in creating this tree diagram can be found in Table S7[47].
Figure 3.
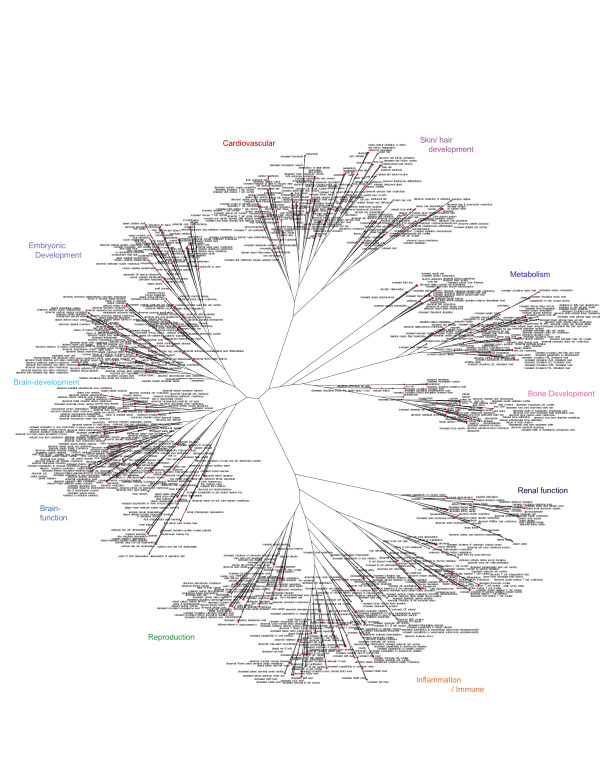
Mouse dendrogram comparison of 1056 mouse phenotype (MP) gene sets based on gene sharing. The input MP gene set file for this figure can be found in Table S7[47].
Hierarchical clustering of human and mouse gene sets
Hierarchical clustering has become a common tool in the analysis of large molecular data sets[48] allowing identification of similar patterns in a scalable fashion from the whole experiment down to a level of fine structure. To provide further evidence of disease relevance and biological content contained in both the human and mouse gene sets hierarchical clustering was performed on both human and mouse. Four hundred and eighty human gene sets were clustered producing 46 major disease clusters. In the mouse, clustering was performed on 2067 mouse phenotype gene sets, using gene sets containing at least 3 genes. This resulted in 165 major subgroups of functional phenotypic specificity. Hierarchical clustering is shown for human [Additional file 1 and Additional file 2] and for mouse [Additional file 3 and Additional file 4]. Like the human and mouse dendograms, this hierarchical clustering showed functional disease grouping at both a coarse group level and at a fine level within major phenotypic groupings. These clusters in both human and mouse falling into closely defined broad functional groups as well as closely related clinical, physiological, and developmental phenotypes demonstrates a general pattern of relevance to disease in their original underlying genetic associations. As in the dendrogram displays, this suggests that the genes nominally positively associated to these disorders, drawn from the medical literature, are not pervasively randomly assigned or due to a widespread pattern of random false positives associations.
Discussion and Conclusion
This report describes a summary of the positive genetic associations to disease phenotypes found in the Genetic Association Database as well as a summary of mouse genetically determined phenotypes from the MGI phenotypes database. The genes and disease lists described here were derived from a broad literature mining approach. We have shown disease relevance in three distinct ways; a) in comparing individual gene lists and pathways, b) comparing between species and, c) in broad based comparative analysis utilizing complex systems approaches. Moreover, we identify disease based genes sets for 1,317 human disease phenotypes as well as 5,142 mouse experimentally determined phenotypes. These resources are the largest gene set files currently publicly available and the only gene set files derived from population based human epidemiological genetic studies and mouse genetic models of disease.
Each individual GAD disease gene set (i.e. a single disease term followed by a string of genes) or mouse phenotype gene set becomes a candidate for a number of uses and applications including:
a) contributing to complex (additive, multiplicative, gene-environment) statistical models for any given disease phenotype [49-53]; b) use in comparative analysis of disease between disease phenotypes; c) use in interrogating other related data types, such as microarray (see below), proteomic, or SNP data [54-56]; and d) integration into annotation engines[57] or genome browsers[58] or other analytical software to add disease information in comparative genomic analysis. In a sense, each individual human or mouse disease/phenotype gene set becomes a unique hypothesis, testable in a variety of ways. Increasingly, combinations of genes may have important predictive value as combinatorial biomarkers in predicting disease risk as opposed to single candidate genes [59,60].
In addition, in an ongoing parallel set of experiments, using a Gene Set Analysis (GSA) approach using the web tool Disease/Phenotype web-PAGE, in the analysis of orthologous microarray data (De S, Zhang Y, Garner JR, Wang SA, Becker KG: Disease and phenotype gene set analysis of disease based gene expression, unpublished), both the human and mouse disease/phenotype gene sets defined above demonstrate striking disease specificity in PAGE[61] gene set analysis of previously published microarray based gene expression studies from numerous independent laboratories in both a species specific and cross species manner. This was true when studying gene expression studies of type 2 diabetes, obesity, myocardial infarction and sepsis, among others, providing further evidence of the disease and clinical relevance of both the human and mouse gene sets.
This approach is limited in a number of ways. In particular, the GAD database compares the results of human population based epidemiological studies performed using different sample sizes, populations, statistical models, and at different times over approximately the last 16 years. In addition, the GAD database draws on association studies of broad quality with different degrees of detail provided. Although all human genetic association studies discussed here have been individually determined to be positively associated with a disease or phenotype in a peer reviewed journal, we make no assertion that any individual study is correct and we recognize the controversy in the genetics community regarding statistical and biological significance of genetic association studies. Moreover, although the GAD database contains information on polymorphism and variation, and each GAD record is fundamentally based on polymorphism, this report does not consider variation or polymorphism in the summaries shown. Likewise, mouse genetic models in many cases are weighted to gene knockouts which may not be necessarily be directly representative of multifactorial human common complex disease.
However, even with these limitations, we believe valuable insights can be gained from broad based literature assessments of the genetic contribution in human common complex disease and in mouse phenotypic biology. More importantly, this suggests greater opportunities for systematic mining and analysis of published data and in cross comparison of archival molecular databases in both human and animal models of disease with regard to genetic variation, population comparisons, and integration with many different types of orthologous information.
Abbreviations
GAD: Genetic Association Database; MGI: Mouse Genome Informatics; MeSH: Medical Subject Headings; GWAS: Genome Wide Association Study; CDC: Centers for Disease Control and Prevention; HuGENet: Human Genome Epidemiology Network.
Competing interests
The authors declare that they have no competing interests.
Authors' contributions
YZ performed statistical analysis, gene set assembly, and contributed to the manuscript. SD performed dendrogram and clustering analysis and contributed to the manuscript. JG, KS, and SAW did database curation and analysis. KGB organized the project, did database curation, performed comparisons, and wrote the manuscript. All authors read and approved the manuscript.
Pre-publication history
The pre-publication history for this paper can be accessed here:
Supplementary Material
Hierarchical clustering of 480 Human GAD disease gene sets. This file contains a display of hierarchical clustering of 480 Human GAD disease gene sets, each gene set contain at least 3 genes each.
Individual human disease functional clusters. This file contains selected subsets of Additional File 1 including; a. tumorigenesis, b. autoimmune, c. cardiovascular, d. metabolism, and e. behavior.
Hierarchical clustering of 2067 Mouse phenotypic gene sets. This file contains a display of hierarchical clustering of 2067 Mouse phenotypic gene sets, each gene set contain at least 10 genes each.
Individual mouse phenotypic functional clusters. This file contains selected subsets of Additional File 2 including; a. immune function, b. metabolism, c. neurological function/behavior, d. DNA replication/tumorigenesis, e. development and f. cardiovascular.
Contributor Information
Yonqing Zhang, Email: zhangyon@grc.nia.nih.gov.
Supriyo De, Email: desu@grc.nia.nih.gov.
John R Garner, Email: garnerjr@nia.nih.gov.
Kirstin Smith, Email: keersteen@yahoo.com.
S Alex Wang, Email: wangal@mail.nih.gov.
Kevin G Becker, Email: beckerk@grc.nia.nih.gov.
Acknowledgements
The authors would like to thank Dr. Ilya Goldberg for helpful discussions, and Drs. Goldberg, David Schlessinger, and Chris Cheadle and for critical reading of the manuscript.
This research was supported by the Intramural Research Program of the NIH, National Institute on Aging and Center for Information Technology.
References
- Eyre TA, Ducluzeau F, Sneddon TP, Povey S, Bruford EA, Lush MJ. The HUGO Gene Nomenclature Database, 2006 updates. Nucleic Acids Res. 2006. pp. D319–321. [DOI] [PMC free article] [PubMed]
- Becker KG, Barnes KC, Bright TJ, Wang SA. The genetic association database. Nat Genet. 2004;36(5):431–432. doi: 10.1038/ng0504-431. [DOI] [PubMed] [Google Scholar]
- Lin BK, Clyne M, Walsh M, Gomez O, Yu W, Gwinn M, Khoury MJ. Tracking the epidemiology of human genes in the literature: the HuGE Published Literature database. Am J Epidemiol. 2006;164(1):1–4. doi: 10.1093/aje/kwj175. [DOI] [PubMed] [Google Scholar]
- Bult CJ, Eppig JT, Kadin JA, Richardson JE, Blake JA. The Mouse Genome Database (MGD): mouse biology and model systems. Nucleic Acids Res. 2008. pp. D724–728. [DOI] [PMC free article] [PubMed]
- Hancock JM, Adams NC, Aidinis V, Blake A, Bogue M, Brown SD, Chesler EJ, Davidson D, Duran C, Eppig JT. Mouse Phenotype Database Integration Consortium: integration [corrected] of mouse phenome data resources. Mamm Genome. 2007;18(3):157–163. doi: 10.1007/s00335-007-9004-x. [DOI] [PMC free article] [PubMed] [Google Scholar]
- McKusick VA. Mendelian Inheritance in Man and its online version, OMIM. Am J Hum Genet. 2007;80(4):588–604. doi: 10.1086/514346. [DOI] [PMC free article] [PubMed] [Google Scholar]
- Adie EA, Adams RR, Evans KL, Porteous DJ, Pickard BS. SUSPECTS: enabling fast and effective prioritization of positional candidates. Bioinformatics. 2006;22(6):773–774. doi: 10.1093/bioinformatics/btk031. [DOI] [PubMed] [Google Scholar]
- Yue P, Melamud E, Moult J. SNPs3D: candidate gene and SNP selection for association studies. BMC Bioinformatics. 2006;7:166. doi: 10.1186/1471-2105-7-166. [DOI] [PMC free article] [PubMed] [Google Scholar]
- Smink LJ, Helton EM, Healy BC, Cavnor CC, Lam AC, Flamez D, Burren OS, Wang Y, Dolman GE, Burdick DB. T1DBase, a community web-based resource for type 1 diabetes research. Nucleic Acids Res. 2005. pp. D544–549. [DOI] [PMC free article] [PubMed]
- Sherman BT, Huang DW, Tan Q, Guo Y, Bour S, Liu D, Stephens R, Baseler MW, Lane HC, Lempicki RA. DAVID Knowledgebase: a gene-centered database integrating heterogeneous gene annotation resources to facilitate high-throughput gene functional analysis. BMC Bioinformatics. 2007;8(1):426. doi: 10.1186/1471-2105-8-426. [DOI] [PMC free article] [PubMed] [Google Scholar]
- Yi M, Horton JD, Cohen JC, Hobbs HH, Stephens RM. WholePathwayScope: a comprehensive pathway-based analysis tool for high-throughput data. BMC Bioinformatics. 2006;7:30. doi: 10.1186/1471-2105-7-30. [DOI] [PMC free article] [PubMed] [Google Scholar]
- Jegga AG, Chen J, Gowrisankar S, Deshmukh MA, Gudivada R, Kong S, Kaimal V, Aronow BJ. GenomeTrafac: a whole genome resource for the detection of transcription factor binding site clusters associated with conventional and microRNA encoding genes conserved between mouse and human gene orthologs. Nucleic Acids Res. 2007. pp. D116–121. [DOI] [PMC free article] [PubMed]
- Butte AJ, Kohane IS. Creation and implications of a phenome-genome network. Nat Biotechnol. 2006;24(1):55–62. doi: 10.1038/nbt1150. [DOI] [PMC free article] [PubMed] [Google Scholar]
- VENNY. An interactive tool for comparing lists with Venn Diagrams. http://bioinfogp.cnb.csic.es/tools/venny/index.html
- Zhang B, Kirov S, Snoddy J. WebGestalt: an integrated system for exploring gene sets in various biological contexts. Nucleic Acids Res. 2005. pp. W741–748. [DOI] [PMC free article] [PubMed]
- PHYLIP. http://evolution.gs.washington.edu/phylip.html
- Fitch WM, Margoliash E. Construction of phylogenetic trees. Science. 1967;155(760):279–284. doi: 10.1126/science.155.3760.279. [DOI] [PubMed] [Google Scholar]
- Choi JH, Jung HY, Kim HS, Cho HG. PhyloDraw: a phylogenetic tree drawing system. Bioinformatics. 2000;16(11):1056–1058. doi: 10.1093/bioinformatics/16.11.1056. [DOI] [PubMed] [Google Scholar]
- Ward J. Hierarchical Grouping to optimize an objective function. Journal of American Statistical Association. 1963;58(301):236–244. doi: 10.2307/2282967. [DOI] [Google Scholar]
- Table S1a-Human GENE-to-Disease/Phenotype. A file of Human Genes followed by Disease Phenotype MeSH terms. http://www.grc.nia.nih.gov/branches/rrb/dna/data/table-s1-a.txt
- Table S1b-Human GENE-to-Disease/Phenotype interactive. The same list as Table S1a, but with direct searches back to GAD. http://www.grc.nia.nih.gov/branches/rrb/dna/data/table-s1-b.html
- Ioannidis JP. Why most published research findings are false. PLoS Med. 2005;2(8):e124. doi: 10.1371/journal.pmed.0020124. [DOI] [PMC free article] [PubMed] [Google Scholar]
- Khoury MJ, Little J, Gwinn M, Ioannidis JP. On the synthesis and interpretation of consistent but weak gene-disease associations in the era of genome-wide association studies. Int J Epidemiol. 2007;36(2):439–445. doi: 10.1093/ije/dyl253. [DOI] [PubMed] [Google Scholar]
- Becker KG, Simon RM, Bailey-Wilson JE, Freidlin B, Biddison WE, McFarland HF, Trent JM. Clustering of non-major histocompatibility complex susceptibility candidate loci in human autoimmune diseases. Proc Natl Acad Sci USA. 1998;95(17):9979–9984. doi: 10.1073/pnas.95.17.9979. [DOI] [PMC free article] [PubMed] [Google Scholar]
- Becker KG. The common variants/multiple disease hypothesis of common complex genetic disorders. Med Hypotheses. 2004;62(2):309–317. doi: 10.1016/S0306-9877(03)00332-3. [DOI] [PubMed] [Google Scholar]
- Lee YH, Rho YH, Choi SJ, Ji JD, Song GG, Nath SK, Harley JB. The PTPN22 C1858T functional polymorphism and autoimmune diseases--a meta-analysis. Rheumatology (Oxford) 2007;46(1):49–56. doi: 10.1093/rheumatology/kel170. [DOI] [PubMed] [Google Scholar]
- Plenge RM, Padyukov L, Remmers EF, Purcell S, Lee AT, Karlson EW, Wolfe F, Kastner DL, Alfredsson L, Altshuler D. Replication of putative candidate-gene associations with rheumatoid arthritis in >4,000 samples from North America and Sweden: association of susceptibility with PTPN22, CTLA4, and PADI4. Am J Hum Genet. 2005;77(6):1044–1060. doi: 10.1086/498651. [DOI] [PMC free article] [PubMed] [Google Scholar]
- Wang X, Kim J, McWilliams R, Cutting GR. Increased prevalence of chronic rhinosinusitis in carriers of a cystic fibrosis mutation. Arch Otolaryngol Head Neck Surg. 2005;131(3):237–240. doi: 10.1001/archotol.131.3.237. [DOI] [PubMed] [Google Scholar]
- Bresso F, Askling J, Astegiano M, Demarchi B, Sapone N, Rizzetto M, Gionchetti P, Lammers KM, de Leone A, Riegler G. Potential role for the common cystic fibrosis DeltaF508 mutation in Crohn's disease. Inflamm Bowel Dis. 2007;13(5):531–536. doi: 10.1002/ibd.20067. [DOI] [PubMed] [Google Scholar]
- Table S2a-Mouse GENE-to-Disease/Phenotype. A file of Mouse Genes followed by Disease Phenotype Mammalian Phenotype (MP) terms. http://www.grc.nia.nih.gov/branches/rrb/dna/data/table-s2-a.txt
- Table S2b-Mouse GENE-to-Disease/Phenotype interactive. The same list as Table S2a, but with direct searches back to MGI and GAD. http://www.grc.nia.nih.gov/branches/rrb/dna/data/table-s2-b.html
- Harris SE, Chand AL, Winship IM, Gersak K, Nishi Y, Yanase T, Nawata H, Shelling AN. INHA promoter polymorphisms are associated with premature ovarian failure. Mol Hum Reprod. 2005;11(11):779–784. doi: 10.1093/molehr/gah219. [DOI] [PubMed] [Google Scholar]
- Wu X, Chen L, Brown CA, Yan C, Matzuk MM. Interrelationship of growth differentiation factor 9 and inhibin in early folliculogenesis and ovarian tumorigenesis in mice. Mol Endocrinol. 2004;18(6):1509–1519. doi: 10.1210/me.2003-0399. [DOI] [PubMed] [Google Scholar]
- Gharani N, Benayed R, Mancuso V, Brzustowicz LM, Millonig JH. Association of the homeobox transcription factor, ENGRAILED 2, 3, with autism spectrum disorder. Mol Psychiatry. 2004;9(5):474–484. doi: 10.1038/sj.mp.4001498. [DOI] [PubMed] [Google Scholar]
- Cheh MA, Millonig JH, Roselli LM, Ming X, Jacobsen E, Kamdar S, Wagner GC. En2 knockout mice display neurobehavioral and neurochemical alterations relevant to autism spectrum disorder. Brain Res. 2006;1116(1):166–176. doi: 10.1016/j.brainres.2006.07.086. [DOI] [PubMed] [Google Scholar]
- Table S3-Human-Mouse Gene Overlap. A list of 1105 genes that overlap between the Human GENE-to-Disease Phenotype list (S1) and the Mouse GENE-to-Disease phenotype list (S2) http://www.grc.nia.nih.gov/branches/rrb/dna/data/table-s3.txt
- Table S4a-Human DISEASE/PHENOTYPE-to-Gene. A file of Human Disease Phenotype MeSH terms followed by associated genes. http://www.grc.nia.nih.gov/branches/rrb/dna/data/table-s4-a.txt
- Table S4b-Human DISEASE/PHENOTYPE-to-Gene Interactive. A file of Human Disease Phenotype MeSH terms followed by associated genes, but with direct searches back to GAD. http://www.grc.nia.nih.gov/branches/rrb/dna/data/table-s4-b.html
- Table S5a-Mouse DISEASE/PHENOTYPE-to-Gene (mouse). A file of Mouse Disease-Phenotype Mammalian Phenotype (MP) terms followed by assigned mouse genes. http://www.grc.nia.nih.gov/branches/rrb/dna/data/table-s5-a.txt
- Table S5b-Mouse DISEASE/PHENOTYPE-to-Gene (mouse) Interactive. A file of Mouse Disease-Phenotype Mammalian Phenotype (MP) terms followed by assigned mouse genes, but with direct searches back to MGI. http://www.grc.nia.nih.gov/branches/rrb/dna/data/table-s5-b.html
- Subramanian A, Tamayo P, Mootha VK, Mukherjee S, Ebert BL, Gillette MA, Paulovich A, Pomeroy SL, Golub TR, Lander ES. Gene set enrichment analysis: a knowledge-based approach for interpreting genome-wide expression profiles. Proc Natl Acad Sci USA. 2005;102(43):15545–15550. doi: 10.1073/pnas.0506580102. [DOI] [PMC free article] [PubMed] [Google Scholar]
- Liu M, Liberzon A, Kong SW, Lai WR, Park PJ, Kohane IS, Kasif S. Network-based analysis of affected biological processes in type 2 diabetes models. PLoS Genet. 2007;3(6):e96. doi: 10.1371/journal.pgen.0030096. [DOI] [PMC free article] [PubMed] [Google Scholar]
- Goh KI, Cusick ME, Valle D, Childs B, Vidal M, Barabasi AL. The human disease network. Proc Natl Acad Sci USA. 2007;104(21):8685–8690. doi: 10.1073/pnas.0701361104. [DOI] [PMC free article] [PubMed] [Google Scholar]
- Emilsson V, Thorleifsson G, Zhang B, Leonardson AS, Zink F, Zhu J, Carlson S, Helgason A, Walters GB, Gunnarsdottir S. Genetics of gene expression and its effect on disease. Nature. 2008;452(7186):423–428. doi: 10.1038/nature06758. [DOI] [PubMed] [Google Scholar]
- Guan Y, Myers CL, Lu R, Lemischka IR, Bult CJ, Troyanskaya OG. A genomewide functional network for the laboratory mouse. PLoS Comput Biol. 2008;4(9):e1000165. doi: 10.1371/journal.pcbi.1000165. [DOI] [PMC free article] [PubMed] [Google Scholar]
- Table S6-Human Dendrogram Gene Sets. A file of the GAD Human gene sets used in the dendrogram fig 2. http://www.grc.nia.nih.gov/branches/rrb/dna/data/table-s6.txt
- Table S7-Mouse Dendrogram Gene Sets. A file of the Mouse gene sets used to build the mouse dendrogram fig 3. http://www.grc.nia.nih.gov/branches/rrb/dna/data/table-s7.txt
- Eisen MB, Spellman PT, Brown PO, Botstein D. Cluster analysis and display of genome-wide expression patterns. Proc Natl Acad Sci USA. 1998;95(25):14863–14868. doi: 10.1073/pnas.95.25.14863. [DOI] [PMC free article] [PubMed] [Google Scholar]
- Evans DM, Visscher PM, Wray NR. Harnessing the information contained within genome-wide association studies to improve individual prediction of complex disease risk. Hum Mol Genet. 2009;18(18):3525–3531. doi: 10.1093/hmg/ddp295. [DOI] [PubMed] [Google Scholar]
- Wray NR, Goddard ME, Visscher PM. Prediction of individual genetic risk of complex disease. Curr Opin Genet Dev. 2008;18(3):257–263. doi: 10.1016/j.gde.2008.07.006. [DOI] [PubMed] [Google Scholar]
- Heidema AG, Boer JM, Nagelkerke N, Mariman EC, van der AD, Feskens EJ. The challenge for genetic epidemiologists: how to analyze large numbers of SNPs in relation to complex diseases. BMC Genet. 2006;7:23. doi: 10.1186/1471-2156-7-23. [DOI] [PMC free article] [PubMed] [Google Scholar]
- Mei H, Cuccaro ML, Martin ER. Multifactor dimensionality reduction-phenomics: a novel method to capture genetic heterogeneity with use of phenotypic variables. Am J Hum Genet. 2007;81(6):1251–1261. doi: 10.1086/522307. [DOI] [PMC free article] [PubMed] [Google Scholar]
- Slatkin M. Exchangeable models of complex inherited diseases. Genetics. 2008;179(4):2253–2261. doi: 10.1534/genetics.107.077719. [DOI] [PMC free article] [PubMed] [Google Scholar]
- Chasman DI. On the utility of gene set methods in genomewide association studies of quantitative traits. Genet Epidemiol. 2008;32(7):658–668. doi: 10.1002/gepi.20334. [DOI] [PubMed] [Google Scholar]
- Holden M, Deng S, Wojnowski L, Kulle B. GSEA-SNP: applying gene set enrichment analysis to SNP data from genome-wide association studies. Bioinformatics. 2008;24(23):2784–2785. doi: 10.1093/bioinformatics/btn516. [DOI] [PubMed] [Google Scholar]
- Chai HS, Sicotte H, Bailey KR, Turner ST, Asmann YW, Kocher JP. GLOSSI: a method to assess the association of genetic loci-sets with complex diseases. BMC Bioinformatics. 2009;10(1):102. doi: 10.1186/1471-2105-10-102. [DOI] [PMC free article] [PubMed] [Google Scholar]
- Huang da W, Sherman BT, Zheng X, Yang J, Imamichi T, Stephens R, Lempicki RA. Extracting biological meaning from large gene lists with DAVID. Curr Protoc Bioinformatics. 2009;Chapter 13(Unit 13):11. doi: 10.1002/0471250953.bi1311s27. [DOI] [PubMed] [Google Scholar]
- Kuhn RM, Karolchik D, Zweig AS, Wang T, Smith KE, Rosenbloom KR, Rhead B, Raney BJ, Pohl A, Pheasant M. The UCSC Genome Browser Database: update 2009. Nucleic Acids Res. 2009. pp. D755–761. [DOI] [PMC free article] [PubMed]
- Ray S, Britschgi M, Herbert C, Takeda-Uchimura Y, Boxer A, Blennow K, Friedman LF, Galasko DR, Jutel M, Karydas A. Classification and prediction of clinical Alzheimer's diagnosis based on plasma signaling proteins. Nat Med. 2007;13(11):1359–1362. doi: 10.1038/nm1653. [DOI] [PubMed] [Google Scholar]
- Zheng SL, Sun J, Wiklund F, Smith S, Stattin P, Li G, Adami HO, Hsu FC, Zhu Y, Balter K. Cumulative Association of Five Genetic Variants with Prostate Cancer. N Engl J Med. 2008;358(9):910–9. doi: 10.1056/NEJMoa075819. [DOI] [PubMed] [Google Scholar]
- Kim SY, Volsky DJ. PAGE: parametric analysis of gene set enrichment. BMC Bioinformatics. 2005;6:144. doi: 10.1186/1471-2105-6-144. [DOI] [PMC free article] [PubMed] [Google Scholar]
Associated Data
This section collects any data citations, data availability statements, or supplementary materials included in this article.
Supplementary Materials
Hierarchical clustering of 480 Human GAD disease gene sets. This file contains a display of hierarchical clustering of 480 Human GAD disease gene sets, each gene set contain at least 3 genes each.
Individual human disease functional clusters. This file contains selected subsets of Additional File 1 including; a. tumorigenesis, b. autoimmune, c. cardiovascular, d. metabolism, and e. behavior.
Hierarchical clustering of 2067 Mouse phenotypic gene sets. This file contains a display of hierarchical clustering of 2067 Mouse phenotypic gene sets, each gene set contain at least 10 genes each.
Individual mouse phenotypic functional clusters. This file contains selected subsets of Additional File 2 including; a. immune function, b. metabolism, c. neurological function/behavior, d. DNA replication/tumorigenesis, e. development and f. cardiovascular.