Abstract

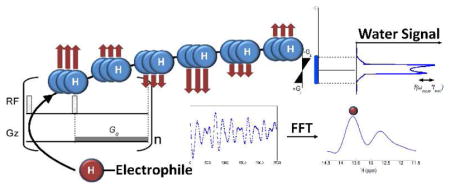
We report an “exchange-rate-filtered” magnetic resonance approach that allows the detection of exchangeable protons of low concentration solutes without interference of non-exchanging protons. This indirect detection of signals of multiple rapidly exchanging protons through the water signal can be achieved while retaining chemical shift specificity and increasing sensitivity by several orders of magnitude with respect to standard spectroscopy. This frequency labeled exchange (FLEX) transfer principle is applied to detect previously “invisible” protons of some nucleic acids, and peptides, as well as rapidly exchanging protons (k > 300s−1) in so-called chemical exchange saturation transfer (CEST) MRI contrast agents. FLEX methodology is expected to provide a practical approach for the study of highly dynamic regions of nucleic acids and proteins where amide, amino and imino groups are rapidly moving between a closed solvent inaccessible state and an exposed state where exchange occurs. This alternative type of labeling and detecting exchangeable protons is also expected to greatly benefit the development of new exchange-based MRI contrast agents, providing a method for multi-frequency detection using frequency transfer instead of saturation transfer.
Exchangeable protons have played an invaluable role in NMR studies of protein and nucleic acid structure and dynamics.1–3 Detection of such solute protons (s) is governed by the “slow exchange” condition, where the frequency difference with water protons, Δωsw, is larger than the exchange rate, ks. However, the broad resonances of such protons are often “invisible”, because they are either obscured by larger and narrower signals of other protons, or hidden in the noise. We report an “exchange-rate-filtered” approach that allows the detection of such protons without interference of non-exchanging protons. Also, the transfer of these protons to water is exploited to achieve a sensitivity enhancement of several orders of magnitude with respect to standard spectroscopy. This new frequency labeled exchange (FLEX) transfer principle is applied to detect previously “invisible” protons of some nucleic acids and peptides, as well as rapidly exchanging protons (ks > 300s−1) in so-called chemical exchange saturation transfer (CEST) MRI contrast agents.4–7 Using the FLEX approach, this latter detection can be achieved without the need for proton saturation and without need for additional postprocessing to separate the agent signals from background signals due to direct water saturation or due to interfering slower magnetization transfer effects.
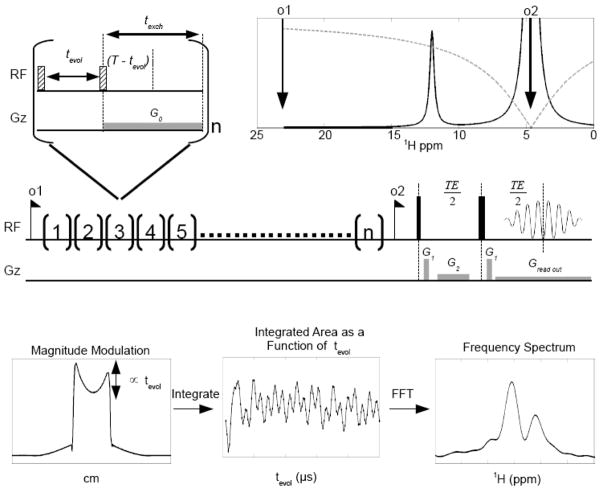
The basic FLEX pulse sequence (Fig. 1) consists of a series of label-transfer modules (LTMs) in which exchangeable solute protons are frequency labeled and subsequently transferred to water. We use the general term “label”, because frequency is not the only encoding type that can be used, with other examples being saturation or inversion. Here, we employ binomial frequency labeling using a pair of selective 90x/90−x RF pulses, in which chemical shift evolution of the exchangeable protons during the period, tevol, is followed by storage of the frequency information in the form of longitudinal magnetization. Subsequently, a waiting period, texch, is applied to allow exchange transfer to the solvent, where labeled protons are stored longer-term as water protons. This is a favorable situation, because the water longitudinal relaxation time is fairly long (T1w ≈ 1–4s), and the water proton pool is so large that the probability of a labeled proton going back to the solute (μM – mM concentration) is small. Signal amplification occurs because fresh z-magnetization is present for the solute protons at the start of each LTM, allowing multiple opportunities to transfer labeled protons to the solvent when applying multiple (n) modules during the preparation time, tprep. The sensitivity enhancement factor for this process, η, is given by:
| [1] |
reflecting that magnetization transferred in the first LTM will experience T1w decay over the full tprep, while that transferred in the nth module will hardly relax. In practice the enhancement will be less, because exchange during texch need not be complete, and label may be lost due to incomplete excitation. Correcting for this with efficiency factors for exchange transfer and labeling, βs = [1 − exp(−ks · texch)] and λs, respectively, the proton transfer ratio, PTRs, and the effective enhancement factor, PTEs, can then be defined as:
| [2] |
in which [H] is the proton concentration. The factor λs depends on the excitation profile a pair of rectangular 90° pulses of limited bandwidth, which will be shaped as a function of Δωso1, the frequency difference between the transmitter offset of the RF pulses and the solute protons. The profile of such an excitation can be measured or calculated (Supporting Information), and the result squared to obtain λs.
Figure 1.
Frequency Labeled Exchange (FLEX) transfer detection of labile protons. A series of n Label Transfer Modules (LTMs) is applied, each containing periods for chemical shift evolution of transverse magnetization (tevol) and for exchange transfer of longitudinal magnetization (texch). The evolution time is varied for frequency encoding, here using a constant time (T) approach. Short 90° pulses (small hatched rectangles, 50–100μs) at an offset (o1) are used to selectively excite solute protons. Note that texch should be sufficiently long for most protons to exchange even at the longest. tevol. To avoid radiation damping a gradient G0 is applied during texch and the signal is acquired using a readout gradient, providing a projection of the sample in distance units. The magnitude of this projection is modulated as a function of evolution time due to exchange transfer, which can be reconstructed as a free induction decay (FID) of amplitude PTRs containing signal of the exchangeable protons. A Fourier transform provides the spectrum.
In contrast to a CEST experiment, where solute protons are continuously saturated and transferred to water, no RF saturation is used in FLEX transfer, but an amount of signal loss is transferred that depends on the length of chemical shift evolution during tevol. Defining the signal loss after a π/2 evolution as Sav, and the original water intensity as S0, the water signal loss at a certain tevol can be described by:
| [3] |
The water attenuation will include the effect of exchangeable protons of all solutes, and the first intuitive interpretation would be that specificity should be lost because all labeled protons will end up resonating at the water frequency. The strength of FLEX is that extraction of the individual frequency information for a given exchanging proton can be achieved by performing the labeling as a function of tevol. This causes a magnitude modulation of the water signal that depends on the frequencies of all labeled exchangeable solute protons. In contrast to conventional multi-dimensional NMR8 though, a large sensitivity enhancement and detection through water are achieved, allowing the use of this technology for imaging of low concentration solutes. Substituting, for convenience, tevol = t, the resulting total time domain signal effect is:
| [4] |
Signal decay during tevol is accounted for by including the effects of exchange and effective transverse relaxation ( ). The frequency information for the different protons can be extracted either by using time domain fitting or by applying a Fourier transform (See Supporting Information). Equations [2–4] also illustrate an interesting advantage of FLEX NMR with respect to standard NMR spectroscopy, namely that the signal includes an internal concentration reference, the directly observed water signal (a ~110M proton pool). However, it has the practical disadvantage of detecting a very large signal with a coil optimized for measuring small induction currents. The main complication is radiation damping, in which the field induced in the coil by the large transverse water magnetization quickly drives the system back to equilibrium, resulting in an apparent decrease of T1w. One way to reduce damping is to dephase the water magnetization when it is not being detected, which can be done using magnetic field gradients. These are applied during all pulse sequence periods where water evolution occurs or where spurious residual transverse water magnetization may be present. Importantly, water signal acquisition should be done using a gradient-recalled echo. When doing this, the water signal is measured in the shape of a projection of the sample, which is subsequently integrated to detect the magnitude modulation. Additionally, damping can be reduced by avoiding water excitation, which was achieved through the selective excitation used for the frequency labeling part of the sequence (50–100 μs hard pulses). One may wonder why we did not use a more selective pulse (> 1ms) centered around the protons of interest, which would have a steeper profile and allow a smaller sweep width. The reason is that using such a pulse would be incompatible with detecting protons exchanging faster than about 1000Hz. The FLEX sampling criteria are based on the fact that the FID will be gone after a time ~ 5/(k + 1/T2*), allowing only a few ms for tevol. In order to have sufficient signal, we use a short dwell time (25 μs) to encode the early part of the FID, forcing us to go far off-resonance with carrier o1 to avoid water excitation.
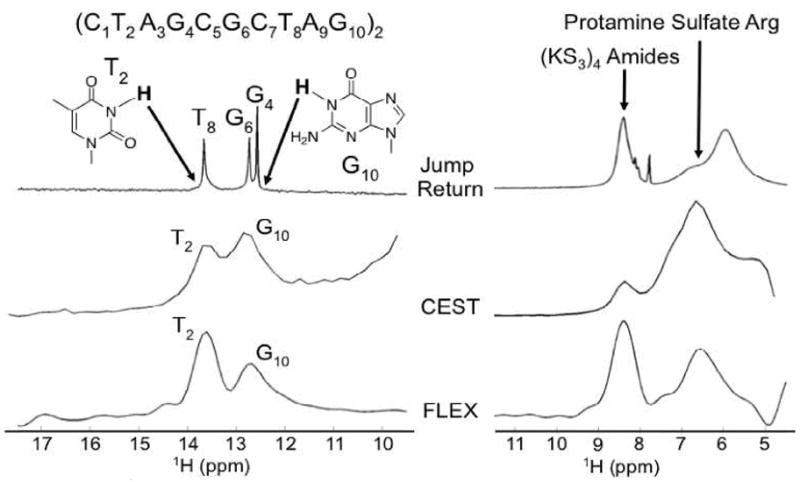
The FLEX approach is expected to have applications in both high-resolution NMR and medical imaging. In Fig. 2 (left column), the Jump-Return (JR), CEST, and FLEX spectra for a 4mM solution of a 10-base-pair palindromic DNA duplex are compared. Even though JR water suppression was used to retain exchangeable protons in the conventional spectrum, only resonances of the T8, G4, and G6 imino protons are visible, while signals for the rapidly exchanging T2 and G10 protons cannot be readily discerned. The contrary is true for the CEST and FLEX spectra, in which only these two imino protons are visible, indicating removal of other protons by the exchange rate filter. The right column of Fig. 2 shows JR, CEST, and FLEX spectra of a mixture of protamine sulfate (PS) and the small polypeptide (LysSer3)4. These peptides are currently being used as CEST contrast agents for in vivo NMR.9 The amide (8.3ppm) resonance represents 12 protons of (LysSer3)4 and 11protons of PS (3 Ser, 4 Pro, 2 Gly, and 2 Val). PS has 21 arginines, each with a guanidinium side chain group, for a total of 84 protons (6.6 ppm).
Figure 2.

Comparison of multiple methods for the observation of rapidly exchanging protons in DNA and a peptide mixture (see text). (left): Detection of “invisible” guanine and thymine imino protons at the ends of duplex DNA (pH = 9, 20 °C). (right): Detection of rapidly exchanging amide and side chain arginine protons of peptides (pH = 7.3) at 37 °C.
In order to check the theoretical description, we measured the absolute magnitude of the FLEX transfer signals as a fraction of total water proton signal (S0 = 110M) and compared it with the theoretically predicted effects as based on the solute concentrations for both the DNA and the protein samples (Table 1). The data were analyzed using time domain fitting (See supplemental information), which provided both the amplitude of the effects for the individual components as well as the signal decay rate during the evolution time. The latter was assumed to be exchange dominated and used to estimate “ks”. The calculations in Table 1 predict very well the experimental results for the DNA sample, while the results for the protein mixture are less satisfying. We attribute the latter to several causes, most likely a closer proximity to water, thus reducing λs, and the presence of multiple components. In the time domain analysis, we reconstructed one component for the expected amide and amine proton frequencies and deconvolved the water contribution. As the amide components and amines have multiple frequencies and a range of exchange rates, it is less straightforward to interpret the data.
Table 1.
Calculation of FLEX proton transfer ratios
| DNA | Protein sample | |||
|---|---|---|---|---|
| Protons | Imino T2 | Imino G10 | Amide NH | Amine NH2 |
| Freq, ppm | 13.6 | 12.7 | 8.4 | 6.6 |
| [H]s (mM) 1 | 8.0 | 8.0 | 20.1 | 22.7 |
| ks (s−1) 2 | 310 | 3300 | 370 | 1400 |
| βs | 0.92 | 1.00 | 0.89 | 1.00 |
| λs 3 | 0.86 | 0.77 | 0.34 | 0.09 |
| T1w (s) 4 | 2.33 | 2.33 | 4.12 | 4.12 |
| PTR (calc) 5 | 1.1% | 1.1% | 1.7% | 0.6% |
| PTR (meas) 6 | 0.7% | 1.2% | 2.7% | 3.5% |
| PTR (M) 6,7 | 0.8 | 1.3 | 3.0 | 3.9 |
based on compound concentration and mixture components; for the amide, 11 PS and 12 (LysSer3)4 protons included.
Estimated from the time domain decay.
Calculated from experimental water excitation profile for a 90x pulse; square of profile intensity at frequency.
Measured using inversion recovery experiment with gradient dephasing to remove radiation damping effects during the inversion time, TI; predelay 15 s; 28 time points between TI 0.25 s and 7 s.
Calculated using Eqs. 1–3. and tprep (5.36s, DNA; 4.40s, Protein), minimum texch (8ms, DNA; 6ms, Protein); evolution increment: 25 μs; Increments: 126 (DNA), 251 (Protein).
Measured from amplitude of the time domain signal.
Calculated with respect to the water proton concentration.
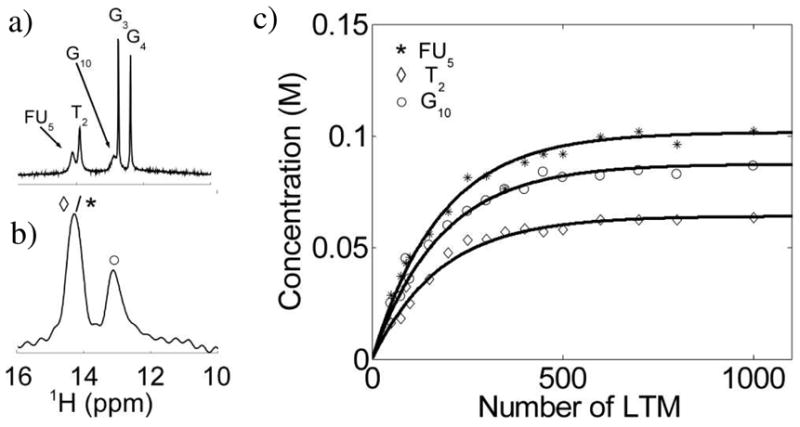
To better check the theory, we prepared a DNA sample for which exchangeable proton resonances were visible in both the JR (Fig. 3a) and FLEX spectrum (Fig. 3b). Subsequently, we measured the FLEX effect as a function of number of LTMs. FLEX time domain fitting was done using the frequencies, decay rates, and exchange rates estimated from the linewidths (decay rate: ) in the JR data. The resulting build-up curves for G10, T2, and fluorouracil (FU5) were fitted (Fig. 3c) to determine the DNA concentration, giving 0.60–0.65 mM (Table 2). This compares satisfactorily to the experimentally determined concentration of 0.8 mM, based on nucleoside analysis. The excellent correspondence between experimental and theoretical curve shapes provides further validation of the FLEX method.
Figure 3.

Quantitative validation of the FLEX method for the DNA duplex 5′-C1T2G3G4FU5A6C7C8A9G10-3′ (T = 10 °C, pH = 9.0). (a) JR spectrum in which all imino protons are observable. (b) FLEX spectra in which G3 and G4 do not appear. (c) Concentration of labeled protons generated by FLEX as a function of the number of applied LTM’s. Data based on time domain fitting, where FU5 and T2 could be deconvoluted using prior knowledge of the chemical shift and decay rate,. Black lines are best fits of the data to Eq. 2 (concentration = PTRs * [H]w,).
Table 2.
Fitted and measured parameters for data in Fig. 3
| Freq (ppm) | ks(s−1) 1 | βs | λs2 | [H]s (mM) 3 | |
|---|---|---|---|---|---|
| FU5 | 14.38 | 209 | 0.82 | 0.58 | 1.2 |
| T2 | 14.16 | 81 | 0.49 | 0.56 | 1.3 |
| G10 | 13.14 | 304 | 0.92 | 0.45 | 1.2 |
Determined from linewidth in JR spectra corrected for 1/T2* = 33Hz based on the width of G3;
Calculated from experimental water excitation profile for a 90x pulse; square of profile intensity at frequency.
From line fit in Fig. 3c; Note: [H]s = 2×[DNA]).
In conclusion, we presented an approach to indirectly detect signals of multiple rapidly exchanging protons through the water signal, while retaining chemical shift specificity and enhancing sensitivity by factors of about 100–200. We expect these factors can be increased by optimizing the number of label transfer modules through tuning of the labeling and exchange periods to the exchange rates of particular solute protons. Detection was possible for rapidly exchanging protons of macromolecules under physiological conditions, which would otherwise be obscured by a background of more slowly exchanging protons. This editing property of FLEX should be ideally suited to the study of dynamic regions of nucleic acids and proteins where amide, amino, and imino groups move rapidly between a closed solvent- inaccessible state and an exposed state where exchange occurs.
Another potential application is enhanced detection of exchange-relayed NOEs through the water signal, which would require the excitation for the labeling period to include protons in spatial proximity to the exchangeable protons. We expect the FLEX method to have applications to the study of macromolecular structure and interactions (e.g. protein-DNA binding) by high-resolution solution-state NMR as well as for the detection of exchange-based contrast agents for MRI, using frequency transfer instead of saturation transfer. Compared to CEST MRI, FLEX is expected to be less sensitive to B0 inhomogeneity and interference by slow magnetization transfer processes due to the opportunity for time domain removal of water signals and the capability for exchange rate and frequency filtering, respectively.
Supplementary Material
Acknowledgments
This work was supported in part by NIH grants GM056834-14 (Stivers) and EB006394 (McMahon).
Footnotes
Supporting Information Available: Determination of labeling efficiency and details of data analysis procedures. This material is available free of charge via the Internet at http://pubs.acs.org.
References
- 1.Gueron M, Leroy JL. Methods Enzymol. 1995;261:383–413. doi: 10.1016/s0076-6879(95)61018-9. [DOI] [PubMed] [Google Scholar]
- 2.Englander S, Kallenbach N. Q Rev Biophys. 1983;16:521–655. doi: 10.1017/s0033583500005217. [DOI] [PubMed] [Google Scholar]
- 3.Cavanagh J, Fairbrother WJ, Palmer AG, III, Skelton NJ. Protein NMR spectroscopy: principles and practice. Academic Press; 2007. [Google Scholar]
- 4.Ward KM, Aletras AH, Balaban RS. J Magn Reson. 2000;143:79–87. doi: 10.1006/jmre.1999.1956. [DOI] [PubMed] [Google Scholar]
- 5.Zhou J, van Zijl PC. Progr NMR Spectr. 2006;48:109–136. [Google Scholar]
- 6.Sherry AD, Woods M. Ann Rev Biomed Engin. 2008;10:391–411. doi: 10.1146/annurev.bioeng.9.060906.151929. [DOI] [PMC free article] [PubMed] [Google Scholar]
- 7.Aime S, Castelli DD, Crich SG, Gianolio E, Terreno E. Acc Chem Res. 2009;42:822–831. doi: 10.1021/ar800192p. [DOI] [PubMed] [Google Scholar]
- 8.Ernst RR, Bodenhausen G, Wokaun A. Principles of Nuclear Magnetic Resonance in one and Two Dimensions. Oxford University Press; 1990. [Google Scholar]
- 9.McMahon MT, Gilad AA, DeLiso MA, Cromer Berman SM, Bulte JWM, van Zijl PCM. Magn Reson Med. 2008;60:803–812. doi: 10.1002/mrm.21683. [DOI] [PMC free article] [PubMed] [Google Scholar]
Associated Data
This section collects any data citations, data availability statements, or supplementary materials included in this article.


