Abstract
Laminar, or sheet, architecture of the left ventricle (LV) is a structural basis for normal systolic and diastolic LV dynamics, but transmural sheet orientations remain incompletely characterized. We directly measured the transmural distribution of sheet angles in the ovine anterolateral LV wall. Ten Dorsett-hybrid sheep hearts were perfusion fixed in situ with 5% buffered glutaraldehyde at end diastole and stored in 10% formalin. Transmural blocks of myocardial tissue were excised, with the edges cut parallel to local circumferential, longitudinal, and radial axes, and sliced into 1-mm-thick sections parallel to the epicardial tangent plane from epicardium to endocardium. Mean fiber directions were determined in each section from five measurements of fiber angles. Each section was then cut transverse to the fiber direction, and five sheet angles (β) were measured and averaged. Mean fiber angles progressed nearly linearly from −41° (SD 11) at the epicardium to +42° (SD 16) at the endocardium. Two families of sheets were identified at approximately +45° (β+) and −45° (β−). In the lateral region (n = 5), near the epicardium, sheets belonged to the β+ family; in the midwall, to the β− family; and near the endocardium, to the β+ family. This pattern was reversed in the basal anterior region (n = 4). Sheets were uniformly β− over the anterior papillary muscle (n = 2). These direct measurements of sheet angles reveal, for the first time, alternating transmural families of predominant sheet angles. This may have important implications in understanding wall mechanics in the normal and the failing heart.
Keywords: cardiac microstructure, sheets
LEFT VENTRICULAR (LV) myofibers are connected by an extensive extracellular collagen matrix (3) to form myolaminar “sheets,” two-to-four cells thick, which are also interconnected by a collagen network (16). This sheet architecture has been proposed as an anatomic basis for myofiber rearrangement throughout the cardiac cycle (17, 22), and sheet deformation is thought to underlie LV mechanics during contraction (6) and relaxation (2).
The three-dimensional geometry of fibers and sheets is critical. Maximum contraction of fibers that lie in planes tangent to the epicardial surface is only 15% along their long axis (21); yet LV ejection fractions of 60% and systolic radial wall thickening of 40% are typically observed. The helical arrangement of the fibers may account for some of this disparity (20), but an additional important mechanism appears to be sheet deformation (19, 22). Laminar shear, extension, and thinning or thickening are thought to contribute to wall thickness changes (6, 7, 24).
Fiber orientation, which can be measured directly, has been found in several species to vary from approximately −60° at the epicardium to +60° at the endocardium (4, 10, 12, 14, 23, 28). Until recently, however, sheet orientation could only be inferred indirectly from the directions of fiber and cleavage planes from three orthogonal views (6). Recently, our group and Ashikaga et al. (2) employed a method (developed by J. C. Criscione) to measure directly sheet orientations across the LV wall. Studying the anterior wall of the canine heart, Ashikaga et al. found a relatively uniform transmural distribution of negative sheet angles (β). The present work, studying the anterolateral region of the ovine heart, revealed a hitherto unknown alternating transmural angular distribution of two separate sheet families. The presence of these families provides a new interpretation of myocardial mechanics.
MATERIALS AND METHODS
All animals received humane care in compliance with the “Principles of Laboratory Animal Care” formulated by the National Society for Medical Research and the Guide for the Care and Use of Laboratory Animals [DHHS Publication no. (NIH) 85-23, Revised 1985, Office of Science and Health Reports, Bethesda, MD 20892]. The study was approved by the Stanford University Medical School Laboratory Research Animal Review Committee and conducted according to Stanford University policy.
Surgical preparation
Ten adult, Dorsett-hybrid, male sheep [68 kg (SD 7)] were intubated and ventilated (Servo Anesthesia Ventilator, Siemens-Elema, Stockholm, Sweden), and general anesthesia was maintained with inhalational isoflurane (1–2.2%). The heart was exposed via a left fifth intercostal space thoracotomy and suspended in a pericardial cradle. A micromanometer-tipped catheter (model SPC-500, Millar Instruments, Houston, TX), zeroed in a 37°C water bath, was placed in the ventricle through the apex to measure LV pressure. End-diastolic pressure was defined at the time immediately preceding the upstroke of the LV pressure curve. An intravenous bolus of thiopental sodium (1 g) was given, and the heart was depolarized and arrested at end diastole with an intravenous bolus of potassium chloride (80 meq).
LV pressure was adjusted to match in vivo LV end-diastolic pressure by venous exsanguinations (volume infusion was never required) and was maintained constant throughout the in situ fixation process. An 8-F coronary guiding catheter (PowerGlide, Advanced Cardiovascular Systems, Temecula, CA) was then advanced into the left main coronary artery under fluoroscopic guidance over a 0.014-in. floppy guide wire (HI-TORQUE, Advanced Cardiovascular Systems, Santa Clara, CA) through a sheath placed in the carotid artery. A conventional 3.0-mm perfusion balloon dilatation catheter was advanced into the proximal circumflex coronary artery through the guiding catheter. The balloon was inflated to prevent retrograde flow, and 300 ml of buffered glutaraldehyde (5%) were infused to fix the circumflex coronary artery distribution. Immediately thereafter, the balloon catheter was repositioned into the proximal left anterior descending coronary artery, and an additional 300 ml of buffered glutaraldehyde were infused to fix the left anterior descending coronary artery distribution. The hearts were then excised and stored in 10% formalin for later histological examination.
Histological preparation
To avoid the distortional effects of dehydration and shrinkage associated with embedding, histological measurements were obtained with freshly fixed heart tissue.
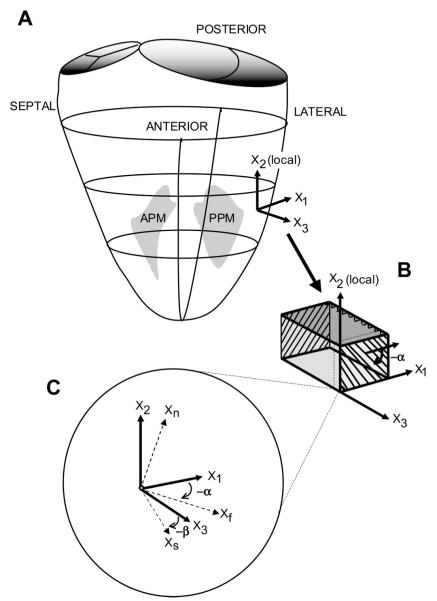
To define the myocardial geometry, a right-handed “cardiac” Cartesian coordinate system was defined with positive X1 (circumferential) pointing toward the posterior LV, positive X2 (longitudinal) pointing toward the LV base, and positive X3 (radial) pointing from endocardium to epicardium (Fig. 1) (26). X3 was defined normal to the epicardial tangent plane at the centroid (origin) of the equatorial wall tissue block to be studied. X2 was defined by the intersection of this epicardial tangent plane with a plane containing X3 and a line from the apex of the heart through the centroid. X1 was defined mutually perpendicular to X2 and X3.
Fig. 1.
Coordinate systems. A: transmural fiber angle (α) and sheet angle (β) were determined in the midlateral free wall of the left ventricle (LV), between the papillary muscles. Local “cardiac coordinates” (X1, X2, and X3, representing a Cartesian coordinate system) are shown. APM, anterolateral papillary muscle; PPM, posteromedial papillary muscle. B: a transmural tissue block was excised from each heart, with the edges of the block cut parallel to the local circumferential (X1), longitudinal (X2), and radial (X3) axes at the midlateral LV wall; α was measured from serial sections cut parallel to the X1-X2 plane at different transmural depths. C: at a given transmural depth, measured α and β are used to define local “fiber-sheet” coordinates with basis vectors of fiber (Xf) axis, sheet axis perpendicular to Xf within sheet plane (Xs), and axis normal to the sheet plane (Xn). Xf, Xs, and Xn represent a Cartesian coordinate system. Xf lies in the X1-X2 plane; Xs lies in the plane defined by X3 and the axis normal to the fiber direction (Xcf), which is not shown.
In five hearts, a transmural rectangular block of myocardial tissue (3.2 × 3.2 × ~10 mm) was then carefully removed from the lateral equatorial wall, with edges of the block cut parallel to the local X1, X2, and X3 axes (Fig. 1, A and B). To examine some nearby regions, tissue blocks from five additional hearts were similarly analyzed, four blocks from the midanterior free wall and two from the region directly overlying the base of the anterior papillary muscle.
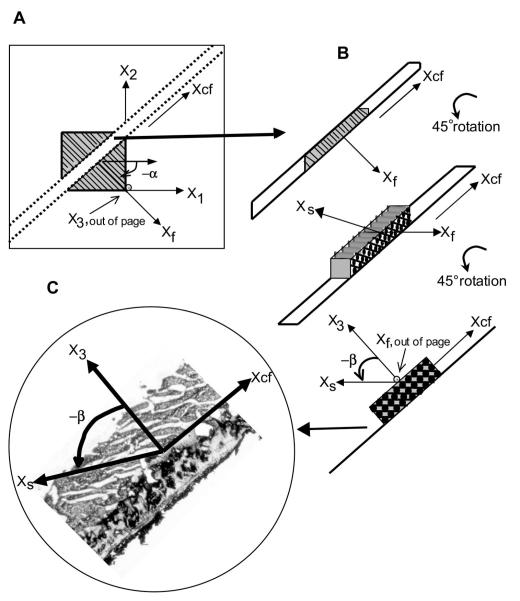
With a Plexiglas template to guide the blade, each block of tissue was sliced into 1-mm-thick sections parallel to the (X1,X2) plane, providing a series of slices from epicardium to endocardium for measurement of fiber angle (α) across the wall. The α was defined as the angle subtended by Xf and X1, with α being negative for a left-handed helix (Fig. 1B) (16, 23). To maintain the orientation of the coordinate system for all subsequent measurements, each slice was affixed (with cyanoacrylate) to note cards, with positive X1 pointing to the right, positive X2 pointing up, and positive X3 facing away from the paper (Fig. 2A). Digital photomicrographs of each section were taken (Nikon 4500 Coolpix, Nikon, Melville, NY). The angle between the local myofiber axis and the circumferential edge of the tissue section was measured at five sites on each image using image-processing software (SPOT Advanced version 3.5.6, Diagnostic Instruments, Sterling Heights, MI), and mean α was calculated at each transmural depth. Positive X1 defined 0°, with negative α defined as clockwise rotation about X3 (Fig. 1C).
Fig. 2.
Measurement of α and β. A: each transmural slice from the block of tissue was affixed to a note card with positive X1 pointing to the right, positive X2 pointing up, and positive X3 pointing away from the paper. Positive X1 represented α = 0°, with a negative α (as shown) defined as a clockwise rotation about X1. Two parallel cuts separated by ~1 mm were made normal to Xf axis in each section along the Xcf axis. Xf, Xcf, and X3 present another Cartesian coordinate system. B: resulting slices were rotated 90° about Xcf, so that Xf pointed out of the page and β lay in the plane of observation, with positive X3 perpendicular to Xcf (defined by the paper attached to the specimen), allowing direct measurement of β corresponding to α at each transmural depth. C: a cryostat was used to cut frozen specimens into 8- to 10-μm-thick sections, which were carefully transferred to a glass slide. During the cutting process, a predominant β was observed from each frozen specimen mounted on the cryostat. Each slice was observed and photographed at low-power (×25) magnification. Values of β were measured along gaps between cleavage planes that first appeared as the specimen dried and corresponded to the predominant angle observed in each frozen specimen, thereby minimizing the likelihood of measuring dehydration artifact. Positive X3 was perpendicular to Xcf and represented β = 0°; a counterclockwise rotation was represented by a negative β.
For each transmural section, two parallel cuts separated by ~1 mm were then made along the cross-fiber (Xcf) axis, i.e., normal to the fiber (Xf) axis (Fig. 2A). The resulting blocks of myocardial tissue were rotated 90° about Xcf, so that Xf pointed out of the page (i.e., fibers now viewed “end-on”) and the sheet (Xs) axis lay in the plane of observation (Fig. 2B). This allowed direct measurement of β at each transmural depth. To avoid distortions due to dehydration, the samples were kept moist with a 30% sucrose solution, which also served as a cryoprotectant to minimize freezing artifact during the subsequent frozen section process.
The rotated cross-fiber blocks were placed in 15 × 15 × 5-mm plastic molds (Tissue-Tek, Cryomold Intermediate, Miles, Elkhart, IN), embedded in OCT compound (Tissue-Tek, Sakura Finetek, Torrance, CA), and frozen over dry ice. Care was taken to preserve the coordinate orientations, and the specimens were stored in an −80°C freezer. The specimens were then cut into 8- to 10-μm-thick sections using a cryostat (Jung Frigocut 2800 N, Leica) and carefully transferred to a glass slide. During the sectioning process, a predominant β could be appreciated visually on each frozen specimen mounted on the cryostat. Once transferred to the glass slide, the specimens were imaged immediately with use of a digital camera (RT Color, ×1 HRD 100-NIK, Diagnostic Instruments) mounted on a light microscope (type 301-371.010, Leica) at low-power (×25) magnification (Fig. 2C). Myolaminae coursing in the direction noted during sectioning of the frozen specimen were then observed. Over a 3-min period, gaps appeared between the myolaminae, defining the cleavage planes, and additional cracks and dehydration artifact appeared as the section dried. For each slice, angles representative of predominant sheet population(s) were defined as the first gaps to appear between the myolaminae as the section dried, corresponding to the predominant angles observed grossly in the frozen specimen. Values of β were determined from the cleavage planes that extended the majority of the width of the 1-mm section to minimize the likelihood of measuring dehydration artifact. Occasionally, two different sheet families were observed in a single section. Image-processing software was used to measure five angles representative of the predominant sheet orientation(s) over the length of the specimen, and the mean β was calculated for each transmural depth. The β was defined as the angle subtended by Xs and X3, with β being negative if the sheet moves away from the LV base as one follows the sheet radially toward the epicardium (Figs. 1C and 2C) (6). Values are means (SD).
RESULTS
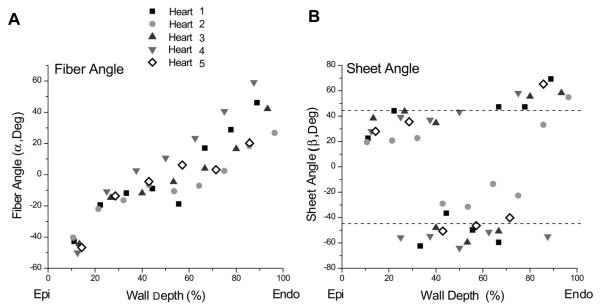
The LV was fixed at 15 mmHg (SD 6). A total of 7 (SD 1) transmural slices (1–1.5 mm thick) were obtained from each of the five hearts. In the lateral wall, transmural α values ranged roughly linearly from −41° (SD 11) to 42° (SD 16) from epicardium to endocardium, being circumferentially oriented at the midwall level (Fig. 3A).
Fig. 3.
A: transmural distribution of α in the lateral wall for all 5 animals. B: transmural distribution of β in the lateral wall for all 5 animals. Values of β were centered around two “families”: one at approximately +45° and one at approximately −45°. Near the epicardium, β belonged to the +45° family, in the midwall to the −45° family, and near the endocardium to the +45° family. Epi, epicardium; Endo, endocardium.
The directly measured β values tended to fall into two different families or populations: β+, clustered around +45°, and β−, clustered around −45° (Fig. 4). In the lateral equatorial wall, near the epicardium, the sheets belonged to the β+ family [+31° (SD 9)], in the midwall to the β− family [−41° (SD 15)], and near the endocardium to the β+ family [+54° (SD 11); Fig. 3B]. In 5 of the 37 slices, mostly at transition layers between the subepicardium and midwall and between the midwall and subendocardium, two predominant β values from the β+ and β− families, ~70–90° apart, were observed within the same section. In the anterior basal region, the opposite trend occurred. Near the epicardium the sheets belonged to the β− family [−47° (SD 6)], in the midwall to the β+ family [+44° (SD 8)] and near the endocardium to the β− family [−43° (SD 4)]. In blocks from the region over the anterior papillary muscle, there was no alternating distribution; rather, sheets belonged to the β− family throughout the entire wall depth [−44° (SD 4)].
Fig. 4.
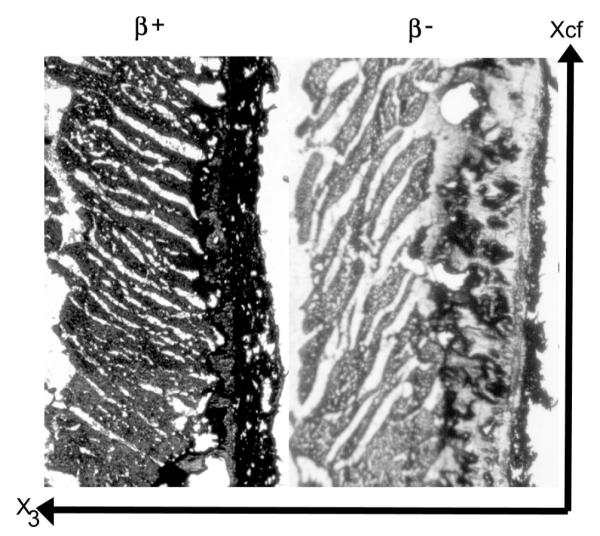
Representative images obtained using the direct histological method. Left: a specimen with β values that fall into the β+ family. Right: a specimen with β values that fall into the β− family.
DISCUSSION
Measurement of α is relatively straightforward in sections cut parallel to the circumferential-longitudinal (X1, X2) plane, because the myofibers run almost parallel to this plane, with an out-of-plane, or imbrication, angle of <10° (23). This transmural myofiber distribution has been described in many species, including humans (12), using histology (14, 18, 23, 28) or diffusion tensor magnetic resonance imaging (4, 10, 25). This helical myofiber orientation is relatively preserved among different species, ranging from approximately −60° to +60° from epicardium to endocardium, with circumferential fibers at midwall, although some studies have shown some variation from apex to base (6, 23, 24). The present study is the first to report transmural distribution of α in the ovine heart, but our data are consistent with these previously published reports from other species.
Measurement of β, however, is not nearly as straightforward. The Xs axis is defined as orthogonal to the Xf axis, and β is defined as the angle of rotation of Xs around Xf, with reference to the positive X3 axis (15, 16, 22) (Fig. 2B). This Xs axis lies in a plane skewed in relation to the cardiac coordinates. Therefore, previous studies have measured cleavage plane angles in two orthogonal planes tangent to the cardiac coordinates (X2–3 and X1–3) and α in the X1–2 plane, and these cleavage plane angles were mathematically transformed to correspond to those in the plane in which the Xs axis (Xcf-3) lies (1, 6, 17, 24). Therefore, indirect β measurements using such mathematical transformations must assume a continuous distribution of a predominant sheet family from the measurement plane (X2,X3 or X1,X3) to the extrapolated (Xcf,X3) plane.
Previous indirect measurements in canine hearts, mostly from the anterior wall, have shown a consistently negative β (approximately −30° to −40°) through the wall depth, (2, 5, 6, 17, 24) or a progression from negative to positive β or vice versa (within −90° and +90°) across the heart wall (6, 15, 16). These transmural patterns also vary substantially from apex to base (6, 16, 24) and in different regions of the LV (16, 17). Two of these studies (15, 17) noted areas containing sheets with markedly different orientations, implying two coexisting sets of intersecting sheets at these locations. Ashikaga et al. (2), using the direct measurement method similar to that reported here, demonstrated one sheet population, which was consistently negative, running throughout the wall, with a second population, lying approximately perpendicular to the first, occurring simultaneously in the subendocardium of the canine anterior LV wall.
The present study, applying this direct measurement approach to the ovine lateral equatorial LV wall, demonstrated β falling into two distinct families (Fig. 4): β+ clustered around +45° and β− clustered around −45°. Although this is consistent with previous reports of two families of β (1, 2), it differs from previous reports, in that the orientation of a specific sheet population was found to depend on transmural depth. In the lateral wall, near the epicardium, β belonged to the β+ family; near the midwall, to the β− family; and near the endocardium, again to the β+ family (Fig. 3B). In the anterior wall the reverse trend was observed. Near the epicardium, β belonged to the β− family; near the midwall, to the β+ family; and near the endocardium, again to the β− family. In the anterolateral region, overlying the anterior papillary muscle, a homogenous distribution was found, with β consistently belonging to the β− family throughout the wall. Figure 5 presents a conceptual schematic model depicting how the results observed in these three regions could be synthesized into a more global picture of the cardiac microstructure.
Fig. 5.
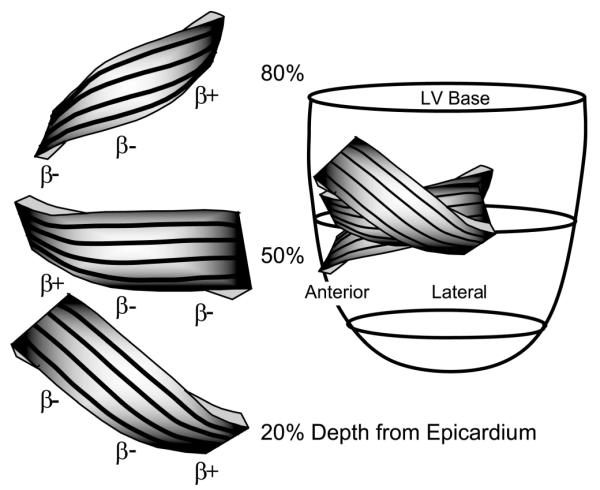
Conceptual model synthesizing data from anterior, anterolateral, and lateral equatorial regions of the heart. Left: representation of the sheets at 20, 50, and 80% wall depth from the epicardium. Black lines on the surface of the sheets correspond qualitatively to measured α, with negative α values near the epicardium, circumferential α values (0°) at midwall, and positive α values near the epicardium. Left regions represent data from the anterior wall, with sheets belonging to the β− family at 20%, to the β+ family at 50%, and to the β− family at 80% wall depth. Middle regions represent the region over the anterior papillary muscle, with sheets belonging to the β− family throughout the wall. Right regions represent data from the lateral region, with sheets belonging to the β+ family at 20%, to the β− family at 50%, and to the β+ family at 80% wall depth from the epicardium.
Systolic radial thickening of the ventricular wall is an important component of normal LV function because of its substantial contribution to stroke volume (8, 11) and its sensitivity to myocardial hypoperfusion (9). LeGrice et al. (17) suggested that sliding of adjacent sheets along their cleavage planes due to interlaminar transverse shear was a significant contributor to systolic wall thickening in the subendocardium. Further studies found that laminar thinning or thickening and extension, together with interlaminar transverse shear, could account for most systolic wall thickening (6, 7, 24). LeGrice et al. (17) also indicated that the magnitude of wall thickening due to shearing of the laminae is dependent on the initial cleavage plane orientation and that sheets oriented perpendicularly to each other (i.e., two different families) have opposite signs of transverse shear.
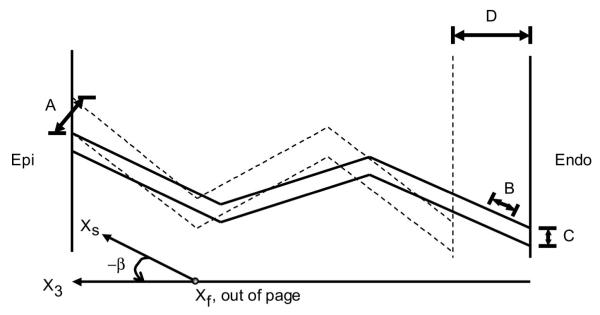
Our transmural sheet characterization provides additional insights into these models of wall thickening. Figure 6 demonstrates a two-dimensional representation of how previously described mechanisms of laminar deformation, when combined with our lateral transmural distribution of alternating families, could create an “accordion-like” wall thickening mechanism. Indeed, a heterogeneous transmural laminar structure, such as the accordion configuration observed in the present study, may facilitate wall thickening via laminar shear in the cylindrical ventricle. If only one population of sheets existed throughout the wall from epicardium to endocardium, thickening due to laminar shear would only be possible if the endocardium moved parallel to the epicardium as much as they move away from each other; i.e., thickening and shearlike translocation would have to be on the same order. Conversely, an accordion laminar distribution allows alternating shear displacement to occur within the wall, such that minimal shear displacement of the epicardium relative to the endocardium can occur. With this mechanism, the shear deformation can be the same throughout the wall, but the direction of sheet sliding alternates. The reverse-accordion distribution observed in the basal anterior region would operate in a similar fashion. This mechanism would not be available in the region over the anterior papillary muscle, however, in which we found a homogenous transmural sheet distribution. Interestingly, this region has been shown to have depressed wall thickening relative to the adjacent anterior free wall (13).
Fig. 6.
Two-dimensional representation of the plane, which in reality twists through the wall, as the sheets are perpendicular to the helically progressing fibers across the wall. Solid and dashed lines, lateral myolaminar sheets in systole and diastole, respectively. With alternating sheet families through the wall, wall thickening (D) may be due to laminar transverse shear (A), laminar extension (B), and laminar thinning (C) of each population.
The mechanisms by which myocyte contraction is translated to sheet deformation are not known with certainty, but one likely possibility is that the extracellular collagen matrix provides a coupling between fibers and sheets. Thus characterization of the baseline three-dimensional myocardial architecture is important, as collagen degradation brought about by disease states (27), which have been shown to alter baseline fiber architecture (4, 28), may be a key mechanism in ventricular dysfunction.
In summary, this study directly measured β throughout the anterolateral ovine LV wall. Using this method, we demonstrated two families of β approximately perpendicular to each other, the orientation of which was a function of transmural depth. This heterogeneous transmural microstructure, characterized by discrete, alternating families of sheets, with opposite alternating sign patterns in the lateral and anterior regions, may provide new insight into LV wall thickening mechanisms. The importance of laminar transverse shear, thinning or thickening, and extension on wall thickening has previously been known, yet precisely quantifying global myolaminar architecture has remained elusive. This study is a step toward precise characterization of the distribution of sheets throughout many regions of the LV, which is crucial to a full understanding of the structure-function relation of the heart in physiological and pathological states.
Study limitations
This analysis assumes an average β for each 1-mm slice, a method that has been used in previous studies (6, 17, 24). In the present study, there was a <10° variation in the five angles measured for a given population within a slice. In the slices where we measured all possible angles (including possible dehydration artifacts), there was greater dispersion. Although it is likely that such dispersion of β could significantly affect local sheet mechanics, we chose to average the predominant β for each slice, assuming that the predominant orientation would have the major effect on LV wall thickening.
Because β values were measured in frozen sections, it is possible that β may have become altered during the freezing and dehydration processes. All samples were soaked in 30% sucrose to minimize the freezing artifact. To minimize dehydration artifact, samples were photographed immediately after sectioning, and care was taken to match the measured angles to the observed predominant trend in the frozen tissue block.
Our observations are limited only to the equatorial and basal anterolateral ovine LV wall. The results of the present study encourage a thorough and systematic study of the entire LV, but this is beyond the scope of the present study. Variation in sheet distribution has been shown from apex to base (6, 16, 24), and it is possible that there is variation among different species as well. The site and species variation may account for the differences in the magnitudes and signs of β reported from previous experiments, which have largely focused on the basal and apical anterior LV walls of canine hearts. Therefore, caution is necessary in extrapolating these results to other regions and other species, including humans.
We have provided no functional data to support our accordion-like wall-thickening mechanism and acknowledge that many different possible heterogeneous distributions can create local shearing and wall thickening without requiring a concomitant large shear displacement of the epicardium relative to the endocardium. The blocks of tissue from the anterior and lateral walls were taken directly contiguous to transmural bead sets implanted in vivo for the purpose of strain analysis, and we plan further studies using data from these bead sets to more concretely test this proposed transmural wall-thickening mechanism.
ACKNOWLEDGMENTS
We thank Dr. James Covell for generous help and advice. We acknowledge the superb technical assistance of Mary K. Zasio, Maggie Brophy, Lynn Bailey, Jennifer K. Lyons, and Leora B. Balsam.
This study was presented in part at the American Heart Association, Western States Affiliate, Young Investigator’s Forum, 2003, San Francisco, CA.
GRANTS This work was supported by National Heart, Lung, and Blood Institute Grants HL-29589 and HL-67025 (D. C. Miller). F. Rodriguez, A. Cheng, and F. Langer were Carl and Leah McConnell Cardiovascular Surgical Research Fellows. F. Rodriguez was supported by National Heart, Lung, and Blood Institute Grant HL-67025-01S1 and was also a recipient of an American College of Surgeons Resident Research Scholarship Award. F. Langer was supported by the Deutsche Akademie der Naturforscher Leopoldina. H. Ashikaga is a recipient of the American Heart Association Postdoctoral Fellowship (Western States Affiliate). J. C. Criscione was supported by American Heart Association Grant 0265133Y.
REFERENCES
- 1.Arts T, Costa KD, Covell JW, McCulloch AD. Relating myocardial laminar architecture to shear strain and muscle fiber orientation. Am J Physiol Heart Circ Physiol. 2001;280:H2222–H2229. doi: 10.1152/ajpheart.2001.280.5.H2222. [DOI] [PubMed] [Google Scholar]
- 2.Ashikaga H, Criscione JC, Omens JH, Covell JW, Ingels NB., Jr. Transmural left ventricular mechanics underlying torsional recoil during relaxation. Am J Physiol Heart Circ Physiol. 2004;286:H640–H647. doi: 10.1152/ajpheart.00575.2003. [DOI] [PMC free article] [PubMed] [Google Scholar]
- 3.Caulfield JB, Borg TK. The collagen network of the heart. Lab Invest. 1979;40:364–372. [PubMed] [Google Scholar]
- 4.Chen J, Song SK, Liu W, McLean M, Allen JS, Tan J, Wickline SA, Yu X. Remodeling of cardiac fiber structure after infarction in rats quantified with diffusion tensor MRI. Am J Physiol Heart Circ Physiol. 2003;285:H946–H954. doi: 10.1152/ajpheart.00889.2002. [DOI] [PubMed] [Google Scholar]
- 5.Costa KD, May-Newman K, Farr D, O’Dell WG, McCulloch AD, Omens JH. Three-dimensional residual strain in midanterior canine left ventricle. Am J Physiol Heart Circ Physiol. 1997;273:H1968–H1976. doi: 10.1152/ajpheart.1997.273.4.h1968. [DOI] [PMC free article] [PubMed] [Google Scholar]
- 6.Costa KD, Takayama Y, McCulloch AD, Covell JW. Laminar fiber architecture and three-dimensional systolic mechanics in canine ventricular myocardium. Am J Physiol Heart Circ Physiol. 1999;276:H595–H607. doi: 10.1152/ajpheart.1999.276.2.H595. [DOI] [PubMed] [Google Scholar]
- 7.Dou J, Tseng WY, Reese TG, Wedeen VJ. Combined diffusion and strain MRI reveals structure and function of human myocardial laminar sheets in vivo. Magn Reson Med. 2003;50:107–113. doi: 10.1002/mrm.10482. [DOI] [PubMed] [Google Scholar]
- 8.Dumesnil JG, Shoucri RM. Quantitative relationships between left ventricular ejection and wall thickening and geometry. J Appl Physiol. 1991;70:48–54. doi: 10.1152/jappl.1991.70.1.48. [DOI] [PubMed] [Google Scholar]
- 9.Gallagher KP, Gerren RA, Stirling MC, Choy M, Dysko RC, McManimon SP, Dunham WR. The distribution of functional impairment across the lateral border of acutely ischemic myocardium. Circ Res. 1986;58:570–583. doi: 10.1161/01.res.58.4.570. [DOI] [PubMed] [Google Scholar]
- 10.Geerts L, Bovendeerd P, Nicolay K, Arts T. Characterization of the normal cardiac myofiber field in goat measured with MR-diffusion tensor imaging. Am J Physiol Heart Circ Physiol. 2002;283:H139–H145. doi: 10.1152/ajpheart.00968.2001. [DOI] [PubMed] [Google Scholar]
- 11.Gould KL, Oskada G, Matsuzaki M, Miller M, Kemper WS, Ross J., Jr. Analysis of wall dynamics and directional components of left ventricular contraction in man. Am J Cardiol. 1976;38:322–331. doi: 10.1016/0002-9149(76)90174-0. [DOI] [PubMed] [Google Scholar]
- 12.Greenbaum RA, Ho SY, Gibson DG, Becker AE, Anderson RH. Left ventricular fiber architecture in man. Br Heart J. 1981;45:248–263. doi: 10.1136/hrt.45.3.248. [DOI] [PMC free article] [PubMed] [Google Scholar]
- 13.Holmes JW, Takayama Y, LeGrice I, Covell JW. Depressed regional deformation near anterior papillary muscle. Am J Physiol Heart Circ Physiol. 1995;269:H262–H270. doi: 10.1152/ajpheart.1995.269.1.H262. [DOI] [PubMed] [Google Scholar]
- 14.Knisley SB, Baynham TC. Line stimulation parallel to myofibers enhances regional uniformity of transmembrane voltage changes in rabbit hearts. Circ Res. 1997;81:229–241. doi: 10.1161/01.res.81.2.229. [DOI] [PubMed] [Google Scholar]
- 15.LeGrice IJ, Hunter PJ, Smaill BH. Laminar structure of the heart: a mathematical model. Am J Physiol Heart Circ Physiol. 1997;272:H2466–H2476. doi: 10.1152/ajpheart.1997.272.5.H2466. [DOI] [PubMed] [Google Scholar]
- 16.LeGrice IJ, Smaill BH, Chai LZ, Edgar SG, Gavin JB, Hunter PJ. Laminar structure of the heart: ventricular myocyte arrangement and connective tissue architecture in the dog. Am J Physiol Heart Circ Physiol. 1995;269:H571–H582. doi: 10.1152/ajpheart.1995.269.2.H571. [DOI] [PubMed] [Google Scholar]
- 17.LeGrice IJ, Takayama Y, Covell JW. Transverse shear along myocardial cleavage planes provides a mechanism for normal systolic wall thickening. Circ Res. 1995;77:182–193. doi: 10.1161/01.res.77.1.182. [DOI] [PubMed] [Google Scholar]
- 18.Nielsen PM, Le Grice IJ, Smaill BH, Hunter PJ. Mathematical model of geometry and fibrous structure of the heart. Am J Physiol Heart Circ Physiol. 1991;260:H1365–H1378. doi: 10.1152/ajpheart.1991.260.4.H1365. [DOI] [PubMed] [Google Scholar]
- 19.Rademakers FE, Rogers WJ, Guier WH, Hutchins GM, Siu CO, Weisfeldt ML, Weiss JL, Shapiro EP. Relation of regional cross-fiber shortening to wall thickening in the intact heart: three-dimensional strain analysis by NMR tagging. Circulation. 1994;89:1174–1182. doi: 10.1161/01.cir.89.3.1174. [DOI] [PubMed] [Google Scholar]
- 20.Sallin EA. Fiber orientation and ejection fraction in the human left ventricle. Biophys J. 1969;9:954–964. doi: 10.1016/S0006-3495(69)86429-5. [DOI] [PMC free article] [PubMed] [Google Scholar]
- 21.Sonnenblick EH, Ross J, Jr, Covell JW, Spotnitz HM, Spiro D. The ultrastructure of the heart in systole and diastole. Circ Res. 1967;21:431. doi: 10.1161/01.res.21.4.423. [DOI] [PubMed] [Google Scholar]
- 22.Spotnitz HM, Spotnitz WD, Cottrell TS, Spiro D, Sonnenblick EH. Cellular basis for volume-related wall thickness changes in the rat left ventricle. J Mol Cell Cardiol. 1974;6:317–331. doi: 10.1016/0022-2828(74)90074-1. [DOI] [PubMed] [Google Scholar]
- 23.Streeter DD., Jr. Handbook of Physiology. The Cardiovascular System. The Heart. vol. II. Am. Physiol. Soc.; Bethesda, MD: 1979. Gross morphology and fiber geometry of the heart; pp. 61–112. sect 2. chapt. 4. [Google Scholar]
- 24.Takayama Y, Costa KD, Covell JW. Contribution of laminar myofiber architecture to load-dependent changes in mechanics of LV myocardium. Am J Physiol Heart Circ Physiol. 2002;282:H1510–H1520. doi: 10.1152/ajpheart.00261.2001. [DOI] [PubMed] [Google Scholar]
- 25.Tseng WY, Wedeen VJ, Reese TG, Smith RN, Halpern EF. Diffusion tensor MRI of myocardial fibers and sheets: correspondence with visible cut-face texture. J Magn Reson Imaging. 2003;17:31–42. doi: 10.1002/jmri.10223. [DOI] [PubMed] [Google Scholar]
- 26.Waldman LK, Fung YC, Covell JW. Transmural myocardial deformation in the canine left ventricle: normal in vivo three-dimensional finite strains. Circ Res. 1985;57:152–163. doi: 10.1161/01.res.57.1.152. [DOI] [PubMed] [Google Scholar]
- 27.Weber KT, Sun Y, Tyagi SC, Cleutjens JPM. Collagen network of the myocardium: function, structural remodeling and regulatory mechanisms. J Mol Cell Cardiol. 1994;26:279–292. doi: 10.1006/jmcc.1994.1036. [DOI] [PubMed] [Google Scholar]
- 28.Weis SM, Emery JL, Becker KD, McBride DJ, Jr, Omens JH, McCulloch AD. Myocardial mechanics and collagen structure in the osteogenesis imperfecta murine (oim) Circ Res. 2000;87:663–669. doi: 10.1161/01.res.87.8.663. [DOI] [PubMed] [Google Scholar]


