

Abstract
Diastolic dysfunction in volume-overload hypertrophy by aortocaval fistula is characterized by increased passive stiffness of the left ventricle (LV). We hypothesized that changes in passive properties are associated with abnormal myolaminar sheet mechanics during diastolic filling. We determined three-dimensional finite deformation of myofiber and myolaminar sheets in the LV free wall of six dogs with cineradiography of implanted markers during development of volume-overload hypertrophy by aortocaval fistula. After 9 ± 2 wk of volume overload, all dogs developed edema of extremities, pulmonary congestion, elevated LV end-diastolic pressure (5 ± 2 vs. 21 ± 4 mmHg, P < 0.05), and increased LV volume. There was no significant change in systolic function [dP/dtmax: 2,476 ± 203 vs. 2,330 ± 216 mmHg/s, P = not significant (NS)]. Diastolic relaxation was significantly reduced (dP/dtmin: −2,466 ± 190 vs. −2,076 ± 166 mmHg/s, P < 0.05; time constant of LV pressure decline: 32 ± 2 vs. 43 ± 1 ms, P < 0.05), whereas duration of diastolic filling was unchanged (304 ± 33 vs. 244 ± 42 ms, P = NS). Fiber stretch and sheet shear occur predominantly in the first third of diastolic filling, and chronic volume overload induced remodeling in lengthening of the fiber and reorientation of the laminar sheet architecture. Sheet shear was significantly increased and delayed at the subendocardial layer (P < 0.05), whereas magnitude of fiber stretch was not altered in volume overload (P = NS). These findings indicate that enhanced filling in volume-overload hypertrophy is achieved by enhanced sheet shear early in diastole. These results provide the first evidence that changes in motion of radially oriented laminar sheets may play an important functional role in pathology of diastolic dysfunction in this model.
Keywords: finite deformation, strain, fiber, sheet, diastolic function
THE LAMINAR STRUCTURE of the myocardium consists of radial arrangement of myofiber bundles approximately four cells thick with extensive cleavage planes between the laminae (23). It has been established that the myolaminar sheets provide the key mechanism of regional systolic (10) and diastolic (3) function. For example, local shearing of the sheet structure is an important mechanism of ventricular wall thinning during diastole (3, 35).
Heart failure due to chronic volume overload induced by aortocaval fistula is associated with significant increase in passive stiffness of the left ventricle (LV) (18, 26). One of the potential mechanisms may be remodeling of the extracellular matrix (ECM) during hypertrophy (17, 18). Because the myocardial sheet structure is enclosed and interconnected by the ECM (23), ECM remodeling may mitigate the normal sheet mechanics, thus increasing the overall passive stiffness of the ventricle during diastole. Moreover, previous studies suggest that sheet shear may play an important role during diastolic filling (3, 37). Therefore, we hypothesized that the changes in passive properties in chronic volume-overload heart failure are associated with abnormal sheet mechanics during diastolic filling.
To test this hypothesis, we determined myocardial three-dimensional (3-D) finite deformation in the LV anterior wall of dogs in vivo in volume-overload hypertrophy. The time course of myocardial strains in fiber-sheet coordinates referred to the end-diastolic configuration was determined during diastolic filling. This allowed us to study dynamic changes during diastolic filling at the level of myofibers and sheet structures before and after development of diastolic dysfunction.
METHODS
All animal studies were performed according to National Institutes of Health guidelines for the care and use of laboratory animals in research. All protocols were approved by the Animal Subjects Committee of the University of California-San Diego, which is accredited by the American Association for Accreditation of Laboratory Animal Care.
Experimental protocol
Six adult mongrel dogs (21–25 kg) were anesthetized with intravenous thiopental sodium (8–10 mg/kg) and mechanically ventilated with isoflurane (0.5–2.5%) and nitrous oxide (3 l/min). Under sterile conditions, the heart was exposed through a left thoracotomy at the fourth intercostal space. Gold beads (2 mm) were sutured to the apical dimple (apex bead, Fig. 1A) and at the bifurcation of the left anterior descending and left circumflex coronary arteries (base bead, Fig. 1A). To measure 3D myocardial deformation in each heart, transmural marker arrays or a “bead set” was placed within the LV anterior free wall (Fig. 1, A and B), as described previously (3, 41). Briefly, an 8-mm-thick Plexiglas template was sutured to the epicardium, with three holes forming a 10-mm equilateral triangle to act as guides for the bead insertion trocar. Four to six 0.8-mm-diameter gold beads were inserted one by one to create a total of three columns of beads spanning from endocardium to epicardium (Fig. 1B). After the bead insertion was complete, the platform was removed, and a 1.7-mm-diameter surface gold bead was sewn onto the epicardium above each column. Through a stab wound in the apex, a precalibrated micromanometer pressure catheter (model P6, Konigsberg Instruments, Pasadena, CA) was inserted to monitor LV pressure (LVP). A 9-Fr silicone catheter (IntiSilf, Access Technologies, Skokie, IL) was inserted into the left atrium (LA) to monitor LA pressure, which was used in every imaging study to correct for baseline drifting of the LV micromanometer. The chest was closed, and the animals were allowed to recover for 7–10 days. Control imaging studies were performed for each animal. Under sedation with intravenous propofol (5.5–7.0 mg/kg), the dogs were suspended in a sling in a biplane X-ray system (24). Biplane cineradiographic images (125 frames/s) of the bead markers were digitally acquired (3) for at least one full respiratory cycle, and data used in the analysis were taken near end expiration to minimize the effects from respiratory variation. Through an abdominal incision under general anesthesia, the aorta and inferior vena cava were then exposed below the renal arteries, and a 1.0- to 1.2-cm side-to-side anastomosis was constructed (30, 38). The abdomen was closed, and patency of the shunt was evidenced by an audible murmur throughout the study. Imaging studies were repeated every week for 9 ± 2 wk of follow-up (see RESULTS). After the final sedated imaging study, the animal was anesthetized and mechanically ventilated. To fix each heart in the end-diastolic configuration in a controlled manner at a known LV end-diastolic pressure (LVEDP), median sternotomy was performed and another imaging study was conducted at end expiration with LVEDP adjusted by phlebotomy to match the LVEDP in the control study. The animal was then euthanized with pentobarbital sodium, and the heart was perfusion fixed in situ with 2.5% buffered glutaraldehyde at the LVEDP in the control study (44).
Fig. 1.

A: schematic representation of the heart. X1, circumferential axis; X2, longitudinal axis; X3, radial axis; LAD, left anterior descending coronary artery; LCx, left circumflex coronary artery; LV, left ventricle; LA, left atrium. A precalibrated micromanometer pressure catheter was inserted into the apex to monitor LV pressure (LVP). A 9-Fr silicone catheter was inserted into the LA to monitor LA pressure (LAP), which was used in every imaging study to correct for baseline drifting of the LV micromanometer. B: the bead set consisted of 3 transmural columns of 4–6 gold beads (0.8 mm) and a surface gold bead (1.7 mm) above each column. Finite deformation of the myocardium was calculated from displacement of each material point (= bead) in space. Epi, epicardium; Endo, endocardium. C: diastolic filling. Diastolic filling was defined as the period beginning at mitral valve opening (MVO; time = 0%, pressure crossover of LVP and LAP) and ending at end diastole (ED; time = 100%, peak of ECG R wave). □, Longitudinal strain (E22) at 80% wall depth in a control animal. ECG, surface electrocardiogram. D: fiber-sheet coordinate system. Each cylinder represents a myofiber. Myofibers are organized into laminar “sheets,” which are ~4 cells thick and roughly stacked from apex to base (23). Sheet angle (β) is measured with reference to the positive radial axis (X3). Xf, fiber axis; Xs, sheet axis; Xn, axis normal to fiber-sheet plane.
Histology
Because the heart was fixed at the same LVEDP, fiber and sheet angles in the fixed hearts were assumed to represent the fiber-sheet structure (23, 36) in the end-diastolic reference configuration of the final study in vivo matched to the LVEDP of the control study (3, 5, 10, 37). To avoid the distortional effects of dehydration and embedding, histological measurements were obtained with freshly fixed heart tissue (3, 5, 10, 37). In the transmural block of tissue within the implanted marker set, the fiber (α) and sheet (β) angles were determined from epicardium to endocardium at every 1-mm-thick section sliced parallel to the epicardial tangent plane, as described previously (3); α and β were measured with reference to the positive circumferential and radial axes, respectively (Fig. 2).
Fig. 2.

Illustrative account of fiber (α) and sheet (β) angle measurement. A transmural rectangular block of tissue in the implanted bead set was carefully removed from the ventricular wall, with the edges of the block cut parallel to the local circumferential (X1), longitudinal (X2), and radial (X3) axes of the LV. The block was sliced into 1-mm-thick sections parallel to the epicardial tangent plane. In each 1-mm slice of tissue, α was measured with reference to the positive circumferential axis (X1). Note that the orientation of the fiber axis (Xf) rotates counterclockwise from epicardium to endocardium. The 1-mm slice of tissue was sectioned perpendicular to the mean fiber direction, and β was measured in the section plane with reference to the positive radial axis (X3). This process was repeated in all the 1-mm-slice tissues from the epicardium to the endocardium.
Finite strain analysis
The digital images from the X-ray image intensifiers were corrected for spherical distortion and magnification to reconstruct the 3D coordinates of the markers in each frame, and continuous, nonhomogeneous transmural distributions of 3D finite strains were calculated (3). Six independent finite strains (E11: circumferential strain, E22: longitudinal strain, E33: radial strain, E12: circumferential-longitudinal shear, E23: longitudinal-radial shear, and E13: circumferential-radial shear) were computed in the local cardiac coordinate system [circumferential (X1), longitudinal (X2), and radial (X3) axes; Ref. 27], which were used to compute another set of six finite strains (Eff: fiber strain, Ess: sheet strain, Enn: strain normal to the sheet plane, Efs: fiber-sheet shear, Esn: sheet shear, and Efn: fiber shear) in the local fiber-sheet coordinate system (Xf: fiber axis, Xs: sheet axis, Xn: axis normal to fiber-sheet plane) (Fig. 1C) through an orthogonal transformation using α and β at each depth (10). In layers where two separate sheet populations were present (see RESULTS), the mode of the dominant sheet population was used to calculate sheet strains. Values for α and β at a given time point in control conditions and hypertrophy were calculated from myocardial deformation with the configuration of the respective time point as the deformed state and the end-diastolic configuration of the final open-chest study with matched LVEDP as the reference state (37). In each set of finite strains, three normal strain components reflect myocardial stretch or shortening along each axis and three shear strains represent angle changes between pairs of the initially orthogonal axes. The data analysis includes fiber strain Eff, sheet strain Ess, and sheet shear Esn. Because the sign of sheet shear can be positive or negative depending on β, the absolute value of Esn was used in the data analysis to reflect the absolute change of sheet shear from the reference configuration at end diastole (ED).
Transmural finite strains were calculated for each frame as a deformed configuration during diastolic filling, with ED (peak of ECG R wave) as the reference configuration. Diastolic filling was defined as the period beginning at mitral valve opening (MVO; crossover of LV and LA pressures) and ending at ED (Fig. 1B). The strain data in each animal during diastolic filling were linearly interpolated at 10% increments in time between MVO (time = 0%) and ED (time = 100%). The strain time course was determined at three wall depths: 20% (subepicardium), 50% (midwall), and 80% (subendocardium) from the epicardial surface.
Statistical analysis
Values presented are means ± SE unless otherwise specified. A paired t-test was used to compare hemodynamic parameters. Two-factor repeated-measures ANOVA was used to determine the effects of hypertrophy and depth on transmural fiber and sheet angles and the effects of hypertrophy and time during diastolic filling on each strain component. The Student-Newman-Keuls method was used for ANOVA post hoc analysis. Statistical tests were performed with SigmaStat 3.0 (SPSS, Chicago, IL). Statistical significance was accepted at P < 0.05.
RESULTS
The dogs were followed for 9 ± 2 wk after construction of the fistula, and all dogs (n = 6) developed clinical signs of heart failure, including edema of extremities, pulmonary congestion, elevated LVEDP, and increased LV volume estimated from the apex-base length and basal diameter (4). However, there was no significant change in body weight [22.3 ± 0.6 vs. 22.5 ± 0.8 kg, P = not significant (NS)]. The measurement site was located 68 ± 4% of the distance from base to apex along the LV long axis, in a region of the anterior LV free wall ~1–2 cm septal of the anterolateral papillary muscle. Mean wall thickness at the measurement site was 11 ± 1 mm, and the deepest bead was located at 97 ± 3% wall depth from the epicardial surface. Heart weight was 280 ± 31 g, LV weight was 171 ± 18 g, and the ratio of LV weight (g) to body weight (kg) was 7.7 ± 0.9 g/kg. Volume changes within the bead sets indicated a 21% increase in the myocardial tissue volume at the measurement site.
Hemodynamic parameters
All the animals remained in sinus rhythm for the entire duration of the study. Although the heart rate increased from 105 ± 9 to 130 ± 12 beats/min, the duration of diastolic filling was variable and there was no significant difference between control and hypertrophy (304 ± 33 vs. 244 ± 42 ms, P = NS; Table 1). The indexes of systolic function [maximum LVP (LVPmax) and dP/dtmax] were unchanged (P = NS), whereas those of relaxation were significantly altered in hypertrophy. The magnitude of dP/dtmin decreased (−2,466 ± 190 vs. −2,076 ± 166 mmHg/s, P < 0.05), and the time constant of isovolumic LVP decline (28, 34, 42) was significantly prolonged from 32 ± 2 to 43 ± 1 ms (P < 0.05).
Table 1.
Hemodynamic parameters
| Control | Hypertrophy | P Value | |
|---|---|---|---|
| Heart rate, beats/min | 105±9 | 130±12 | <0.05 |
| LVPmax, mmHg | 113±7 | 117±5 | NS |
| LVP at MVO, mmHg | 4±2 | 19±4 | <0.01 |
| LVEDP, mmHg | 5±2 | 21±4 | <0.05 |
| Diastolic filling, ms | 304±33 | 244±42 | NS |
| dP/dtmax, mmHg/s | 2,476±203 | 2,330±216 | NS |
| dP/dtmin, mmHg/s | −2,466±190 | −2,076±166 | <0.05 |
| τ, ms | 32±2 | 43±1 | <0.05 |
Values are means ± SE; n = 6. LVPmax, maximum left ventricular pressure (LVP); MVO, mitral valve opening; LVEDP, left ventricular end-diastolic pressure; dP/dtmax and dP/dtmin, peak positive and negative dP/dt, respectively; τ, time constant of isovolumic LVP decline; NS, not significant.
Transmural fiber and sheet angles
There was no difference in transmural fiber angle distribution between control conditions and hypertrophy at MVO. In either control conditions or hypertrophy, transmural fiber angles did not significantly change from MVO to ED (P = NS; Fig. 3). Similarly, transmural sheet angles did not change during diastolic filling in control conditions (P = NS). In contrast, transmural sheet angles significantly decreased from MVO to ED in hypertrophy (P < 0.05). Because transmural sheet angles were negative at MVO, a decrease in angle indicates that the sheets become more oblique to the radial axis toward ED in hypertrophy, contributing to diastolic wall thinning (Fig. 4).
Fig. 3.

Transmural fiber and sheet angles during diastolic filling. Values are means ± SE (n = 6). Both in control conditions and hypertrophy, transmural fiber angles did not significantly change from MVO to ED [P = not significant (NS)]. Similarly, transmural sheet angles did not change during diastolic filling in control (P = NS). In contrast, transmural sheet angles significantly decreased from MVO to ED in hypertrophy (*P < 0.05). See text for details.
Fig. 4.
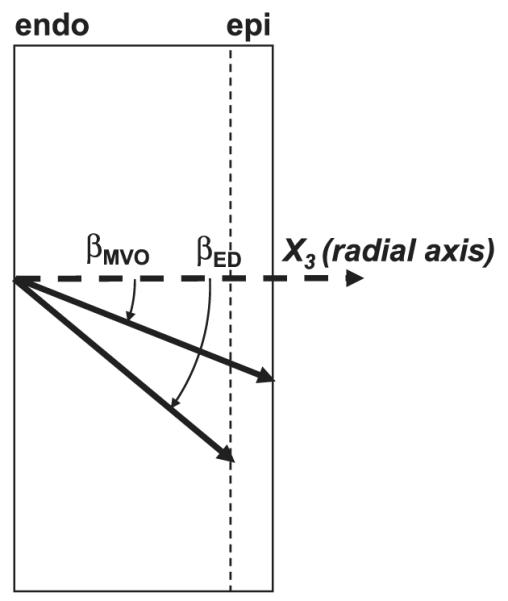
Direction of sheet angle change during diastolic filling. Because transmural sheet angles (βMVO and βED, sheet angles at MVO and ED, respectively) were negative at MVO, a decrease in sheet angle during diastolic filling (Fig. 2) indicates that the sheets become more oblique to the radial axis toward ED.
Strain time course
Figure 5 shows the time course of cardiac strains during the control study at subepicardial and subendocardial layers. The reference configuration was ED for each contraction. All cardiac strain components exhibited a substantial transmural gradient at MVO that was less apparent later in diastole. The greatest change in strain values occurred in the first third of the diastolic filling, or early ventricular filling. For example, E33 at the endocardium achieved 73% of the total diastolic deformation during the first third of diastole (0.297 ± 0.063 to 0.081 ± 0.024). Typically, there was little deformation in the last third of the diastolic filling period, which is consistent mechanically with the E wave-to-A wave ratio >1 in transmitral flow measurement of the normal heart.
Fig. 5.

Cardiac strain time course during diastolic filling in control. Values are means ± SE (n = 6). Epi and Endo, 20% and 80% wall depth from the epicardial surface, respectively.
Figure 6 shows the time course of strains rotated into the fiber-sheet coordinate system and calculated with two different reference configurations. Figure 6A shows strain values calculated with the reference configuration at ED in control conditions, which illustrates both the tissue remodeling and increase in diastolic dimensions that occurred with volume-overload hypertrophy. It should be noted that at MVO (diastolic filling period = 0%), fiber strain Eff in hypertrophy was significantly greater than control, indicating that tissue in the fiber direction is substantially longer in hypertrophy. These changes were sustained throughout the diastolic filling period, and ED fiber strain in hypertrophy at the subepicardium and subendocardium was 0.106 ± 0.032 and 0.159 ± 0.053, respectively, indicating that the myofibers underwent a stretch of >10% at each diastole relative to the control heart. As a result, the time course of fiber strain between control conditions and hypertrophy was significantly different (P < 0.05). Sheet strain at subepicardium in both control conditions and hypertrophy was small during diastolic filling, and there was no significant difference in the time course between control and hypertrophy. In contrast, subendocardial sheet strain was significantly greater in hypertrophy than in control conditions. At MVO, sheet strain in hypertrophy was 0.388 ± 0.116, whereas that of the control heart was 0.157 ± 0.053. ED sheet strain in hypertrophy at subendocardium was 0.205 ± 0.073, indicating that there was a diastolic extension in the sheet direction of ~20% relative to the control heart. At both subepicardium and subendocardium, this shear strain was greater in hypertrophy than in control conditions during diastolic filling.
Fig. 6.

Fiber-sheet strain time course during diastolic filling. In A, the reference configuration for both control and hypertrophy conditions was determined at ED of the control study. In B, the reference configuration for control and hypertrophy was determined at ED of the control and hypertrophic states, respectively. Values are means ± SE (n = 6). Eff, fiber strain; Ess, sheet strain; Esn, sheet shear. Epi and Endo: 20% and 80% wall depth from the epicardial surface, respectively. *P < 0.05 by 2-factor repeated-measures ANOVA (control vs. hypertrophy).
To compare the time course of diastolic deformation in control conditions and volume-overload hypertrophy independent of end-diastolic remodeling, another set of fiber-sheet strains was calculated with the reference configuration at ED of the respective state (Fig. 6B). The overall time course of fiber strain was not significantly different between control conditions and hypertrophy (P = NS), indicating that hypertrophy did not affect fiber stretch during diastolic filling relative to ED configuration. At the subepicardium, the majority of the fiber deformation (Eff) occurred during the first third of the diastolic filling period in both control conditions and hypertrophy. In contrast, at the subendocardium, there is substantial deformation in hypertrophy occurring during diastasis and in the last third of diastole, corresponding to the time of atrial contraction. Sheet strain Ess was greater at subendocardium than subepicardium in both control conditions and hypertrophy, and there was no significant difference in the time course between control and hypertrophy (P = NS). Sheet shear Esn in control showed a significant transmural gradient, being greater at subendocardium than subepicardium (0.167 ± 0.025 vs. 0.067 ± 0.017, P < 0.05). Sheet shear in hypertrophy exhibited an even greater transmural gradient, with a marked increase of sheet shear at subendocardium compared with subepicardium (0.331 ± 0.067 vs. 0.094 ± 0.021, P < 0.05). As a result, there was a significant difference in the time course of the sheet shear at subendocardium between control conditions and hypertrophy (P < 0.05). Because end-systolic sheet shear strains in control conditions and hypertrophy were similar (Table 2), this result indicates that hypertrophy caused a significant delay, or rightward shift, of the time course of sheet shear during diastole.
Table 2.
End-systolic strain values
| End-Systolic Strains | Control | Hypertrophy | P Value |
|---|---|---|---|
| Eff | −0.104±0.010 | −0.108±0.008 | NS |
| Ess | 0.136±0.029 | 0.121±0.071 | NS |
| Esn | −0.123±0.023 | −0.146±0.036 | NS |
Values are means ± SE; n = 6. Eff, fiber strain; Ess, sheet strain; Esn, sheet shear.
DISCUSSION
The aim of the present study was to examine the changes in diastolic deformation in the LV wall after hypertrophic growth induced by chronic volume overload. As the myocardium remodeled in response to volume overload, there was elongation in both the fiber and sheet directions, which were particularly prominent at the endocardium, and the orientation of the laminar sheets of the myocardium became less radial. The results show for the first time that the majority of fiber deformation in the anterior LV free wall occurs during the first third of the diastolic filling period and there is little or no fiber strain late in diastole. During the early diastolic time period, there was also substantial shearing deformation, which was particularly prominent in the endocardium after volume overload. This enhanced shearing deformation was not accompanied by increased fiber strain. These results imply that the enhanced early diastolic filling is associated primarily with remodeling-induced changes in the laminar architecture.
Diastolic hemodynamics and volume-overload hypertrophy
LV filling dynamics is a result of a complex interaction of filling pressure (43), mitral valve mechanics (20), and LV wall properties (6), which is primarily determined by active relaxation and passive stiffness (11, 46). Impairment of these LV wall properties is associated with a clinical syndrome characterized by the signs and symptoms of heart failure despite preserved systolic function (45, 46). The concept of “diastolic heart failure” is clinically well characterized (2, 40), and it represents a major public health issue that accounts for almost half of all heart failure cases (39) and >25% of the total cost of heart failure treatment (12, 29). Nevertheless, the proposed mechanism of diastolic heart failure is widely heterogeneous (47), and, at a basic level, whether there exists consistent abnormality of intrinsic diastolic properties that can explain the occurrence of diastolic heart failure is still a topic of active debate (7, 21, 45).
In chronic volume overload induced by aortocaval shunt, diastolic dysfunction in both active relaxation and passive stiffness has been documented. The LVEDP-volume curve in this model of chronic volume overload is similar to that of clinically observed chronic volume overload, most commonly mitral and aortic regurgitation. Both are characterized by a progressive rightward shift and an increase in the slope, or passive stiffness (8, 9, 26). The rightward shift of the curve in chronic volume overload is ascribed not only to myofiber elongation (13, 30) and rearrangement (4) but also to diastolic creep, or time-dependent elongation of myofibers (1, 26), which may be present in pressure overload (25) and chronic infarction, where infarct scar tissue has replaced portions of the LV (19). In the present study, diastolic relaxation was significantly reduced despite the lack of significant change in indexes of systolic function. Therefore, this preparation appears to be a good model of diastolic dysfunction. The present study has identified abnormal sheet mechanics in this model of diastolic dysfunction; however, whether this mechanical abnormality may or may not be found in the clinical population of diastolic heart failure remains to be seen.
Diastolic fiber and sheet mechanics and volume-overload hypertrophy
The results of the present study indicate that the majority of diastolic deformation in the LV anterior wall occurs during the first third of the diastolic filling period. This temporal pattern is consistent with the diastolic deformation obtained noninvasively in humans by tagged MRI (22) and ultrasound strain rate imaging (16). There is little or no fiber strain late in diastole (Fig. 5). During early diastolic filling, there was substantial shearing deformation, which was particularly prominent in the endocardium after volume overload (Fig. 6B). To examine the remodeling that occurs in the ventricular wall after volume overload we examined the diastolic strains with the initial control ED as the reference. Our results demonstrate that fiber strain, sheet strain, and sheet shear strain were significantly greater in hypertrophy compared with control conditions (Fig. 6A). Although the study was not designed to separate the factors responsible for these changes, the increase in tissue length is compatible with the known increases in cell length and cell rearrangement and increases in diastolic pressure observed in this model (4, 13, 30). There was also a significant increase in the change of transmural sheet angles between control conditions and hypertrophy during diastolic filling (Fig. 3), likely reflecting an increased filling due to volume overload. However, because end-diastolic remodeling in β between control and hypertrophy was not significant (4), the dynamic decrease of β during diastolic filling in hypertrophy is mainly accounted for by a change of β at MVO (Figs. 3 and 7).
Fig. 7.

Schematic representation of fiber-sheet strains during diastolic filling. A: control, B: hypertrophy. βED is not significantly different between control (βED-control) and hypertrophy (βED-hypertrophy). In contrast, βMVO is greater in control (βMVO-control) than in hypertrophy (βMVO-hypertrophy). The net result is a significantly greater sheet shear Esn, which contributes to greater wall thinning during diastolic filling in hypertrophy than in control conditions. Eff, fiber stretch; Ess, sheet shortening.
To more clearly elucidate the effects of ventricular filling on deformation in the LV wall and to partially separate them from the effects of tissue remodeling, we examined strains calculated with ED of each contraction as the reference configuration (Fig. 6B). Fiber and sheet strains with reference to the ED configuration of the hypertrophic state were similar to those of the control state. Because both diastolic volume and stroke volume are increased in this model (26, 31, 32, 38), the lack of increase in fiber strain during diastole after volume overload was an unexpected finding. In contrast, sheet shear Esn was enhanced at the subendocardial layer, resulting in a rightward shift of the time course (Fig. 6B). These results suggest that enhanced ventricular filling in this model is achieved by enhanced shearing of the radially oriented laminar sheet structure, which could contribute to wall thinning. Spotnitz et al. (35) elegantly demonstrated that motion of the sheets contributes importantly to wall thinning during volume increases in the heart, and our recent studies (37) showed predicted sheet motion in normal diastole in the open-chest dog heart. The results in the present study indicate that factors that influence sheet motion may have important implications for ventricular function under pathological conditions. Volume-overload hypertrophy is associated not only with myofiber lengthening and rearrangement but also with dramatic changes in the arrangements of ECM components (33). It has been demonstrated that this model of volume overload is associated with no changes in collagen concentration (17), although the nature of the collagen cross-links may be changed (17, 18). Thus we speculate that the mechanism of a reduction in interlaminar stiffness may not be associated with a reduction in collagen amount but more likely a shift to a more compliant type III collagen or to disruption of interlaminar struts.
In conclusion, fiber strain and shearing deformation occur predominantly in the first third of diastolic filling period, and chronic volume overload induces remodeling in lengthening of the fiber and reorientation of the laminar sheet architecture. Sheet shear was significantly altered and delayed at the subendocardial layer during diastolic filling, whereas the magnitude of fiber stretch during diastolic filling is not altered in volume overload. These findings indicate that the enhanced filling associated with this model is achieved by enhanced sheet shear early in diastole. These results provide the first evidence that changes in the motion of radially oriented myolaminar sheets may play an important functional role in the pathology of diastolic dysfunction in this model of volume-overload hypertrophy.
ACKNOWLEDGMENTS
We thank our staff, Rish Pavelec and Rachel Alexander, for excellent managerial and surgical assistance.
GRANTS This work was supported by American Heart Association Western States Affiliate Grant 0225001Y (H. Ashikaga) and National Heart, Lung, and Blood Institute Grant HL-32583 (J. W. Covell).
REFERENCES
- 1.Alexander RS. Viscoelastic determinants of muscle contractility and “cardiac tone.”. Fed Proc. 1962;21:1001. [PubMed] [Google Scholar]
- 2.Anonymous How to diagnose diastolic heart failure. European Study Group on Diastolic Heart Failure. Eur Heart J. 1998;19:990–1003. doi: 10.1053/euhj.1998.1057. [DOI] [PubMed] [Google Scholar]
- 3.Ashikaga H, Criscione JC, Omens JH, Covell JW, Ingels NB., Jr. Transmural left ventricular mechanics underlying torsional recoil during relaxation. Am J Physiol Heart Circ Physiol. 2004;286:H640–H647. doi: 10.1152/ajpheart.00575.2003. [DOI] [PMC free article] [PubMed] [Google Scholar]
- 4.Ashikaga H, Omens JH, Covell JW. Time-dependent remodeling of transmural architecture underlying abnormal ventricular geometry in chronic volume overload heart failure. Am J Physiol Heart Circ Physiol. 2004;287:H1994–H2002. doi: 10.1152/ajpheart.00326.2004. [DOI] [PMC free article] [PubMed] [Google Scholar]
- 5.Ashikaga H, Omens JH, Ingels NB, Jr, Covell JW. Transmural mechanics at left ventricular epicardial pacing site. Am J Physiol Heart Circ Physiol. 2004;286:H2401–H2407. doi: 10.1152/ajpheart.01013.2003. [DOI] [PMC free article] [PubMed] [Google Scholar]
- 6.Bell SP, Nyland L, Tischler MD, McNabb M, Granzier H, LeWinter MM. Alterations in the determinants of diastolic suction during pacing tachycardia. Circ Res. 2000;87:235–240. doi: 10.1161/01.res.87.3.235. [DOI] [PubMed] [Google Scholar]
- 7.Burkhoff D, Maurer MS, Packer M. Heart failure with a normal ejection fraction: is it really a disorder of diastolic function? Circulation. 2003;107:656–658. doi: 10.1161/01.cir.0000053947.82595.03. [DOI] [PubMed] [Google Scholar]
- 8.Carabello BA. Aortic regurgitation: hemodynamic determinants of prognosis. In: DiSesa VJ, editor. Aortic Regurgitation: Medical and Surgical Management. Dekker; New York: 1986. [Google Scholar]
- 9.Corin WJ, Murakami T, Monrad ES, Hess OM, Krayenbuehl HP. Left ventricular passive diastolic properties in chronic mitral regurgitation. Circulation. 1991;83:797–807. doi: 10.1161/01.cir.83.3.797. [DOI] [PubMed] [Google Scholar]
- 10.Costa KD, Takayama Y, McCulloch AD, Covell JW. Laminar fiber architecture and three-dimensional systolic mechanics in canine ventricular myocardium. Am J Physiol Heart Circ Physiol. 1999;276:H595–H607. doi: 10.1152/ajpheart.1999.276.2.H595. [DOI] [PubMed] [Google Scholar]
- 11.Covell JW. Factors influencing diastolic function. Possible role of the extracellular matrix. Circulation. 1990;81:III155–III158. [PubMed] [Google Scholar]
- 12.Dauterman KW, Massie BM, Gheorghiade M. Heart failure associated with preserved systolic function: a common and costly clinical entity. Am Heart J. 1998;135:S310–S319. doi: 10.1016/s0002-8703(98)70258-3. [DOI] [PubMed] [Google Scholar]
- 13.Gerdes AM, Campbell SE, Hilbelink DR. Structural remodeling of cardiac myocytes in rats with arteriovenous fistulas. Lab Invest. 1988;59:857–861. [PubMed] [Google Scholar]
- 14.Grossman W. Cardiac hypertrophy: useful adaptation or pathologic process? Am J Med. 1980;69:576–584. doi: 10.1016/0002-9343(80)90471-4. [DOI] [PubMed] [Google Scholar]
- 15.Grossman W, Barry WH. Diastolic pressure-volume relations in the diseased heart. Fed Proc. 1980;39:148–155. [PubMed] [Google Scholar]
- 16.Herbots L, Maes F, D’Hooge J, Claus P, Dymarkowski S, Mertens P, Mortelmans L, Bijnens B, Bogaert J, Rademakers FE, Sutherland GR. Quantifying myocardial deformation throughout the cardiac cycle: a comparison of ultrasound strain rate, grey-scale M-mode and magnetic resonance imaging. Ultrasound Med Biol. 2004;30:591–598. doi: 10.1016/j.ultrasmedbio.2004.02.003. [DOI] [PubMed] [Google Scholar]
- 17.Herrmann KL, McCulloch AD, Omens JH. Glycated collagen cross-linking alters cardiac mechanics in volume-overload hypertrophy. Am J Physiol Heart Circ Physiol. 2003;284:H1277–H1284. doi: 10.1152/ajpheart.00168.2002. [DOI] [PMC free article] [PubMed] [Google Scholar]
- 18.Iimoto DS, Covell JW, Harper E. Increase in cross-linking of type I and type III collagens associated with volume-overload hypertrophy. Circ Res. 1988;63:399–408. doi: 10.1161/01.res.63.2.399. [DOI] [PubMed] [Google Scholar]
- 19.Janz RF, Waldron RJ. Predicted effect of chronic apical aneurysms on the passive stiffness of the human left ventricle. Circ Res. 1978;42:255–263. doi: 10.1161/01.res.42.2.255. [DOI] [PubMed] [Google Scholar]
- 20.Karlsson MO, Glasson JR, Bolger AF, Daughters GT, Komeda M, Foppiano LE, Miller DC, Ingels NB., Jr. Mitral valve opening in the ovine heart. Am J Physiol Heart Circ Physiol. 1998;274:H552–H563. doi: 10.1152/ajpheart.1998.274.2.H552. [DOI] [PubMed] [Google Scholar]
- 21.Kass DA, Bronzwaer JG, Paulus WJ. What mechanisms underlie diastolic dysfunction in heart failure? Circ Res. 2004;94:1533–1542. doi: 10.1161/01.RES.0000129254.25507.d6. [DOI] [PubMed] [Google Scholar]
- 22.Kuijer JP, Marcus JT, Gotte MJ, van Rossum AC, Heethaar RM. Three-dimensional myocardial strains at end-systole and during diastole in the left ventricle of normal humans. J Cardiovasc Magn Reson. 2002;4:341–351. doi: 10.1081/jcmr-120013299. [DOI] [PubMed] [Google Scholar]
- 23.LeGrice IJ, Smaill BH, Chai LZ, Edgar SG, Gavin JB, Hunter PJ. Laminar structure of the heart: ventricular myocyte arrangement and connective tissue architecture in the dog. Am J Physiol Heart Circ Physiol. 1995;269:H571–H582. doi: 10.1152/ajpheart.1995.269.2.H571. [DOI] [PubMed] [Google Scholar]
- 24.LeGrice IJ, Takayama Y, Holmes JW, Covell JW. Impaired subendocardial function in tachycardia-induced cardiac failure. Am J Physiol Heart Circ Physiol. 1995;268:H1788–H1794. doi: 10.1152/ajpheart.1995.268.5.H1788. [DOI] [PubMed] [Google Scholar]
- 25.LeWinter MM, Engler R, Pavelec RS. Time-dependent shifts of the left ventricular diastolic filling relationship in conscious dogs. Circ Res. 1979;45:641–653. doi: 10.1161/01.res.45.5.641. [DOI] [PubMed] [Google Scholar]
- 26.McCullagh WH, Covell JW, Ross J., Jr. Left ventricular dilatation and diastolic compliance changes during chronic volume overloading. Circulation. 1972;45:943–951. doi: 10.1161/01.cir.45.5.943. [DOI] [PubMed] [Google Scholar]
- 27.Meier GD, Ziskin MC, Santamore WP, Bove AA. Kinematics of the beating heart. IEEE Trans Biomed Eng. 1980;27:319–329. doi: 10.1109/TBME.1980.326740. [DOI] [PubMed] [Google Scholar]
- 28.Mirsky I, Pasipoularides A. Clinical assessment of diastolic function. Prog Cardiovasc Dis. 1990;32:291–318. doi: 10.1016/0033-0620(90)90018-w. [DOI] [PubMed] [Google Scholar]
- 29.O’Connell JB, Bristow MR. Economic impact of heart failure in the United States: time for a different approach. J Heart Lung Transplant. 1994;13:S107–S112. [PubMed] [Google Scholar]
- 30.Omens JH, Covell JW. Transmural distribution of myocardial tissue growth induced by volume-overload hypertrophy in the dog. Circulation. 1991;84:1235–1245. doi: 10.1161/01.cir.84.3.1235. [DOI] [PubMed] [Google Scholar]
- 31.Ross J, Jr, McCullagh WH. Nature of enhanced performance of the dilated left ventricle in the dog during chronic volume overloading. Circ Res. 1972;30:549–556. doi: 10.1161/01.res.30.5.549. [DOI] [PubMed] [Google Scholar]
- 32.Ross J, Jr, Sonnenblick EH, Taylor RR, Spotnitz HM, Covell JW. Diastolic geometry and sarcomere lengths in the chronically dilated canine left ventricle. Circ Res. 1971;28:49–61. doi: 10.1161/01.res.28.1.49. [DOI] [PubMed] [Google Scholar]
- 33.Ross RS, Borg TK. Integrins and the myocardium. Circ Res. 2001;88:1112–1119. doi: 10.1161/hh1101.091862. [DOI] [PubMed] [Google Scholar]
- 34.Smith VE, Zile MR. Relaxation and diastolic properties of the heart. In: Fozzard HA, editor. The Heart and Cardiovascular System. Raven; New York, NY: 1992. pp. 1353–1367. [Google Scholar]
- 35.Spotnitz HM, Spotnitz WD, Cottrell TS, Spiro D, Sonnenblick EH. Cellular basis for volume related wall thickness changes in the rat left ventricle. J Mol Cell Cardiol. 1974;6:317–331. doi: 10.1016/0022-2828(74)90074-1. [DOI] [PubMed] [Google Scholar]
- 36.Streeter DD, Jr, Spotnitz HM, Patel DP, Ross J, Jr, Sonnenblick EH. Fiber orientation in the canine left ventricle during diastole and systole. Circ Res. 1969;24:339–347. doi: 10.1161/01.res.24.3.339. [DOI] [PubMed] [Google Scholar]
- 37.Takayama Y, Costa KD, Covell JW. Contribution of laminar myofiber architecture to load-dependent changes in mechanics of LV myocardium. Am J Physiol Heart Circ Physiol. 2002;282:H1510–H1520. doi: 10.1152/ajpheart.00261.2001. [DOI] [PubMed] [Google Scholar]
- 38.Taylor RR, Covell JW, Ross JJ. Left ventricular function in experimental aorto-caval fistula with circulatory congestion and fluid retention. J Clin Invest. 1968;47:1333–1342. doi: 10.1172/JCI105825. [DOI] [PMC free article] [PubMed] [Google Scholar]
- 39.Vasan RS, Benjamin EJ, Levy D. Prevalence, clinical features and prognosis of diastolic heart failure: an epidemiologic perspective. J Am Coll Cardiol. 1995;26:1565–1574. doi: 10.1016/0735-1097(95)00381-9. [DOI] [PubMed] [Google Scholar]
- 40.Vasan RS, Levy D. Defining diastolic heart failure: a call for standardized diagnostic criteria. Circulation. 2000;101:2118–2121. doi: 10.1161/01.cir.101.17.2118. [DOI] [PubMed] [Google Scholar]
- 41.Waldman LK, Fung YC, Covell JW. Transmural myocardial deformation in the canine left ventricle. Normal in vivo three-dimensional finite strains. Circ Res. 1985;57:152–163. doi: 10.1161/01.res.57.1.152. [DOI] [PubMed] [Google Scholar]
- 42.Weiss JL, Frederiksen JW, Weisfeldt ML. Hemodynamic determinants of the time-course of fall in canine left ventricular pressure. J Clin Invest. 1976;58:751–760. doi: 10.1172/JCI108522. [DOI] [PMC free article] [PubMed] [Google Scholar]
- 43.Yellin EL, Meisner JS. Physiology of diastolic function and transmitral pressure-flow relations. Cardiol Clin. 2000;18:411–433. doi: 10.1016/s0733-8651(05)70153-3. [DOI] [PubMed] [Google Scholar]
- 44.Yoran C, Covell JW, Ross J., Jr. Rapid fixation of the left ventricle: continuous angiographic and dynamic recordings. J Appl Physiol. 1973;35:155–157. doi: 10.1152/jappl.1973.35.1.155. [DOI] [PubMed] [Google Scholar]
- 45.Zile MR, Baicu CF, Gaasch WH. Diastolic heart failure–abnormalities in active relaxation and passive stiffness of the left ventricle. N Engl J Med. 2004;350:1953–1959. doi: 10.1056/NEJMoa032566. [DOI] [PubMed] [Google Scholar]
- 46.Zile MR, Brutsaert DL. New concepts in diastolic dysfunction and diastolic heart failure. I. Diagnosis, prognosis, and measurements of diastolic function. Circulation. 2002;105:1387–1393. doi: 10.1161/hc1102.105289. [DOI] [PubMed] [Google Scholar]
- 47.Zile MR, Brutsaert DL. New concepts in diastolic dysfunction and diastolic heart failure. II. Causal mechanisms and treatment. Circulation. 2002;105:1503–1508. doi: 10.1161/hc1202.105290. [DOI] [PubMed] [Google Scholar]