

Abstract
Purpose
The X-linked ectodermal dysplasia receptor (XEDAR) is a novel receptor of the Tumor Necrosis Factor Receptor Family that binds to ectodysplasin-A2 (EDA-A2) and induces cell death. The purpose of this study was to determine the tumor-suppressive potential of XEDAR in the development of breast cancer.
Experimental Design
We analyzed the expression of XEDAR in breast cancer cell lines and tumor samples using quantitative real-time RT-PCR analysis and immunoblotting. We analyzed the human XEDAR gene promoter for the presence of any CpG island and examined its methylation status using methylation-specific real-time PCR. We examined the effect of 5-aza-2′-deoxycytidine (5-Aza-dC) on the expression of XEDAR and sensitivity to EDA-A2-induced apoptosis in breast cancer cell lines.
Results
Expression of XEDAR, but not EDA-A2, was downregulated in most tumorigenic breast cancer cell lines and tumor samples. Loss of XEDAR expression correlated with the hypermethylation of its promoter. Ectopic expression of XEDAR in MDA-MB-231 cells resulted in significant induction of apoptosis and reduction in colony formation. Treatment with 5-Aza-dC restored XEDAR expression in breast cancer cell lines with methylated XEDAR promoter and sensitized them to EDA-A2-induced cell death.
Conclusions
Our results suggest that XEDAR expression is down-regulated in most breast cancers via promoter methylation, which may contribute to accelerated tumor development by blocking EDA-A2-induced cell death. XEDAR may represent a novel breast tumor suppressor gene and restoration of its expression by treatment with DNA demethylating agents may represent an attractive approach for the treatment of breast cancer.
Introduction
The mammalian breast is believed to be a modified sweat gland that consists of a fat pad of mesodermal origin into which epithelial cells of ectodermal origin proliferate (1). Ectodysplasin-A (EDA) is a novel ligand of the Tumor Necrosis Factor (TNF) family that controls ectodermal differentiation (2). EDA-A1 and EDA-A2 are two major isoforms of EDA that differ from each other by two amino acids and bind to two distinct receptors, EDAR (Ectodermal Dysplasia Receptor) and XEDAR (X-linked Ectodermal Dysplasia Receptor), respectively (3, 4). Mutations in the ectodysplasin gene (Eda) have been linked to X-linked hypohidrotic ectodermal dysplasia, which is characterized by the absence or deficient function of hair, teeth, and sweat glands (5). Consistent with the ectodermal origin of breast, a common associated abnormality in patients with anhidrotic ectodermal dysplasia is the absence or under-development of breasts (6).
Unlike most TNF family receptors, XEDAR is a type III transmembrane protein (lacking an NH2-terminal signal peptide) that bears 32% sequence homology with EDAR in the extracellular ligand-binding domain (4). However, XEDAR possesses a unique intracellular region with no significant homology to other TNF family receptors or other signaling proteins (4). In particular, XEDAR lacks a discernible death domain that has been associated with the induction of apoptosis by the death receptors of the TNF receptor family (4, 7). Although XEDAR lacks a death domain, it is capable of inducing cell death in a caspase 8- and FADD-dependent manner (8).
The death receptors of the TNFR family are considered to be tumor suppressors as their loss is expected to provide a survival advantage to the tumor cells (9, 10). Consistent with this notion, loss of expression of death receptors and their downstream signaling intermediates (e.g. caspase 8 and caspase 10) has been documented in several cancers (11–13). Based on its ability to induce cell death, we hypothesized that XEDAR may also act as tumor suppressor gene. In this report, we present evidence that expression of XEDAR, but not EDA-A2, is silenced in breast cancer-derived tumorigenic cell line and tumor samples, and this inactivation can be attributed to aberrant methylation of its promoter. Our results suggest that XEDAR is a novel breast tumor suppressor gene.
Materials and Methods
Tissue samples, Cell lines and Reagents
Breast cancer cell lines were either obtained from ATCC or from Dr. A.F Gazdar, UT Southwestern Medical Centre at Dallas and maintained as described previously (14, 15) Human mammary epithelial cells were obtained from Cambrex (East Rutherford, NJ) and maintained according to the instructions of the supplier. Human breast tissue specimens were obtained from Health Sciences Tissue bank, Magee Women's Hospital, Pittsburgh. A rabbit polyclonal antibody against XEDAR was obtained from ProSci (Poway, CA). EDA-A2 and 5-Aza-2-deoxycytidine (5-Aza-dC) were purchased from R&D systems (Minneapolis, MN) and Sigma (St. Louis, MO), respectively.
Gene Expression in Cell lines and Tissue samples
Expression of human XEDAR and EDA-A2 mRNAs were studied by quantitative real-time PCR (qRT-PCR) as described previously (16). Briefly, RNA was isolated using the RNeasy Mini kit (Qiagen, Valenica, CA) and qRT-PCR reactions were performed in triplicate using an ABI Prism 7000 system and SYBR green-Taq polymerase mix to determine the relative change in the expression of XEDAR/EDA-A2 genes. β-actin was used as a housekeeping control. qRT-PCR data (Ct values) was analyzed using the 2−ΔΔ Ct method (17), and the data presented as fold change in target gene expression ± standard error of mean. A cDNA from K562 cell line was used as negative control in real time PCR. Gene specific primers used in real-time PCR are listed in Supplementary Table 2. 5-Aza-2-deoxycytidine (5-Aza-dC) treatment of cell lines was done using a protocol described previously (18). Briefly, cells were grown to 50–60% confluency in culture medium containing 2 and 5 μg/ml 5-Aza-dC. After 4 days, the cells were washed and replated in fresh culture medium (without 5-Aza-dC) for 24 h before harvesting for RNA isolation to check the expression of XEDAR.
Promoter analysis and identification of CpG Island
A database search of transcriptional start sites suggested an alternate promoter on Chromosome X with transcription start site (TSS) at 65775833. We analyzed one Kb region around TSS using MethPrimer (19) and Methyl Express (Applied Biosystem, Foster City, CA) softwares and identified a 317 bp CpG island located −64 to +253 bp upstream of the TSS.
DNA extraction and methylation-specific real-time PCR
Genomic DNA was extracted from primary tumors, cell lines and non-malignant cells using DNeasy tissue kit (Qiagen, Valencia, CA) and bisulfite modification of genomic DNA was performed using Imprint DNA modification kit (Sigma, St. Louis, MO) following manufacturer's instructions. Real-time PCR primers (Figure 2A) were designed using the MethPrimer software (20). Real-time methylation-specific PCR was performed using sets of primers for methylated and unmethylated regions of XEDAR as described by Bastian et. al (21). Genomic DNA and water (blank) were used as controls, while unmethylated MyoD1 was used as an internal reference standard (21). Quantitative methylation ratio was calculated as percent of the ratio of fluorescence emission of PCR product using methylated primer at the promoter of interest to that of MyoD1, as reported previously (22).
Figure 2. Methylation status of XEDAR in human breast cancer cell lines.

A. A schematic representation of the 5' region of human XEDAR gene, the grey box below indicates the position of CpG rich region. The positions of primers to study the methylation status are indicated. TSS, transcription start site. B. The DNA was extracted from cell lines and tissue specimens after bisufite modification as explained in Material and Methods. The modified DNA was used to run qMSP (qRT-methylation specific real-time PCR) using methylation-specific and unmethylation-specific primers. A representative pattern of hypermethylation status of various cell lines is presented here. The closed box represent positive PCR while open box represent negative reaction; ND, Not determined.
Cell viability (MTS) assay
Cell viability was measured using the MTS reagent as described previously (37).
Statistical analysis
Receiver operator characteristic (ROC) curve, a plot of sensitivity and specificity across all cut off values, was used to study the accuracy of XEDAR methylation in discriminating cancer from non-malignant tissues. The CpG island methylation data was used to generate ROC curve using MedCalc software (MedCalc Software, Marikerke, Belgium) (23). The quantitative methylation data for XEDAR was correlated with tumor diagnosis using non-parametric Mann-Whitney U test using Analyse-it ® statistical software (Analyse-it software, Ltd, UK). All tests were two-tailed and P-values <0.05 were considered significant.
Results
Expression pattern of XEDAR and EDA-A2 in human breast cancer cell lines
We began by examining the expression of XEDAR using real-time RT-PCR analysis in a panel of 10 breast cancer cell lines developed by Dr. Adi Gazdar (UT Southwestern Medical Center, Dallas) (14, 15). The clinical and pathological features of these cell lines are summarized in Supplementary Table 1. All the cell lines, with the exception of HCC1008 and HCC1428, were derived from primary tumor samples and had the pathological diagnosis of ductal carcinoma. The HCC1008 cell line was derived from the lymph node of a patient with metastatic ductal carcinoma, whereas the HCC1428 cell line was derived from malignant pleural effusion of a patient with metastatic adenocarcinoma, not otherwise specified. The cell lines varied with respect to the expression of estrogen receptors (ER) and progesterone receptors (PR), and the oncogene HER2/neu (Supplementary Table 1). As shown in Figure 1A, significant expression of XEDAR mRNA was detected only in the HCC712 cell line, which was derived from primary breast cancer (Stage IIB, Grade 2, ductal carcinoma), and has low tumorigenic potential. The expression of XEDAR protein in the HCC712 cell line was confirmed by Western blotting (Figure 1B).
Figure 1. Down regulation of human XEDAR expression in breast cancer cell lines and tissues.

A. Expression of XEDAR was determined by qRT-PCR and normalized to β-actin as house keeping control in 10 human breast cancer cell lines obtained from Dr. A. F. Gazdar. PCR reactions were performed in triplicate and the data presented as fold change in target gene expression (Mean ± S.E.) over the negative control sample, as explained in the Material and Methods section. XEDAR expression was observed in either non-tumorigenic cell lines derived from mammary epithelial cells or in normal breast samples, but not in tumorigenic or highly metastatic breast cancer cell lines. B. Western blot showing high level expression of XEDAR protein in the HCC712 cells. Tubulin was used as an internal loading control. C. XEDAR mRNA expression, as determined by qRT-PCR, in an additional panel of 6 breast cancer cell lines representing different stages of differentiation. D. qRT-PCR analysis of EDA-A2 (XEDAR ligand) showing its more ubiquitous expression than XEDAR in various breast cancer cell lines. E. Box-Whisker plot of XEDAR expression in breast cancer tumors (n=10) and corresponding benign tissues (n=6). The level of XEDAR expression was significantly higher in benign tissues as compared to tumor samples (*P<0.05; Mann-Whitney U test).
The HCC712 cell line is partially adherent, ER+, PR+, HER2/neu− and possesses near diploid number of chromosomes (ploidy index = 1.2) (15). It forms duct-like structures that are similar to the in vivo ductal morphology during normal breast development, and forms domes representing hemispherical elevations of monolayer resulting from vectorial fluid transport (15). The above features have led to its classification as a differentiated breast cancer cell line (15). Our results showing high level expression of XEDAR in HCC712 led us to hypothesize that expression of XEDAR may correlate with the degree of differentiation in breast cancer. To provide further support for this hypothesis, we examined XEDAR mRNA expression in an additional panel of 6 breast cancer cell lines representing different stages of differentiation and consisting of MCF7, MCF-10F, MCF-10-2A, MDA-MB-231, MDA-MB-435 and SKBR3. As shown in Figure 1C, high level XEDAR mRNA expression was observed in the MCF-10F cell line, a non-tumorigenic cell line that was derived from floating cells in the initiating population. The MCF-10F cells display characteristics of luminal ductal cells by electron microscopy, exhibit three dimensional growth in collagen culture and form domes in confluent culture (24). In contrast, low level XEDAR mRNA expression was seen in the MCF-10-2A cell line (Figure 1C) that is derived from adherent cells in the starting population and infrequently forms domes in confluent cultures (24). Low level expression of XEDAR mRNA was also observed in the MCF7 cells (Figure 1C), which are also known to retain some characteristics of well-differentiated mammary epithelium, including the ability to process estradiol via cytoplasmic estrogen receptors and the capability of forming domes (25). However, no XEDAR expression was observed in the tumorigenic cell lines MDAMB-231, MDA-MB-435 and SKBR3 that lack ER and PR expression (Figure 1C)(25). Collectively, the above results suggest that although XEDAR is expressed in the well-differentiated or non-tumorigenic breast cancer cell lines, it is downregulated in most poorly-differentiated or tumorigenic breast cancer cell lines.
We next examined the expression of EDA-A2, the ligand for XEDAR, in breast cancer cell lines by qRT-PCR analysis. Similar to the situation with XEDAR, highest expression of EDA-A2 was observed in the HCC712 cell line (Figure 1D). In contrast to the situation with XEDAR, the expression of EDA-A2 was more prevalent and was seen in a number of cell lines, such as HCC1187, HCC1419 and HCC1428, which lacked XEDAR expression (Figure 1D).
Since cell lines may acquire de novo genetic and epigenetic lesions during cultivation (14, 26), it is mandatory to confirm the clinical relevance of such aberrations in primary tissue samples. Therefore, we next examined the expression of XEDAR in malignant (n=10) and non-malignant (n=6) breast tissue samples by qRT-PCR analysis. Consistent with the results with breast cell lines, the expression of XEDAR was significantly down-regulated in the malignant breast tissue samples as compared to the normal or benign breast tissue samples (p<0.05) (Figure 1E).
Mapping of 5' flanking region of XEDAR and its aberrant methylation in malignant breast cancer cell lines
Analysis of human XEDAR gene promoter on chromosome Xq12 using genomic DNA information contained in Ensembl contig ENSG00000131080 revealed a CpG island (CGI) between base position −64 to +253 (relative to the expected transcription site +1) according to the CGI definition of Takai and Jones (27). In addition, examination of the XEDAR promoter region using DBTSS database and MethPrimer software (19) and using stringent criteria for CpG island (as explained in Materials and Methods) also identified a single CpG enriched region of 317 bp between −64 and +253 bases across the transcription start site (Figure 2A). We next examined the methylation status of the XEDAR promoter in different human breast cancer cell lines using methylation-specific real-time PCR primers (MSP). Ten out of the twelve breast cell lines that lacked XEDAR (HCC38, HCC70, HCC202, HCC1008, HCC1419, HCC1569, HCC1954, MDA-MB-231 and SKBR3) expression or showed low level expression (MCF7) showed methylated XEDAR promoter, while the two cell lines that showed high level XEDAR expression (HCC712 and MCF-10F) lacked methylation of XEDAR promoter (Figure 2B). MCF-10-2A cell line, which showed low level XEDAR expression, also lacked methylation of XEDAR promoter (Figure 2B). HCC1187 was the only cell line in the panel that completely lacked XEDAR expression but possessed unmethylated XEDAR promoter (Figure 2B). Collectively, the above results demonstrate that methylation of XEDAR promoter correlates with its gene-silencing in a majority of breast cancer cell lines.
Methylation of XEDAR in breast tumors
We next examined the methylation status of XEDAR promoter in human breast cancer tumor and normal breast tissue samples using real-time methylation specific PCR. Figure 3 shows the quantitative methylation ratios (QR) for the cancerous and malignant breast tissues. We found increased methylation of XEDAR promoter in breast tumors (QR, 1.19 to 95.68) and much lower or undetectable levels (QR, 0 to 1.2) in the non-malignant breast tissues (Figure 3A and B). Based on the highest quantitative ratio in benign or nonmalignant tissues as the cutoff (QR = 1.2), 8 out of 10 (80%) of breast tumor samples were found to have hypermethylated XEDAR promoter (Figure 3). Since a collection of cancerous and normal breast tissues were studied for methylation, we determined sensitivity, specificity and positive and negative predictive values to assess the usefulness of hypermethylation of CpG island of XEDAR in distinguishing cancerous from benign tissue samples. This analysis was performed using receiver operating characterization (ROC) curve and demonstrated that XEDAR methylation has an excellent discriminatory capacity at separating breast cancer from normal tissues [Area Under the Curve (AUC = 0.870)] with specificity of 100 % and sensitivity of 80% (Figure 3C).
Figure 3. Methylation status of XEDAR promoter in normal breast and breast tumor samples.

A. Methylation level of XEDAR in normal breast and breast tumor samples was quantified by qMSP as described in Material and Methods. Quantitative ratio is defined as the ratio of fluorescence for PCR product of XEDAR to those of PCR products of MyoD1. Solid horizontal bar indicates the threshold above which samples are considered positive for methylation. A significant increase in the level of methylation was observed in the breast cancer as compared to normal breast tissue samples (*P<0.05; Mann-Whitney U test). B. Representative methylation-specific real-time PCR results from three sets of patient samples, two from breast tumors (patient number 1 and 2) and one from normal breast tissue. M, PCR product amplified using primers specific for methylated DNA; U, PCR products amplified using primers specific for unmethylated DNA. The DNA from MDAMB-231 was used as control to detect methylated gene. C. A receiver operating characteristic curve (ROC) for XEDAR was generated for separating breast cancer from normal breast tissue samples using MedCalc software. ROC curve is a plot of true positive rate vs. false positive rate for different possible cutoff points of a test. The area under curve (AUC) signifies the accuracy of test. AUC for XEDAR was observed to be 0.870 with 100% specificity and 80% sensitivity.
Induction of apoptosis by EDA-A2/XEDAR signaling
As EDA-A2 and XEDAR are known to induce apoptosis, it was conceivable that loss of XEDAR expression in breast cancer samples and cell lines reflected an escape from their tumor suppressive effect. To test this hypothesis, we examined the expression of XEDAR in normal human mammary epithelial cells (HMECs) and their response to EDA-A2. As shown in Figure 4A, we observed significant expression of XEDAR in HMECs, as determined by qRT-PCR analysis. More importantly, treatment with recombinant EDA-A2 resulted in a dose-dependent decline in the viability of HMECs, supporting the argument that EDA-A2/XEDAR signaling negatively regulates the survival of normal breast epithelial cells (Figure 4B).
Figure 4. EDA-A2 induces cell death in HMEC.
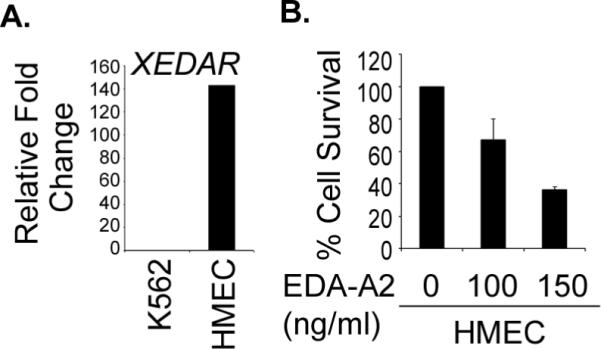
A. Expression of XEDAR in HMECs was determined by qRT-PCR and normalized to β-actin as a house-keeping control. PCR reactions were performed in triplicate and the data presented as fold change in target gene expression (Mean ± S.E.), as explained in the Material and Methods section and Figure 1A. B. HMECs were treated with recombinant EDA-A2 (100 ng/ml and 150 ng/ml) for 72 h and cell survival determined by MTS assay as described previously (37).
We next asked the question whether ectopic expression of XEDAR in the MDA-MB-231 breast cancer cells with silenced expression of endogenous XEDAR will result in induction of apoptosis. To answer this question, the MDA-MB-231 cells were transfected with an expression vector encoding XEDAR along with a Green Fluorescent Protein (GFP) encoding plasmid and the effect of ectopic XEDAR expression on cell survival examined by fluorescence microscopy. We included transfection with an empty vector as a negative control and transfection with a plasmid encoding Death Receptor 4 (DR4), a known inducer of apoptosis (28), as a positive control. As shown in Figures 5A–B, transfection with plasmids encoding XEDAR or DR4, but not the empty vector, resulted in nuclear condensation, cellular rounding, detachment and fragmentation into apoptotic bodies, all features suggestive of cell death.
Figure 5. XEDAR induces cell death.

A–B. MDA-MB-231 cells were transfected with indicated plasmids (1 μg) along with a green fluorescent protein-encoding plasmid (GFP, 200 ng) using Lipofectamine as described in Material and Methods. Cells were examined under a fluorescence microscope and photographed 48 h after transfection. XEDAR- and DR4-transfected cells had a rounded appearance and were detaching from the plate, whereas the cells transfected with the vector have a normal morphology. C–D. MDA-MB-231 cells were transfected with the indicated plasmids as described in Figure 5A. The cells were plated on fresh medium and selected with Zeocin (200 μg/ml). After 14 days of drug selection, the cells were fixed and stained with crystal violet and the numbers of colonies were counted.
Lastly, to further confirm the tumor-suppressive effect of XEDAR, we evaluated the effect of its stable expression on the growth of MDA-MB-231 cells using liquid colony formation assay. MDA-MB-231 cells were transfected with an empty vector or vectors encoding XEDAR or DR4, and subsequently selected in Zeocin for 14 days. We found significantly reduced number of colonies in MDA-MB-231 cells that had been transfected with XEDAR- or DR4-encoding plasmids as compared to the cells that had been transfected with an empty vector (Figure 5C–D).
Restoration of functional XEDAR expression after treatment with 5-Aza-dC
Studies in the preceding sections demonstrated that ectopic expression of XEDAR can induce apoptosis in the MDA-MB-231 cell line in which the expression of endogenous XEDAR had been silenced due to promoter methylation. Therefore, we asked whether XEDAR expression can be reinduced in cells in which its promoter is methylated by treatment with demethylating agents and the consequences of its re-expression on cell survival. To address this question, we examined XEDAR mRNA expression in seven representative human breast cell lines before and after treatment with two doses (2 and 5 μg/ml) of methyltransferase inhibitor 5-Aza-2-deoxycytidine (5-Aza-dC). Total RNA was isolated from these cell lines with and without 5-Aza-dC treatment and mRNA level of XEDAR was checked by qRT-PCR. As shown in Figure 6 A and B, the XEDAR expression was significantly enhanced in the three human breast cancer cell lines with methylated XEDAR promoter in the basal state (i.e. MDA-MB-231, SKBR3 and HCC1419) but did not change in the cell lines containing the non-methylated XEDAR promoter (i.e. MCF-10F and MCF-10-2A).
Figure 6. 5-Aza-dC reinduces XEDAR expression and sensitizes breast cancer cell lines to EDA-A2 induced cell death.

A. The indicated human breast cancer cell lines were treated with two different concentrations (2 and 5 μg/ml) of methyltransferase inhibitor 5-Aza-deoxycytidine (5-Aza-dC) for 4 days and restoration of XEDAR expression was analyzed by qRT-PCR and shown as fold increase over the untreated control cells. Re-expression of XEDAR was observed in the cell lines MDA-MB-231, SKBR3, and HCC1419 with methylated XEDAR promoter in the basal state. B. Representative qRT-PCR data of cell lines treated with 5μg/ml 5-Aza-dC showing re-expression of XEDAR. β-actin was using as internal loading control for equal amount of cDNA in PCR reaction. cDNA from HCC712 was used as positive control for XEDAR amplification. C–E. The indicated cell lines with methylated XEDAR promoter were treated for 4 days with 2 and 5μg/ml of 5-Aza-dC. The cells were then treated with recombinant EDA-A2 (100 ng/ml) for 72 h and cell survival determined by MTS assay as described previously (37). The untreated cells served as a negative control and PBS was used as an EDA-A2 vehicle control. Increasing dose of 5-Aza-dC treatment caused decreased cell survival upon treatment with EDA-A2.
We next asked if restoration of XEDAR expression by 5-Aza-dC will sensitize breast cancer cell lines to EDA-A2-induced cell death. To address this question, we treated the HCC1419, SKBR3, and MDA-MB-231 cell lines, which contain methylated XEDAR promoter, with 5-Aza-dC for four days and then treated them with recombinant EDA-A2 for 72 h. Cell viability was measured using an MTS assay. As shown in Figure 6C–E, EDA-A2 treatment had no effect on cell viability in the untreated or PBS-treated HCC1419, SKBR3, and MDA-MB-231 cells, reflecting the lack of XEDAR expression in these cells in their basal state. However, EDA-A2 treatment led to significant decline in the viability of cell in which XEDAR expression had been restored by pretreatment with 5-Aza-dC (Figure 6C–E). Thus, EDA-A2 reduced the viability of HCC1419, SKBR3 and MDA-MB-231 cells that had been treated with 2μg/ml 5-Aza-dC to approximately 60%, 40% and 80%, respectively, of the PBS-treated cells. The reduction in cell viability upon EDA-A2 treatment was even more pronounced in cells that had been pretreated with 5μg/ml of 5-Aza-dC (i.e. to 30%, 5% and 25%, respectively), reflecting higher level induction of XEDAR expression.
Discussion
Multiple genetic and epigenetic alterations are involved in the development of cancer. Loss of expression of certain genes in tumor cells is often linked to the potential of their gene products to act as tumor suppressors. Furthermore, aberrant methylation of CpG islands in gene promoters has been described as a primary mechanism for the inactivation of tumor suppressor genes in human malignancies (29). The identification of genes that are prone to abnormal methylation and consequently become down-regulated during cancer development is of clinical significance as these genes can serve as novel tumor biomarkers (30) and potential targets for therapeutic interventions (31, 32). In the present investigation, we present evidences that XEDAR is a novel tumor suppressor gene that is inactivated by DNA methylation in breast cancer cell lines and tumors.
Our real-time PCR analysis suggests that XEDAR is expressed in normal breast epithelial cells (e.g. HMEC) and pre-malignant and/or differentiated breast cancer cell lines (e.g. MCF-10F, HCC712) and its expression is often lost in tumorigenic and/or poorly-differentiated breast cell lines. The role of XEDAR as a tumor suppressor gene in breast cancer is supported further by our studies showing loss of its expression in breast cancer tissue samples. In contrast, we found no clear correlation between the expression of EDA-A2, the XEDAR ligand, and the degree of differentiation and/or malignant potential of different breast cell lines, suggesting that it is the XEDAR receptor itself that is differentially silenced in cancerous cell lines and reinforcing its possible role as a tumor suppressor during breast cancer development.
Inactivation of tumor suppressor genes is an important event for carcinogenesis of malignant tumors. In addition to classical genetic alterations (deletion or inactivating point mutations), these tumor suppressor genes can be functionally inactivated by aberrant methylation (33, 34). We identified approximately 300 bp CpG rich segment in the promoter of XEDAR. We specifically targeted this short CpG rich region and developed qMSP assay suitable for quantitative methylation analysis. Using this assay, we observed that XEDAR methylation is specific for breast cancer cells and there is a strong correlation between the methylation status of the breast cancer cell lines and their level of expression of XEDAR, suggesting that XEDAR methylation may be causally linked to the loss of XEDAR mRNA expression. This hypothesis was further supported by our results showing restoration of XEDAR expression in the MDA-MB-231, SKBR3 and HCC1419 cell lines following treatment with 5-Aza-dC. MCF-10-2A and HCC1187 were the only cell lines that lacked significant XEDAR expression in the absence of its promoter methylation. It is conceivable that methylation-independent mechanisms of gene inactivation, such as gene-rearrangement or splice-site mutation, may contribute to the loss of XEDAR expression in these two cell lines. Consistent with this notion, 5-Aza-dC treatment failed to restore XEDAR expression in the MCF-10-2A cell line.
The correlation between silencing of XEDAR expression and promoter methylation, however, was not limited to breast cancer cell lines and was also observed in breast tumor samples. Furthermore, the ROC curve analysis suggested that methylation status of XEDAR promoter has an excellent discriminatory capacity in separating breast cancer from benign lesions. While this manuscript was in preparation, a recent study reported loss of XEDAR expression due to promoter-methylation in colorectal carcinoma (35). Thus, the utility of loss of XEDAR expression as a cancer biomarker may not be limited to breast cancer and it may serve as a biomarker for other epithelial cancers as well.
What is the mechanism by which XEDAR acts as a tumor suppressor? A number of death domain-containing receptors of the TNFR family have been recently shown to negatively affect the development of cancer and this activity has been linked to their ability to promote cell death (9, 10). Although XEDAR lacks a discernible death domain, we had previously shown that it is capable of inducing apoptosis via caspase-8 and FADD-dependent mechanism (8). Recently, we also reported that activation of signaling via XEDAR leads to induction of apoptosis in cell lines derived from osteosarcoma (36). Consistent with the above results, we observed significant induction of apoptosis and reduction of colony formation by ectopic expression of XEDAR in the MDA-MB-231 cells in which the expression of endogenous XEDAR had been silenced by promoter-methylation. Moreover, EDA-A2 treatment induced cell death in normal mammary epithelial cells with endogenous XEDAR expression, and in MDA-MB-231, HCC-1419, and SKBR3 cell lines in which XEDAR expression had been re-induced by treatment with 5-Aza-dC. Collectively, the above results suggest that loss of XEDAR expression promotes breast cancer development via inhibition of apoptosis.
In summary, we have demonstrated that XEDAR expression is frequently lost in breast cancer cell lines and tumor samples. In a majority of cases, this loss is due to the aberrant methylation of XEDAR promoter, which can be reversed by treatment with DNA demethylating agents. These results may have considerable implications for the diagnosis and treatment of breast cancer.
Translational Relevance.
The expression of the death receptors of the TNFR family is frequently downregulated during cancer development. XEDAR is a recently characterized member of the TNFR family that binds to EDA-A2 and induces apoptosis in a caspase 8-dependent manner. In this article, we report that expression of XEDAR, but not EDA-A2, is downregulated in most tumorigenic breast cancer cell lines and tumor samples due to methylation of its promoter. XEDAR expression can be restored in cell lines with methylated XEDAR promoter by treatment with 5-Aza-dC, a demethylating agent, which sensitizes them to EDA-A2-induced cell death. Our results suggest that XEDAR may be a novel tumor suppressor gene for breast cancer and restoration of XEDAR expression may represent an attractive approach for the treatment of breast cancer.
Supplementary Material
Acknowledgement
This work was supported in part by the Department of Defense Breast Cancer Idea Award (DAMD17-02-1-0590) and R01-DE15189 to PMC. We like to thank Health Sciences Tissue bank, Magee Women's hospital Pittsburgh for providing breast tissue specimens.
Footnotes
Conflict-of-interest disclosure: The authors declare no competing financial interests.
References
- 1.Sheffield LG. Organization and growth of mammary epithelia in the mammary gland fat pad. J Dairy Sci. 1988;71:2855–74. doi: 10.3168/jds.S0022-0302(88)79881-1. [DOI] [PubMed] [Google Scholar]
- 2.Mikkola ML, Pispa J, Pekkanen M, et al. Ectodysplasin, a protein required for epithelial morphogenesis, is a novel TNF homologue and promotes cell-matrix adhesion. Mechanisms of Development. 1999;88:133–46. doi: 10.1016/s0925-4773(99)00180-x. [DOI] [PubMed] [Google Scholar]
- 3.Yan M, Wang LC, Hymowitz SG, et al. Two-amino acid molecular switch in an epithelial morphogen that regulates binding to two distinct receptors. Science. 2000;290:523–7. doi: 10.1126/science.290.5491.523. [DOI] [PubMed] [Google Scholar]
- 4.Chaudhary PM. Death Receptor Signaling in Embryonic Ectodermal Development. In: El-Deiry WS, editor. Death Receptors in Cancer Therapy. Humana Press; Otowa: 2005. pp. 83–92. [Google Scholar]
- 5.Pinheiro M, Freire-Maia N. Ectodermal dysplasias: a clinical classification and a causal review. Am J Med Genet. 1994;53:153–62. doi: 10.1002/ajmg.1320530207. [DOI] [PubMed] [Google Scholar]
- 6.Burck U, Held KR. Athelia in a female infant - heterozygous for anhidrotic ectodermal dysplasia. Clinical genetics. 1981;19:117–21. doi: 10.1111/j.1399-0004.1981.tb00680.x. [DOI] [PubMed] [Google Scholar]
- 7.Aggarwal BB. Tumour necrosis factors receptor associated signalling molecules and their role in activation of apoptosis, JNK and NF-kappaB. Ann Rheum Dis. 2000;59(Suppl 1):i6–16. doi: 10.1136/ard.59.suppl_1.i6. [DOI] [PMC free article] [PubMed] [Google Scholar]
- 8.Sinha SK, Chaudhary PM. Induction of apoptosis by X-linked ectodermal dysplasia receptor via a caspase 8-dependent mechanism. J Biol Chem. 2004;279:41873–81. doi: 10.1074/jbc.M407363200. [DOI] [PubMed] [Google Scholar]
- 9.Finnberg N, Klein-Szanto AJP, El-Deiry WS. TRAIL-R deficiency in mice promotes susceptibility to chronic inflammation and tumorigenesis. The Journal of Clinical Investigation. 2008;118:111–23. doi: 10.1172/JCI29900. [DOI] [PMC free article] [PubMed] [Google Scholar]
- 10.Johnstone RW, Frew AJ, Smyth MJ. The TRAIL apoptotic pathway in cancer onset, progression and therapy. Nat Rev Cancer. 2008;8:782–98. doi: 10.1038/nrc2465. [DOI] [PubMed] [Google Scholar]
- 11.Shivapurkar N, Toyooka S, Eby TM, et al. Differential inactivation of caspase 8 in lung cancer. Cancer biology and therapy. 2002;1:65–71. doi: 10.4161/cbt.1.1.45. [DOI] [PubMed] [Google Scholar]
- 12.Harada K, Toyooka S, Shivapurkar N, et al. Deregulation of caspase 8 and 10 expression in pediatric tumors and cell lines. Cancer Res. 2002;62:5897–901. [PubMed] [Google Scholar]
- 13.Shivapurkar N, Reddy J, Matta H, et al. Loss of expression of death-inducing signaling complex (DISC) components in lung cancer cell lines and the influence of MYC amplification. Oncogene. 2002;21:8510–4. doi: 10.1038/sj.onc.1205941. [DOI] [PubMed] [Google Scholar]
- 14.Wistuba II, Behrens C, Milchgrub S, et al. Comparison of features of human breast cancer cell lines and their corresponding tumors. Clin Cancer Res. 1998;4:2931–8. [PubMed] [Google Scholar]
- 15.Gazdar AF, Kurvari V, Virmani A, et al. Characterization of paired tumor and non-tumor cell lines established from patients with breast cancer. Int J Cancer. 1998;78:766–74. doi: 10.1002/(sici)1097-0215(19981209)78:6<766::aid-ijc15>3.0.co;2-l. [DOI] [PubMed] [Google Scholar]
- 16.Punj V, Matta H, Schamus S, Chaudhary PM. Integrated microarray and multiplex cytokine analyses of Kaposi's Sarcoma Associated Herpesvirus viral FLICE Inhibitory Protein K13 affected genes and cytokines in human blood vascular endothelial cells. BMC Med Genomics. 2009;2:50. doi: 10.1186/1755-8794-2-50. [DOI] [PMC free article] [PubMed] [Google Scholar]
- 17.Livak KJ, Schmittgen TD. Analysis of relative gene expression data using real-time quantitative PCR and the 2(-Delta Delta C(T)) Method. Methods. 2001;25:402–8. doi: 10.1006/meth.2001.1262. [DOI] [PubMed] [Google Scholar]
- 18.Wong NA, Britton MP, Choi GS, et al. Loss of CDX1 expression in colorectal carcinoma: promoter methylation, mutation, and loss of heterozygosity analyses of 37 cell lines. Proc Natl Acad Sci U S A. 2004;101:574–9. doi: 10.1073/pnas.0307190101. [DOI] [PMC free article] [PubMed] [Google Scholar]
- 19.Li LC, Dahiya R. MethPrimer: designing primers for methylation PCRs. Bioinformatics. 2002;18:1427–31. doi: 10.1093/bioinformatics/18.11.1427. [DOI] [PubMed] [Google Scholar]
- 20.Herman JG, Graff JR, Myohanen S, Nelkin BD, Baylin SB. Methylation-specific PCR: a novel PCR assay for methylation status of CpG islands. Proc Natl Acad Sci U S A. 1996;93:9821–6. doi: 10.1073/pnas.93.18.9821. [DOI] [PMC free article] [PubMed] [Google Scholar]
- 21.Bastian PJ, Ellinger J, Wellmann A, et al. Diagnostic and prognostic information in prostate cancer with the help of a small set of hypermethylated gene loci. Clin Cancer Res. 2005;11:4097–106. doi: 10.1158/1078-0432.CCR-04-1832. [DOI] [PubMed] [Google Scholar]
- 22.Yegnasubramanian S, Kowalski J, Gonzalgo ML, et al. Hypermethylation of CpG islands in primary and metastatic human prostate cancer. Cancer Res. 2004;64:1975–86. doi: 10.1158/0008-5472.can-03-3972. [DOI] [PubMed] [Google Scholar]
- 23.Urakami S, Shiina H, Enokida H, et al. Combination analysis of hypermethylated Wnt-antagonist family genes as a novel epigenetic biomarker panel for bladder cancer detection. Clin Cancer Res. 2006;12:2109–16. doi: 10.1158/1078-0432.CCR-05-2468. [DOI] [PubMed] [Google Scholar]
- 24.Soule HD, Maloney TM, Wolman SR, et al. Isolation and characterization of a spontaneously immortalized human breast epithelial cell line, MCF-10. Cancer Res. 1990;50:6075–86. [PubMed] [Google Scholar]
- 25.Neve RM, Chin K, Fridlyand J, et al. A collection of breast cancer cell lines for the study of functionally distinct cancer subtypes. Cancer Cell. 2006;10:515–27. doi: 10.1016/j.ccr.2006.10.008. [DOI] [PMC free article] [PubMed] [Google Scholar]
- 26.Osborne CK, Hobbs K, Trent JM. Biological differences among MCF-7 human breast cancer cell lines from different laboratories. Breast Cancer Res Treat. 1987;9:111–21. doi: 10.1007/BF01807363. [DOI] [PubMed] [Google Scholar]
- 27.Takai D, Jones PA. Comprehensive analysis of CpG islands in human chromosomes 21 and 22. Proc Natl Acad Sci U S A. 2002;99:3740–5. doi: 10.1073/pnas.052410099. [DOI] [PMC free article] [PubMed] [Google Scholar]
- 28.Chaudhary PM, Eby M, Jasmin A, Bookwalter A, Murray J, Hood L. Death receptor 5, a new member of the TNFR family, and DR4 induce FADD- dependent apoptosis and activate the NF-kappaB pathway. Immunity. 1997;7:821–30. doi: 10.1016/s1074-7613(00)80400-8. [DOI] [PubMed] [Google Scholar]
- 29.Agrawal A, Murphy RF, Agrawal DK. DNA methylation in breast and colorectal cancers. Mod Pathol. 2007;20:711–21. doi: 10.1038/modpathol.3800822. [DOI] [PubMed] [Google Scholar]
- 30.Laird PW. The power and the promise of DNA methylation markers. Nat Rev Cancer. 2003;3:253–66. doi: 10.1038/nrc1045. [DOI] [PubMed] [Google Scholar]
- 31.Issa JP, Garcia-Manero G, Giles FJ, et al. Phase 1 study of low-dose prolonged exposure schedules of the hypomethylating agent 5-aza-2'-deoxycytidine (decitabine) in hematopoietic malignancies. Blood. 2004;103:1635–40. doi: 10.1182/blood-2003-03-0687. [DOI] [PubMed] [Google Scholar]
- 32.Egger G, Liang G, Aparicio A, Jones PA. Epigenetics in human disease and prospects for epigenetic therapy. Nature. 2004;429:457–63. doi: 10.1038/nature02625. [DOI] [PubMed] [Google Scholar]
- 33.Esteller M. Epigenetic lesions causing genetic lesions in human cancer: promoter hypermethylation of DNA repair genes. Eur J Cancer. 2000;36:2294–300. doi: 10.1016/s0959-8049(00)00303-8. [DOI] [PubMed] [Google Scholar]
- 34.Yang X, Yan L, Davidson NE. DNA methylation in breast cancer. Endocr Relat Cancer. 2001;8:115–27. doi: 10.1677/erc.0.0080115. [DOI] [PubMed] [Google Scholar]
- 35.Tanikawa C, Furukawa Y, Yoshida N, Arakawa H, Nakamura Y, Matsuda K. XEDAR as a putative colorectal tumor suppressor that mediates p53-regulated anoikis pathway. Oncogene. 2009 doi: 10.1038/onc.2009.154. [DOI] [PubMed] [Google Scholar]
- 36.Chang B, Punj V, Shindo M, Chaudhary PM. Adenoviral-mediated gene transfer of ectodysplasin-A2 results in induction of apoptosis and cell-cycle arrest in osteosarcoma cell lines. Cancer gene therapy. 2007;14:927–33. doi: 10.1038/sj.cgt.7701078. [DOI] [PubMed] [Google Scholar]
- 37.Matta H, Chaudhary PM. The proteasome inhibitor Bortezomib (PS-341) inhibits growth and induces apoptosis in primary effusion lymphoma cells. Cancer Biol Ther. 2005;4:77–82. doi: 10.4161/cbt.4.1.1379. [DOI] [PubMed] [Google Scholar]
Associated Data
This section collects any data citations, data availability statements, or supplementary materials included in this article.