

Abstract
In Saccharomyces cerevisiae the repeated units of the ribosomal locus, transcribed by RNA polymerase I (Pol I), are interrupted by nontranscribed spacers (NTSs). These NTS regions are transcribed by RNA polymerase III to synthesize 5S RNA and by RNA polymerase II (Pol II) to synthesize, at low levels, noncoding RNAs (ncRNAs). While transcription of both RNA polymerase I and III is highly characterized, at the ribosomal DNA (rDNA) locus only a few studies have been performed on Pol II, whose repression correlates with the SIR2-dependent silencing. The involvement of both chromatin organization and Pol I transcription has been proposed, and peculiar chromatin structures might justify “ribosomal” Pol II silencing. Reporter genes inserted within the rDNA units have been employed for these studies. We studied, in the natural context, yeast mutants differing in Pol I transcription in order to find whether correlations exist between Pol I transcription and Pol II ncRNA production. Here, we demonstrate that silencing at the rDNA locus represses ncRNAs with a strength inversely proportional to Pol I transcription. Moreover, localized regions of histone hyperacetylation appear in cryptic promoter elements when Pol II is active and in the coding region when Pol I is functional; in addition, DNA topoisomerase I site-specific activity follows RNA polymerase I transcription. The repression of ncRNAs at the rDNA locus, in response to RNA polymerase I transcription, could represent a physiological circuit control whose mechanism involves modification of histone acetylation.
In Saccharomyces cerevisiae the ribosomal DNA (rDNA) locus coding for rRNAs is represented by a single gene cluster of 150 to 200 units repeated in tandem on chromosome XII (23). Each unit contains the 35S RNA gene transcribed by RNA polymerase I (Pol I) and is separated from the next repeat by a nontranscribed spacer (NTS) (Fig. 1). Despite its name, the latter sequence is highly transcribed by RNA polymerase III, at the 5S gene, and at very low levels by RNA polymerase II (Pol II) at different promoters, generating noncoding RNAs (ncRNAs) (10, 15, 19, 33).
Fig. 1.

Map of rDNA, probes, and oligonucleotides used in this study. Schematic map of ribosomal genes in Saccharomyces cerevisiae. Horizontal black arrows represent RNA transcripts. Filled boxes indicate 35S and 5S coding units. Gray boxes represent ncRNA promoters. Ellipses refer to positioned nucleosomes. The boxed areas in the lower part of the figure contain probes used in Southern and Northern blotting experiments (thin horizontal black lines). White arrows indicate oligonucleotides used in RT-PCR and primer extension experiments. The thick black lines represent the positions of amplicons produced in Chr-IP analyses.
Recent observations (10, 15, 19, 33) concerning mutant strains overproducing ncRNAs from the NTS region have shown that the presence of these RNA species correlates with the SIR2-dependent transcriptional silencing occurring at the ribosomal locus (19); interestingly, DNA topoisomerase I mutants (top1Δ) show increases of these ncRNA species. Also the mitotic recombination in the rDNA (suppressed in wild-type [WT] strains) is increased when ncRNAs are overproduced (15); this phenomenon has been proposed to be due in part to the Pol II activity that locally may displace cohesins and induce recombination. More recently, alteration of ribosomal gene copy number has also been observed in mutant strains with increased production of ncRNAs (10, 15, 33).
Thus, at the rDNA, a connection among transcriptional silencing, recombination between repeated units, and ncRNA production appears to exist.
Moreover, it has been discovered (6, 39) that the yeast S. cerevisiae has an inherent ability to produce rRNA by Pol II, but this transcription activity is silenced in normal cells. In mutants lacking the Pol I transcription factor upstream activation factor (UAF), rDNA transcription is due to Pol II activity (the polymerase-switched state [PSW]). The presence of UAF in WT cells appears to stabilize this state, thus showing a powerful silencing of rDNA transcription by Pol I.
Hypotheses about the basis of transcriptional silencing at the rDNA locus take into consideration both chromatin organization (2, 21, 27, 28) and Pol I transcription (3, 5). Different observations have identified the elements required for silencing at the rDNA locus: histones and those enzymes capable of histone modifications and/or chromatin remodeling (2, 21, 27, 28). Putative chromatin structures have been reported for silenced Pol II transcription in the rDNA region, particularly at the NTS level (8, 22), when reporter genes are artificially inserted in the rDNA locus (2, 27). It has also been suggested (3, 5) that Pol I activity on this region is involved in setting of transcriptional silencing, creating peculiar structures inhibiting Pol II activity (5).
In order to verify whether Pol I and Pol II transcription correlates with ncRNA production and chromatin modifications, we studied several yeast strains differing in Pol I transcription of 35S RNA, in particular the W303 strain (WT) (30), in which about 50% of the units are transcribed; the NOY1071 strain (5), with all transcribed units (ATU), where the strong contraction of the repeats (from 200 to 25) is stably maintained by the lack of the FOB1 gene; and the NOY699 strain (39), carrying a UAF subunit deletion (RRN5), with a strongly reduced 35S RNA transcription by RNA polymerase I and where rRNA synthesis is mainly carried out by RNA polymerase II (PSW). In addition, we used two strains characterized by a complete loss of RNA polymerase I transcription: NOY558, in which the core factor (CF) complex is impaired due to the absence of the RRN7 component (17), and the D128-1d (A43) strain, lacking the A43 subunit of RNA polymerase I (31). A summary of the strain features is given in Table 1.
Table 1.
Features of strains used in this studya
| Name | Copy no. (rDNA) | Pol I transcription production | ncRNA | Acetylation |
|
|---|---|---|---|---|---|
| Coding | Cryptic promoters | ||||
| ATU (NOY1071) | 25 | ++++ | − | +++ | − |
| WT (W303-1a) | 150 | +++ | +/− | + | +/− |
| CF (NOY558) | 100 | − | + | ND | ND |
| PSW (NOY699-PSW) | 300 | +/− | +++ | − | +++ |
| A43 (D128-1d) | 150 | − | + | ND | ND |
The reference strain (W303-1a, WT [30]) has about 50% of the units transcribed; in the ATU (NOY1071 [5]) strain all units are transcribed, and the strong contraction of the repeats (from 200 to 25) is stably maintained by the lack of the FOB1 gene; the CF strain (NOY558 [17]) lacks the rrn7 subunit of the CF complex, and thus, Pol I transcription is abolished; the PSW (NOY699 [39]) strain carries a UAF subunit deletion that abolishes 35S RNA transcription; in addition, a polymerase switch (PSW) occurred and transcription of 35S RNA by RNA polymerase I is switched to RNA polymerase II. In the A43 strain (D128-1d [31]) a deletion of the gene of the A43 subunit of Pol I abolishes its transcriptional activity. − to ++++, lowest to highest levels, respectively; ND, not determined.
We have measured ncRNA synthesis in the different strains and evaluated chromatin structure and histone acetylation in the NTS region. The efficiency of site-specific cleavage activity of DNA topoisomerase I has also been studied.
MATERIALS AND METHODS
Strains.
Strains used were as follows: W303-1a (WT) (mata ade2-1 ura3-1 his3-11,15 trp1-1 leu2-3,112 can1-100); NOY699-PSW (PSW) (mata ade2-1 ura3-1 his3-11 trp1-1 leu2-3,112 can1-100 rrn5::LEU2), PSW (from M. Nomura); NOY1071 (ATU) (mata ade2-1 ura3-1 his3-11,15 trp1-1 leu2-3,112 can1-100 fob1::HIS3), carrying 25 ribosomal units (from M. Nomura); NOY558 (CF) (mata ade2-1 ura3-1 his3-11 trp1-1 leu2-3,112 can1-100 rrn7::LEU2) (from M. Nomura); UKY403 (mata ade2-101 his-Δ200 leu2-3,112 lys2-801 ura3-52 trp1-Δ419 Δhhf1::his3 Δhhf2::leu2/pMH3110 [TRP1 CEN3 ARS1 UAS gal-HHF2]) (from M. Grunstein); D128-1d (A43) (mata rpa43::LEU2 ade2-101 uaa ura3-52 lys2-801 uag trp1-D63 his3-D200 leu2-D1/), pNOY102 (from P. Thuriaux).
Probes.
The probes utilized in this work (Fig. 1 shows localization) were as follows: for Northern blot assays, single-stranded probe S1 (annealing to positions −615 to −243), single-stranded probe S2 (annealing to positions −2147 to −1899), single-stranded probe S3 (annealing to positions −1709 to −1464), and double-stranded probe ACT1 (obtained by PCR with the oligonucleotides 5′-ACGTTCCAGCCTTCTACGTTTCCA-3′ and 5′-AGTCAGTCAAATCTCTACCGGCCA-3′); for Southern blot assays, probe P (annealing from −509 to −615 and obtained by PCR with the oligonucleotides 5′-TAACATCCCAATGCGGACTATA-3′ and 5′-TAGGTAGTCAGATGAAAG-3′) and probe C (annealing from +5911 to +6295 and obtained by PCR from oligonucleotides employed for COD amplicon production [see below for sequences and annealing positions]).
Primers.
Oligonucleotides utilized as primers in chromatin immunoprecipitation (Chr-IP) reactions were as follows: amplicon COD, 5′-GGGCTCATGGAGAACAGAAATCTC-3′ (+5991 to +5934) and 5′-CCGAATGAACTGTTCCTCTCGTAC-3′ (+6295 to +6272); amplicon ENH, 5′-GGGGCCTAGTTTAGAGAGAAGTAG-3′ (−2454 to −2431) and 5′-CTCTGATGGTGCGGAAAAAACTGC-3′ (−2136 to −2160); amplicon E-PRO, 5′-TGTTAGTGCAGGGAAAGCGGGAAGGA-3′ (−1709 to −1684) and 5′-GCACTATCCAGCTGCACTCTTCTTC-3′ (−1464 to −1489); amplicon NUC, 5′-ATGTTCAGTAGGTGGGAGTGAGAG-3′ (−1197 to −1174) and 5′-CATCCGGTGCCGTAAATGCAAAAC-3′ (−860 to −884); amplicon C-PRO, 5′-AATAGTGAGGAACTGGGTTACCCG-3′ (−229 to −207) and 5′-TTGTACTCCATGACTAAACCCCCC-3′ (−31 to −54); amplicon ACT1, 5′-ACGTTCCAGCCTTCTACGTTTCCA-3′ and 5′-AGTCAGTCAAATCTCTACCGGCCA-3′.
The following specific primers were used in reverse transcriptase PCRs (RT-PCRs): 5′-TAGGTAGTCAGATGAAAG-3′ (S1), 5′-GCACCATCAGAGCGGCAAAC-3′ (S2), 5′-GCACTATCCAGCTGCACTCTTCTTC-3′ (S3), and 5′-AGTCAGTCAAATCTCTACCGGCCA-3′ (ACT1). The resulting cDNAs were amplified by PCR.
Culture media and conditions.
The culture medium utilized for cell growth was complete YPGal (26), supplemented with 2% galactose, except for the experiments described in Fig. 6, for which a galactose-to-glucose shift was required. In this case we employed complete yeast extract-peptone-dextrose (YPD) supplemented with 2% glucose.
Fig. 6.

Chromatin dissolution affects ncRNA production at the rDNA locus. (A) Schematic map of the analyzed region. (B) UKY cells were treated for chromatin spacing analysis with increasing amounts of MNase (triangles) at the specified times of glucose repression of the H4 gene. U, untreated DNA. The digested DNAs were separated on a 1.2% agarose gel and subjected to Southern blotting. The resulting filter was hybridized to P probe. (C) Primer extension analysis at the specified times of glucose repression of the H4 gene. M, molecular weight marker. The oligonucleotide PSW was utilized as a primer. (D) RT-PCR results of cDNA obtained from RNA extracted at the specified times of glucose repression of the H4 gene. S1 to S3 oligonucleotides were used as primers. Different columns in the histogram refer to the specified times of glucose repression of the H4 gene. The band intensities were measured by phosphorimaging and normalized to the ACT1 value.
Restriction enzymes, micrococcal nuclease (MNase), and RT were purchased from Roche; Taq polymerase was from Eppendorf; zymolyase was from Seikagaku (Tokyo, Japan); nystatin was from Sigma; radiochemicals were from Amersham; and Vent (Exo−) polymerase was from New England Biolabs.
RNA analysis.
Total RNA from yeast cells grown to exponential phase in YPGal medium was prepared as previously described (36). After spectrophotometric determination of the amount of RNA present, 20 μg from each sample was run in a 1.2% agarose morpholinepropanesulfonic acid (MOPS) gel (containing formaldehyde as a denaturing agent). The gel was stained with ethidium bromide and photographed to visualize rRNA as a control for equal loading and integrity. Northern analysis was performed by standard procedures, with Hybond N+ nylon paper (Amersham). For hybridization probes utilized, see specific paragraphs above.
The band intensities were measured with a phosphorimager and normalized to the ACT1 value (loading control). In the graph the ncRNA values are given relative to the rDNA copy number. Error bars refer to at least three different experiments.
Chromatin immunoprecipitation.
Three hundred milliliters of culture was grown to exponential phase (optical density [OD] of 0.5/ml), fixed with 1% formaldehyde for 15 min, and then incubated with 330 mM glycine for 10 min, to block the formaldehyde reaction. Chromatin extract was recovered and subjected to sonication in order to obtain an average size of 500 to 800 bp in all the experiments.
Equal amounts of chromatin extracts (350 μg of protein) were immunoprecipitated with 2.5 μg of antibodies against histone H3 and H2A C-terminal tail or anti-acetyl H3 (anti-AcH3) or H4 (Upstate Biotechnology), depending on the experiments, at the final concentration of 140 mM NaCl. Chromatin-antibody complexes were isolated with protein A Sepharose beads (Amersham) and then washed with increasing amounts of NaCl (up to 500 mM), deoxycholate buffer, and 10 mM Tris HCl (pH 8.0)-1 mM EDTA. Immunoprecipitated chromatin was then recovered and treated with 0.5 mg/ml proteinase K and 0.25 mg/ml RNase A.
Genomic, immunoprecipitated, and no antibody DNAs (not shown) were analyzed by multiple PCR using specific primers.
Different DNA amounts were used as template for PCR, in order to obtain comparable autoradiographic signals, in particular for input samples 1 μl for a 1:20 dilution and 1 μl of IP and no antibody. Template titration for each sample was performed in order to evaluate the linear range of the amplifications. PCRs were performed under the following conditions: denaturation at 95°C for 30 s, annealing at 55°C for 30 s, and elongation at 68°C for 1 min, with 25 cycles for actin, 21 cycles for ATU rDNA, and 18 cycles for WT and PSW rDNA. [α-32P]dATP was added to the reaction mixture (0.04 μCi/μl). The amplified fragments were separated on a 6% acrylamide gel. Quantification was performed using a phosphorimager. The band intensities were normalized to the ACT1 value, and the IP/input ratio was determined. The average (with standard deviations) of at least three independent experiments is reported.
Chromatin analysis.
For micrococcal nuclease treatment, cells (100 to 200 ml grown to an OD of 0.5/ml) were pelleted and resuspended in 10 ml of a buffer containing 1 M sorbitol, 50 mM Tris-HCl (pH 7.5), and 10 mM β-mercaptoethanol, in the presence of 0.03 mg/3 × 107 cells of Zymolyase 100T, and incubated for 10 min at 30°C. The resulting spheroplasts were harvested, resuspended in nystatin buffer to an OD of about 25/ml (50 mM NaCl, 1.5 mM CaCl2, 20 mM Tris-HCl, pH 7.5, 0.9 M sorbitol, 100 μg/ml nystatin) (34), and divided into 0.4-ml aliquots. MNase (0.4, 0.8, or 1.6 units) was added to each aliquot, and the samples were incubated at 37°C for 15 min. The reaction was stopped with 1% sodium dodecyl sulfate (SDS) and 5 mM EDTA (final concentrations). Proteinase K (40 μg/sample) was added, and the samples were kept at 56°C for 2 h. The DNA was then purified by three phenol-chloroform-isoamylic alcohol (24:24:1, vol/vol/vol) extractions and ethanol precipitation. RNase A treatment was also performed. Nucleosome spacing analysis was performed as follows. After MNase treatments and DNA purification, the samples were run in a 1.2% agarose gel electrophoresis (1.75 V/cm) gel, transferred onto a BA-S 85 nitrocellulose membrane (Schleicher & Schuell), hybridized to specific probes (see elsewhere in text) according to standard procedures, and analyzed by autoradiography.
RT-PCR.
RNA from yeast cells was isolated as described above, treated with RNase-free DNase I (Boehringer-Mannheim) for 30 min at 37°C, and then purified. Three micrograms was subjected to cDNA synthesis with SuperScript III RT (Invitrogen) from specific primers.
Primer extension.
Twenty micrograms of RNA extracted from cells grown in galactose (0 min) (transcribing H4 gene) or in glucose (240 min and 360 min) (nontranscribing H4 gene) was subjected to treatment with 1.5 units of DNase for 15 min at 37°C. The reaction was stopped by 1 mM EDTA, and the reaction mixture was incubated with 5′-labeled oligonucleotide PSW (39) and RT (30 U) for 30 min at 55°C. The retrotranscription was stopped by heat inactivation of RT at 85°C for 5 min. The reaction products were treated with 35 U of RNase A, phenol extracted, and ethanol precipitated. The purified samples were then loaded on a sequencing gel (6%). After electrophoresis, exposure of the gel to an X-ray film with an intensifying screen was performed.
Induction of CPT-dependent DNA topoisomerase I cleavage sites.
Spheroplasts were obtained as described above and resuspended in cleavage buffer (3 mM CaCl2, 1 mM MgCl2, 10 mM Tris-HCl, pH 8.0, 1 M sorbitol, 100 μg/ml nystatin), and aliquots were incubated with 0, 50, or 100 μM camptothecin (CPT) for 2 min at room temperature. The reaction was stopped with 1% SDS, 5 mM EDTA (final concentrations). Proteinase K (40 μg/sample) was added, and the samples were kept at 56°C for 2 h. The DNA was then purified by three phenol-chloroform extractions and ethanol precipitation, followed by RNase A treatment. Multiple-round primer extension and high-resolution analysis of DNA topoisomerase I cleavage sites were then performed. The specific amount of genomic DNA (adjusted to the strain with lower copy number) was elongated with Vent polymerase and end-labeled oligonucleotide as described previously (1). The samples were amplified 25 times through the following steps: 95°C for 5 min, 58°C for 10 min, and 76°C for 3 min (conditions for oligonucleotide R3, 5′-CGCGTTTCCGTATTTTCCGC-3′). The extension products were phenol extracted, ethanol precipitated, dissolved in formamide buffer, and analyzed by 6% denaturing polyacrylamide gel electrophoresis. The intensity of the cleavage site for 50 μM CPT-treated strains was measured by phosphorimaging and normalized to the unreacted DNA; the ratios were reported as histogram bars. Data refer to means of at least three different experiments, and standard deviations are reported.
RESULTS
ncRNA production at rDNA locus increases in Pol I transcription-defective mutants.
In S. cerevisiae ncRNAs transcription by Pol II is maintained at a low level because its increase seems to be associated with rDNA instability (10, 15, 33). This seems to be the physiological reason for transcriptional silencing at this genetic locus. rDNA transcriptional silencing has been previously described as a repression of expression of the Pol II reporter gene inserted into the ribosomal gene array (2, 27). This process has been ascribed to the involvement of chromatin factors, in particular the histone deacetylase Sir2p and DNA topoisomerase I (2, 27). Moreover, Pol I activity has been shown to provide Pol II transcriptional repression of reporter genes in strains lacking active Pol I transcription machinery (3, 5).
We asked whether the Pol I activity negatively interferes with Pol II transcription, in the natural context without any insertion, by measuring ncRNA production.
To accomplish this task, we have evaluated the amount of ncRNAs from the NTS region by studying strains that are different both for transcriptionally active units (such as WT and ATU strains) and for the Pol I machinery (such as CF, A43, and PSW strains).
The distinctive features of the strains used are listed in Table 1.
The RNA extracted from different mutants, grown to exponential phase, was purified and analyzed by Northern blotting. Figure 2A shows the ncRNA map positions at the NTS region; five major ncRNA species (10, 19, 33) are indicated by horizontal thin black arrows. E-PRO (15) indicates the bidirectional promoter region of NTS1 ncRNAs (revealed by S2 and S3 probes); C-PRO (19) refers to the cryptic promoter lying in the NTS2 region (ncRNAs generated from this promoter are revealed by the S1 probe). Figure 2B shows four different hybridization profiles, from the same filter, by three different single-stranded probes, S1 to S3 (whose annealing regions are reported in Fig. 2A), revealing the expression of each ncRNA species; each probe employed is specified at the right of panel B. The ACT1 expression profile is also reported, as a quantitative control (probe ACT1). The last profile, reported at the bottom of panel B, shows the 18S and 25S RNAs (before transfer to nylon filter) by ethidium bromide staining of the gel, representing loading control and showing RNA integrity.
Fig. 2.

Pol II-produced ncRNAs are overexpressed in different mutants for Pol I transcription. (A) Schematic map showing ncRNA positions (horizontal thin black arrows), rRNA (horizontal thick black arrows), ncRNA promoters E-PRO and C-PRO (gray boxes), and positioned nucleosomes (ellipses). (B) Northern analysis showing ncRNAs from the strains specified at the top of the gel. Total RNA (20 μg) from each mutant resolved in a 1.2% agarose gel is visualized with the different probes indicated at the right side of the panel. 18S and 25S RNAs in the lower part of the figure show loading control and RNA integrity. (C) ncRNA quantification in the specific strains. S1, S2, and S3 represent different single-stranded probes showing the three main ncRNAs. The band intensities were measured by phosphorimaging and normalized to the ACT1 value. In the graph the ncRNA values are given relative to the rDNA copy number.
A quite different expression of ncRNAs, produced from the cryptic Pol II promoter (C-PRO) in the various mutants, is shown by the S1 probe, which anneals upstream of the 35S RNA initiation site (19). In the ATU strain, where all the rDNA units are transcribed by Pol I with very high efficiency, the cryptic promoter is completely silent. Instead, the PSW strain (with low Pol I activity) overproduces these ncRNAs at very high levels. In addition, in the two mutant strains that lack Pol I transcription, A43 and CF, an increase of ncRNA levels relative to WT is also evident. All three ncRNA species detected by the S1 probe seem to vary proportionally in all the investigated strains.
Similar results were obtained when probes S2 and S3 were used, even though the strength of silencing mediated by Pol I at the E-PRO region seems to be less than that observed at C-PRO. This observation suggests a smaller influence of Pol I machinery on this promoter. The expression of these ncRNAs produced from E-PRO is lower than that shown by the S1 probe from C-PRO, confirming previous results obtained for the WT strain (10, 19, 33).
Altogether these results suggest that ncRNAs, synthesized in the NTS region of ribosomal genes, are overproduced by Pol II in those strains where Pol I does not transcribe 35S RNA; this is especially true for the PSW strain, where the overexpression is maximal for all ncRNAs.
The strains analyzed in Fig. 2B differ both for Pol I transcription and for rDNA copy number. In order to take into account also the amount of ribosomal genes (potentially affecting the ncRNA expression), we measured the rDNA copy number of each strain (not shown). The data obtained are fully in agreement with those previously reported for each strain (5, 22). We then normalized ncRNA production to rDNA copy number, in order to evaluate the contribution of the rDNA amount to the observed differences in ncRNA expression (Fig. 2C); the quantitative analysis (see Materials and Methods) indicates that the different ncRNA production levels observed in the mutant strains do not depend on the rDNA copy number.
H3 and H4 acetylation at the rDNA locus correlates with different transcriptional conditions.
It is conceivable that rDNA silencing is physiologically needed in order to repress ncRNA production. It has been reported that, when Pol I highly transcribes rRNA genes, strong Pol II silencing occurs at the rDNA locus, while in the PSW strain, lacking 35S RNA transcription by Pol I, this kind of silencing is lost (5). In general, histone acetylation correlates with the establishment of an open chromatin conformation that is transcriptionally active (16). The importance of chromatin deacetylation by Sir2p in rDNA silencing has also been reported (2, 12, 18, 27, 29). In addition, in some mutant strains (sir2 or top1 mutant), where rDNA transcriptional silencing is lost, an increase in the acetylation level of histones H3 and H4 occurs (4, 24). We asked whether Pol I-dependent silencing of ncRNAs is associated with different acetylation states within the NTS region. Thus, we evaluated whether among the strains showing the highest differences in ncRNA transcription, (i.e., ATU and PSW) different chromatin acetylation patterns are present. In particular, as far as the 35S nontranscribing strains are concerned, we focused our attention on the PSW strain. In fact, the production of Pol I transcripts is strongly reduced and, as shown in Fig. 2B and C, the ncRNAs reach maximal expression. This phenotype is associated with an increase of recombination (10, 15, 33), and this step is fundamental to raise the rDNA copy number for the PSW phenotype (22). Thus, PSW strain analysis could also clarify the relationship among several processes, such as Pol I/Pol II transcription, ncRNA production, and copy number control.
In order to clarify this point, we carried out Chr-IP analysis (25) with anti-acetyl H3 and anti-acetyl H4 antibodies on the ATU, PSW, and WT strains, and the results are shown in Fig. 3. After IP, the recovered DNA was analyzed by PCR, using specific primers for five different sequences in the rDNA (Fig. 1 shows localization); in addition, primers for the ACT1 coding sequence were included in each reaction as internal controls. The intensities of the resulting fragments were analyzed by phosphorimaging, and rDNA-specific bands (COD, ENH, E-PRO, NUC, and C-PRO) were normalized to the ACT1 value. Thus, the graphs in Fig. 3 report the IP/input ratio in the different regions, in the specified strains normalized to the ACT1 values. This procedure allowed us to overcome differences either in amplified material or due to rDNA copy number variation among the strains. As shown in Fig. 3, in the COD region (a portion of the coding sequence of 35S RNA lying at about 6,200 bp from the transcriptional start [also Fig. 1]), H3 and H4 histone acetylation is proportional to the 35S transcription rate. In fact, the lower the Pol I efficiency (PSW), the lower the acetylation level, and consistently the ATU strain (with the highest Pol I transcription) shows maximal acetylation relative to the other strains (compare AcH3 and AcH4 graphs in Fig. 3, COD points). In the NUC region, the part of the NTS with highly positioned nucleosomes (38) (Fig. 1 shows localization), no significant alteration of H3 and H4 acetylation levels is observed among the analyzed strains (compare AcH3 and AcH4 graphs in Fig. 3, NUC points); similarly, few differences are observed in the ENH region where Pol I termination occurs. In the E-PRO and C-PRO regions (encompassing the cryptic ncRNA promoters) histone H3 and H4 acetylation is lower in the strains with high Pol I transcription (ATU), while it reaches the highest level when Pol I activity is reduced (PSW). Notably this acetylation pattern is the opposite of the one observed in the coding region. We have further normalized the AcH3 fraction to the total amount of H3 histone, obtaining similar results (not shown).
Fig. 3.

RNA polymerase I and II transcription is related to H3 and H4 histone acetylation. Chr-IP analysis for the specified strains (♦, WT; ▴, PSW; □, ATU) with anti-AcH3 (top graph) or anti-AcH4 (bottom graph) antibodies. Values refer to AcH3 or AcH4 enrichment calculated as IP/input ratio normalized to ACT1 in the different regions and different strains.
Taken together, these data show that when Pol I highly transcribes 35S RNA, hypoacetylation is observed at ncRNA promoters while hyperacetylation occurs at the 35S RNA coding sequence. Conversely, in the absence of Pol I transcription, acetylation of E-PRO and C-PRO regions increases while the coding region becomes hypoacetylated.
We hypothesize that the extent of acetylation observed in the studied regions derives from two different events: (i) Pol I activity at the COD region requires chromatin remodeling and (ii) Pol II transcription at the E- and C-PRO regions responds to histone modifications (see below).
Chromatin remodeling at rDNA is due only to Pol I transcription.
Pol I and Pol II transcribe the rDNA at very different levels as recently measured (9). If the differences in the acetylation profiles observed in Fig. 3 are related to the different transcriptional activities (Pol I and II on rDNA), we may expect significant chromatin rearrangement due to the high efficiency of Pol I and small variations due to limited transcription by Pol II. In order to verify the extent of chromatin rearrangements at the NTS and coding regions, we performed nucleosome spacing analysis (38) and compared the digestion profiles of WT, PSW, and ATU strains. This approach allowed us to show the DNA regions protected by micrococcal nuclease digestion, therefore revealing the presence in vivo of nucleosome particles on specific DNA regions.
The strains were grown to exponential phase, processed for spheroplast formation, and permeabilized with nystatin as previously reported (34); the permeabilized spheroplasts were subjected to MNase digestion (38). In the subsequent Southern analysis we utilized two different probes in order to detect the presence of nucleosomes in two major areas of the rDNA unit (see map in Fig. 4): probe C (from +5911 to +6295), which detects the 35S coding sequence transcribed by Pol I, and probe P (from −615 to −509), which anneals with the promoter and part of the region with positioned nucleosomes (also Fig. 1; all numbering is from 35S RNA transcriptional start, +1).
Fig. 4.

Pol I, unlike Pol II, modifies nucleosome spacing at the rDNA locus. Spheroplasts from the specified strains were digested with increasing amounts of MNase (triangles), and DNA was extracted and resolved on a 1.2% agarose gel. Southern analysis by hybridization with C (A) and P (B) probes. Probe map positions are reported in the upper part of the figure. M, molecular weight markers. Black dots indicate DNA fragments derived from digestion of chromatin containing one, two, three, or four nucleosomes.
As shown in Fig. 4A, when probe C, corresponding to the coding region of the 35S RNA, is used, the nucleosomal pattern is maintained in PSW (Pol I-nontranscribing strain), while the strains with active Pol I transcription show a diffuse smear (more evident in the ATU sample).
In the PSW strain (probe P, Fig. 4B), a repeated 160-bp sharp ladder of bands (typical of nucleosomal organization) is evident for the NTS region. The samples from the two strains (WT and ATU), transcribing rDNA, show very similar digestion profiles, even though in the ATU sample the digestion pattern, corresponding to the dimer particle, shows a diffuse or larger digestion.
Altogether, these data suggest that the chromatin structure of the NTS region is not reorganized by either Pol I or Pol II transcription. Conversely, in the coding region of the 35S gene only the nontranscribing strain (PSW) retains the nucleosomal ladder, while in strains where transcription occurs (WT and ATU), the same region shows a loss of organized nucleosomes.
These observations, together with the acetylation data shown in Fig. 3, suggest that hyperacetylation at the COD region is coupled with chromatin remodeling linked to Pol I transcription. Conversely the hyperacetylation shown at the E-PRO region for the PSW strain (Fig. 3) does not correlate with chromatin remodeling. We hypothesize that the high level of histone modifications in the NTS of the PSW strain is linked to Pol II transcription, even though chromatin remodeling is not observed.
Nucleosome occupancy changes under different transcriptional conditions.
To further characterize the chromatin organization occurring at the coding and NTS regions, in association with both Pol I and Pol II transcription, we evaluated nucleosome presence by measuring H2A and H3 amounts bound to the five investigated regions of rDNA.
We performed Chr-IP (25) using antibodies against H2A or H3 histones in PSW, WT, and ATU strains, and the results are shown in Fig. 5. After IP, the recovered DNA was analyzed by PCR, using specific primers as described above (Fig. 3). Primers for the ACT1 coding sequence were included in each reaction mixture as internal controls. The intensity of the resulting fragments was analyzed by phosphorimaging, and the specific bands of rDNA (COD, ENH, NUC, E-PRO, and C-PRO) were normalized to the ACT1 fragments. IP/input ratio was calculated as described for Fig. 3.
Fig. 5.

Histone occupancy changes with transcription of 35S RNA. Chr-IP analysis for quantitative evaluation of H2A and H3 histone amounts in the specified strains (♦, WT; ▴, PSW; □, ATU) with anti-H2A (top graph) or anti-H3 (bottom graph) antibodies. Values refer to H2A or H3 enrichment calculated as IP/input ratio normalized to ACT1 in the different regions and different strains.
As reported in the graphs in Fig. 5, the COD region of the PSW strain shows twice as much immunoprecipitated histone H2A as does the ATU strain, while the WT strain shows an intermediate level; a similar behavior is evident also for H3. This pattern indicates nucleosome eviction associated with high Pol I activity. In the NUC and EHN regions, only small differences were observed among the analyzed strains, in agreement with the organization of nucleosomes shown in Fig. 4. When the regions near the ncRNA promoters were analyzed (E- and C-PRO), the amounts of immunoprecipitated histones were similar for all the strains even if the ATU strain seemed to contain less nucleosome in the C-PRO region. It is interesting that in the promoter and coding regions the amounts of H2A and H3 inversely follow the Pol I transcription rate.
Taken together, the data reported in Fig. 5 show that the chromatin alterations (Fig. 4) observed when transcription occurs in the coding region are due to loss of nucleosomes (Fig. 5, COD points) and that this effect is particularly evident in the ATU strain, where Pol I transcription machinery is strongly engaged.
Nucleosome disruption differentially affects Pol I and Pol II transcription at the rDNA locus.
The data reported in Fig. 4 and 5 demonstrate that the nucleosomes on the NTS are not remodeled by RNA polymerase I transcription. In order to verify whether the nucleosomal organization of NTS may interfere with Pol I or Pol II transcription, we measured both the 35S RNA synthesis and ncRNA production in a yeast strain (UKY403) where the histone H4 gene is under GAL1 promoter control (14). When the cells are shifted from galactose- to glucose-containing medium (switching off H4 synthesis), a regular chromatin organization is converted to generalized loss of nucleosomal structures (14). We grew UKY403 cells in galactose medium and withdrew two aliquots, one to perform MNase digestion and the other for RNA detection. The remaining part of the cell population was switched to glucose for 240 min and 360 min, and the corresponding aliquots were treated as reported above. As shown in Fig. 6B, chromatin samples from the galactose culture, digested with MNase and analyzed with probe P (Fig. 6A shows localization), showed a typical nucleosomal ladder (0 min). At the opposite end, cells from the glucose-containing medium (240 min and 360 min) did not show a nucleosomal arrangement, confirming the almost-complete dissolution of the regular chromatin structure at the rDNA locus. Then, we analyzed both Pol I and Pol II transcripts during the Gal-Glu shift (Fig. 6C and D, respectively). The analysis of the 35S RNA transcript was performed by primer extension, using as a primer the oligonucleotide PSW (which hybridizes to the 35S precursor rRNA, 130 nucleotides [nt] downstream of the RNA polymerase I start site as reported in reference 39 and shown in Fig. 6A). This procedure reveals only newly synthesized RNA, due to the oligonucleotide annealing to a rapidly processed region (35). RNA from cells grown either in galactose or in glucose for 240 or 360 min, respectively, did not show any significant difference, indicating that nucleosome organization of NTS2 does not directly affect the 35S RNA transcription (Fig. 6C). Pol II transcripts were analyzed by RT-PCR starting from strand-specific oligonucleotides (Fig. 6A). The resulting pattern (Fig. 6B) was different from that of Pol I transcription. In fact, a significant increase of ncRNA production from E-PRO is observed (S2 and S3 amplifications) while only a moderate increase occurs at the C-PRO sequence (Fig. 6D).
Taken together, these data suggest that when chromatin disruption occurs, Pol I transcription is not affected, whereas Pol II is effectively activated at the E-PRO promoter, while the C-PRO promoter seems to be almost unaffected.
Pol I transcription influences DNA topoisomerase I cleavage sites upstream from the 35S RNA promoter.
It has been demonstrated that the DNA topoisomerase I mutant (top1) overproduces ncRNAs from the NTS region (10); we wanted to verify whether activity of this enzyme is affected by Pol I transcription and ncRNA production by employing a powerful assay which measures the site-specific DNA topoisomerase I activity in vivo (37), based on the specific inhibitor CPT (11). For this purpose, we compared the cleavage site production by DNA topoisomerase I in several strains such as the ATU, WT, and PSW strains.
Exponentially growing cells were permeabilized as reported for micrococcal digestion (see above) and treated with 50 and 100 μM camptothecin, respectively, for cleavage site induction. After DNA purification, the samples were primer extended under linear PCR conditions with labeled R3 oligonucleotide (see Fig. 7 for map position and see Materials and Methods for its sequence [37]) and analyzed on a sequencing gel. As shown in Fig. 7A, the site-specific DNA topoisomerase I cleavage activity at the −171-bp sequence from the 35S RNA transcriptional start, previously described (37), is visible in all samples treated with CPT (triangles). After quantification and normalization of the cleavage band relative to that of unreacted DNA, we observed that the DNA topoisomerase I site-specific activity is affected by the ongoing Pol I transcription. In particular, the ATU strain (high Pol I activity) shows the highest cleavage efficiency whereas the PSW strain (low Pol I activity) shows the lowest.
Fig. 7.
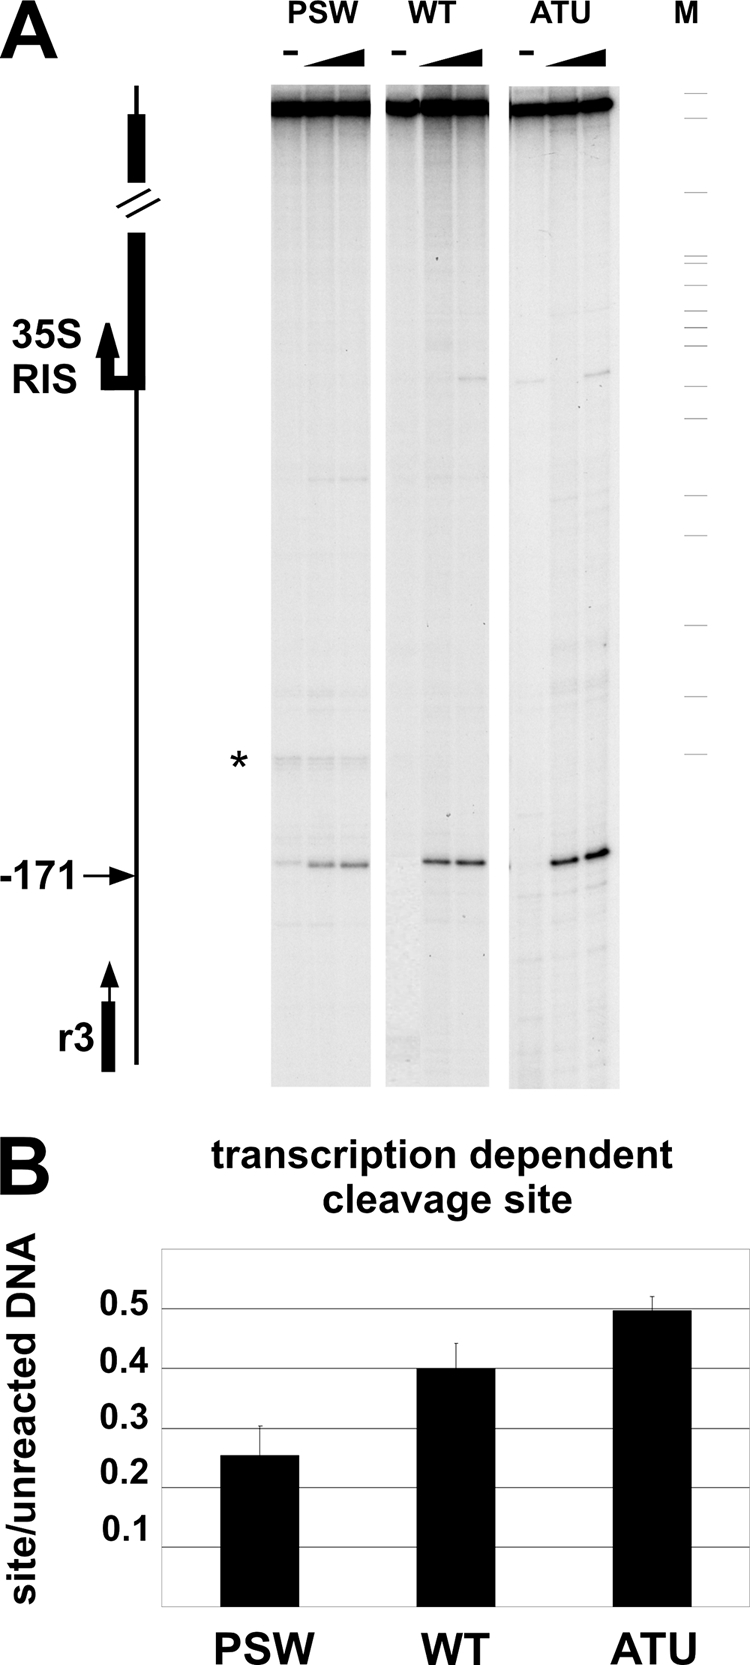
In vivo DNA topoisomerase I cleavage efficiency depends on Pol I activity. (A) Spheroplasts from WT, PSW, or ATU cells were treated with 50 and 100 μM CPT (triangles); − indicates unreacted material. M, molecular weight marker (pBR322 MspI). The fragments resulting from DNA topoisomerase I activity were primer extended from oligonucleotide R3 (vertical black arrow) annealing at position −268 bp from the 35S RNA start. The horizontal black arrow indicates the DNA topoisomerase I cleavage site; the star indicates a pausing site of Vent polymerase. On the left of the figure a representation of the analyzed region is shown. (B) Quantification of the DNA topoisomerase I cleavage activity at position −171 bp. The intensity of the cleavage site (50 μM CPT) was normalized to the unreacted material and reported as a histogram bar for each strain analyzed. Standard deviations are reported.
These data, along with those concerning Pol I transcription and ncRNA production reported above, suggest that strong DNA topoisomerase I activity is associated with both high Pol I transcription and almost-complete ncRNA silencing; conversely, when transcription of 35S RNA is abolished, ncRNAs increase and the in vivo DNA topoisomerase I activity is low.
DISCUSSION
The real meaning of transcriptional silencing occurring at the rDNA locus has not been fully understood yet; in fact Pol II-transcribed genes, inserted into the rDNA, lie in regions where the DNA is heavily transcribed by Pol I; this excludes a simple silencing model based on transcription factor inaccessibility. We hypothesized that rDNA silencing represents the natural way to repress the Pol II-dependent ncRNA synthesis that could have potentially dangerous effects; in fact, it has been observed that ncRNAs, produced from the NTS region, are associated with altered epigenetic modifications of histones (19) and induction of hyperrecombination in the ribosomal units (10).
In order to clarify the physiological meaning of ribosomal silencing, we measured ncRNA production by Pol II in yeast strains differing in RNA polymerase I transcription rates. In addition, we wanted to better characterize the relationship between the two RNA polymerases' activity and reciprocal silencing. As reported in Fig. 2, overexpression of ncRNAs from C-PRO is observed for mutants defective in Pol I transcription, especially in the PSW mutant, where UAF is lacking (in this strain the rDNA copies are transcribed by Pol II). Actually, as reported with in vitro and in vivo analyses (1, 13), UAF binds DNA just on the region corresponding to the C-PRO promoter and this may be responsible for inhibition of Pol II transcription from this region (Fig. 2). This inhibitory role, performed by UAF, could be also exerted when the chromatin organization is completely lost (Fig. 6), during repression of H4 synthesis. The C-PRO-derived ncRNAs did not modify their synthesis, while E-PRO became active in the absence of nucleosomes. The capability of UAF to repress ncRNA synthesis may be relevant to the PSW phenotype. We hypothesize that the absence of UAF, necessary for the PSW phenotype, triggers ncRNA production that in turn induces rDNA recombination and copy number increase (10, 15, 33). This essential step compensates for the low level of 35S RNA synthesis by Pol II in the PSW mutant, where Pol I is switched off (22).
Chromatin modifications have been hypothesized to occur during rDNA silencing (19); thus, we have evaluated whether alteration of histone acetylation occurs in mutants differing in 35S RNA transcription. When Pol II activity rises, producing more ncRNAs (strain PSW), a significant increase of histone acetylation is observed, specifically at the Pol II promoters (E-PRO and C-PRO) (Fig. 3); conversely, when Pol I transcription is maximal (strain ATU), the acetylation at the E- and C-PRO promoters goes down while it increases at the coding region (Fig. 3). Other regions engaged in neither Pol I nor Pol II transcription do not change their acetylation state significantly in the various mutants (ENH and NUC regions, all strains, Fig. 3). These observations suggest that histone acetylation correlates with Pol II transcription at E- and C-PRO promoters when silencing is lost. The acetylation level of the coding region seems to directly depend only on Pol I efficiency. We also observed an effective loss of histone proteins when transcription of Pol I is high, while during Pol II activity this does not occur (Fig. 4 and 5). Accordingly, it has been recently demonstrated that actively transcribed rRNA genes are largely devoid of histone molecules, and they are also associated with the high-mobility group protein Hmo1 (20); moreover, significant chromatin reorganization has also been reported for active ribosomal genes (7). In summary, our comparison between Pol I and Pol II transcription of ribosomal genes and ncRNAs shows that (i) Pol I, with its extremely high activity, works in a chromatin context where nucleosomes are lost or significantly acetylated and (ii) Pol II, whose efficiency of transcription at E- and C-PRO promoters is moderate, requires a significant increase of histone acetylation, without complete chromatin disruption, as shown in Fig. 4. This observation is also confirmed by the chromatin dissolution experiment (Fig. 6) showing that in the strain where the H4 gene is shut down, only genes served by Pol II become more highly transcribed, while Pol I does not take advantage of an open chromatin condition because it is intrinsically able to remove nucleosomes. Previous reports (14, 32) have shown conflicts regarding the extent of Pol I transcription after chromatin disruption. Our results agree with those of Kim et al. (14), even though different treatments, conditions, and measuring methods should be taken into account when differences are observed.
Finally, we investigated the role of DNA topoisomerase I in Pol I transcription and ribosomal silencing. We have demonstrated that in vivo DNA topoisomerase I activity correlates with Pol I transcription, suggesting that the swivel function goes together with the transcription machinery. Considering that top1 mutants show loss of transcriptional silencing, we can speculate that the swivel activity of DNA topoisomerase I is necessary to sustain Pol I transcription and, thus, that it is detrimental for Pol II activity.
In conclusion, our observations demonstrate that transcriptional silencing occurring at the rDNA locus represses ncRNAs with a strength inversely proportional to Pol I transcription. In addition, localized regions of histone hyperacetylation occur in E- and C-PRO elements when Pol II is active and in the coding region when Pol I is fully functional. The DNA topoisomerase I site-specific activity also follows RNA polymerase I transcription. We propose that repression of ncRNAs in response to active RNA polymerase I transcription represents a physiological regulative circuit (Fig. 8).
Fig. 8.

Relationship between Pol I transcription and ncRNA production. Schematic representation of the relationship between events in transcription by RNA polymerases I and II and histone acetylation in regulative and coding regions of rDNA in S. cerevisiae.
Previous studies have addressed the issue of ribosomal silencing by the analysis of reporter genes artificially inserted in the ribosomal locus (2, 3, 5, 27). The experiments reported here indicate that 35S RNA transcription by RNA polymerase I represents the natural control of ncRNA production, associated with genome instability and possibly aging in yeast. In addition we identified a new epigenetic marker of Pol II activity, H3 and H4 histone acetylation, within the NTS region at the ncRNA cryptic promoters.
ACKNOWLEDGMENTS
This work was partially supported by the Istituto Pasteur-Fondazione Cenci Bolognetti Universita' di Roma La Sapienza and by Grandi progetti d'Ateneo 2007 Sapienza, Università di Roma.
We are grateful to M. Nomura, M. Grunstein, and P. Thurieaux for yeast mutants. We thank Micaela Caserta for critical reading of the manuscript. We also thank an anonymous reviewer of the manuscript for helpful and kind suggestions.
Footnotes
Published ahead of print on 28 December 2009.
REFERENCES
- 1.Bordi L., Cioci F., Camilloni G. 2001. In vivo binding and hierarchy of assembly of the yeast RNA polymerase I transcription factors. Mol. Biol. Cell 12:753–760 [DOI] [PMC free article] [PubMed] [Google Scholar]
- 2.Bryk M., Banerjee M., Murphy M., Knudsen K. E., Garfinkel D. J., Curcio M. J. 1997. Transcriptional silencing of Ty1 elements in the RDN1 locus of yeast. Genes Dev. 11:255–269 [DOI] [PubMed] [Google Scholar]
- 3.Buck S. W., Sandmeier J. J., Smith J. S. 2002. RNA polymerase I propagates unidirectional spreading of rDNA silent chromatin. Cell 111:1003–1014 [DOI] [PubMed] [Google Scholar]
- 4.Cioci F., Vogelauer M., Camilloni G. 2002. Acetylation and accessibility of rDNA chromatin in Saccharomyces cerevisiae in (Delta)top1 and (Delta)sir2 mutants. J. Mol. Biol. 322:41–52 [DOI] [PubMed] [Google Scholar]
- 5.Cioci F., Vu L., Eliason K., Oakes M., Siddiqi I. N., Nomura M. 2003. Silencing in yeast rDNA chromatin: reciprocal relationship in gene expression between RNA polymerase I and II. Mol. Cell 12:135–145 [DOI] [PubMed] [Google Scholar]
- 6.Conrad-Webb H., Butow R. A. 1995. A polymerase switch in the synthesis of rRNA in Saccharomyces cerevisiae. Mol. Cell. Biol. 15:2420–2428 [DOI] [PMC free article] [PubMed] [Google Scholar]
- 7.Dammann R., Lucchini R., Koller T., Sogo J. M. 1993. Chromatin structures and transcription of rDNA in yeast Saccharomyces cerevisiae. Nucleic Acids Res. 21:2331–2338 [DOI] [PMC free article] [PubMed] [Google Scholar]
- 8.Fritze C. E., Verschueren K., Strich R., Esposito R. E. 1997. Direct evidence for SIR2 modulation of chromatin structure in yeast rDNA. EMBO J. 16:6495–6509 [DOI] [PMC free article] [PubMed] [Google Scholar]
- 9.Hontz R. D., French S. L., Oakes M. L., Tongaonkar P., Nomura M., Beyer A. L., Smith J. S. 2008. Transcription of multiple yeast ribosomal DNA genes requires targeting of UAF to the promoter by Uaf30. Mol. Cell. Biol. 28:6709–6719 [DOI] [PMC free article] [PubMed] [Google Scholar]
- 10.Houseley J., Kotovic K., Hage A. E., Tollervey D. 2007. Trf4 targets ncRNAs from telomeric and rDNA spacer regions and functions in rDNA copy number control. EMBO J. 26:4996–5006 [DOI] [PMC free article] [PubMed] [Google Scholar]
- 11.Hsiang Y. H., Hertzberg R., Hecht S., Liu L. F. 1985. Camptothecin induces protein-linked DNA breaks via mammalian DNA topoisomerase I. J. Biol. Chem. 260:14873–14878 [PubMed] [Google Scholar]
- 12.Imai S., Armstrong C. M., Kaeberlein M., Guarente L. 2000. Transcriptional silencing and longevity protein Sir2 is an NAD-dependent histone deacetylase. Nature 403:795–800 [DOI] [PubMed] [Google Scholar]
- 13.Keys D. A., Lee B. S., Dodd J. A., Nguyen T. T., Vu L., Fantino E., Burson L. M., Nogi Y., Nomura M. 1996. Multiprotein transcription factor UAF interacts with the upstream element of the yeast RNA polymerase I promoter and forms a stable preinitiation complex. Genes Dev. 10:887–903 [DOI] [PubMed] [Google Scholar]
- 14.Kim U. J., Han M., Kayne P., Grunstein M. 1988. Effects of histone H4 depletion on the cell cycle and transcription of Saccharomyces cerevisiae. EMBO J. 7:2211–2219 [DOI] [PMC free article] [PubMed] [Google Scholar]
- 15.Kobayashi T., Ganley A. R. 2005. Recombination regulation by transcription-induced cohesin dissociation in rDNA repeats. Science 309:1581–1584 [DOI] [PubMed] [Google Scholar]
- 16.Kurdistani S. K., Grunstein M. 2003. Histone acetylation and deacetylation in yeast. Nat. Rev. Mol. Cell Biol. 4:276–284 [DOI] [PubMed] [Google Scholar]
- 17.Lalo D., Steffan J. S., Dodd J. A., Nomura M. 1996. RRN11 encodes the third subunit of the complex containing Rrn6p and Rrn7p that is essential for the initiation of rDNA transcription by yeast RNA polymerase I. J. Biol. Chem. 271:21062–21067 [DOI] [PubMed] [Google Scholar]
- 18.Landry J., Sutton A., Tafrov S. T., Heller R. C., Stebbins J., Pillus L., Sternglanz R. 2000. The silencing protein SIR2 and its homologs are NAD-dependent protein deacetylases. Proc. Natl. Acad. Sci. U. S. A. 97:5807–5811 [DOI] [PMC free article] [PubMed] [Google Scholar]
- 19.Li C., Mueller J. E., Bryk M. 2006. Sir2 represses endogenous polymerase II transcription units in the ribosomal DNA nontranscribed spacer. Mol. Biol. Cell 17:3848–3859 [DOI] [PMC free article] [PubMed] [Google Scholar]
- 20.Merz K., Hondele M., Goetze H., Gmelch K., Stoeckl U., Griesenbeck J. 2008. Actively transcribed rRNA genes in S. cerevisiae are organized in a specialized chromatin associated with the high-mobility group protein Hmo1 and are largely devoid of histone molecules. Genes Dev. 22:1190–1204 [DOI] [PMC free article] [PubMed] [Google Scholar]
- 21.Mueller J. E., Li C., Bryk M. 2007. Isw2 regulates gene silencing at the ribosomal DNA locus in Saccharomyces cerevisiae. Biochem. Biophys. Res. Commun. 361:1017–1021 [DOI] [PMC free article] [PubMed] [Google Scholar]
- 22.Oakes M., Siddiqi I., Vu L., Aris J., Nomura M. 1999. Transcription factor UAF, expansion and contraction of ribosomal DNA (rDNA) repeats, and RNA polymerase switch in transcription of yeast rDNA. Mol. Cell. Biol. 19:8559–8569 [DOI] [PMC free article] [PubMed] [Google Scholar]
- 23.Petes T. D. 1979. Yeast ribosomal DNA genes are located on chromosome XII. Proc. Natl. Acad. Sci. U. S. A. 76:410–414 [DOI] [PMC free article] [PubMed] [Google Scholar]
- 24.Robyr D., Suka Y., Xenarios I., Kurdistani S. K., Wang A., Suka N., Grunstein M. 2002. Microarray deacetylation maps determine genome-wide functions for yeast histone deacetylases. Cell 109:437–446 [DOI] [PubMed] [Google Scholar]
- 25.Rundlett S. E., Carmen A. A., Suka N., Turner B. M., Grunstein M. 1998. Transcriptional repression by UME6 involves deacetylation of lysine 5 of histone H4 by RPD3. Nature 392:831–835 [DOI] [PubMed] [Google Scholar]
- 26.Sherman F., Fink G. R., Lawrence C. 1983. Methods in yeast genetics. Cold Spring Harbor Laboratory Press, Cold Spring Harbor, NY [Google Scholar]
- 27.Smith J. S., Boeke J. D. 1997. An unusual form of transcriptional silencing in yeast ribosomal DNA. Genes Dev. 11:241–254 [DOI] [PubMed] [Google Scholar]
- 28.Straight A. F., Shou W., Dowd G. J., Turck C. W., Deshaies R. J., Johnson A. D., Moazed D. 1999. Net1, a Sir2-associated nucleolar protein required for rDNA silencing and nucleolar integrity. Cell 97:245–256 [DOI] [PubMed] [Google Scholar]
- 29.Tanny J. C., Dowd G. J., Huang J., Hilz H., Moazed D. 1999. An enzymatic activity in the yeast Sir2 protein that is essential for gene silencing. Cell 99:735–745 [DOI] [PubMed] [Google Scholar]
- 30.Thomas B. J., Rothstein R. 1989. Elevated recombination rates in transcriptionally active DNA. Cell 56:619–630 [DOI] [PubMed] [Google Scholar]
- 31.Thuriaux P., Mariotte S., Buhler J. M., Sentenac A., Vu L., Lee B. S., Nomura M. 1995. Gene RPA43 in Saccharomyces cerevisiae encodes an essential subunit of RNA polymerase I. J. Biol. Chem. 270:24252–24257 [DOI] [PubMed] [Google Scholar]
- 32.Tongaonkar P., French S. L., Oakes M. L., Vu L., Schneider D. A., Beyer A. L., Nomura M. 2005. Histones are required for transcription of yeast rRNA genes by RNA polymerase I. Proc. Natl. Acad. Sci. U. S. A. 102:10129–10134 [DOI] [PMC free article] [PubMed] [Google Scholar]
- 33.Vasiljeva L., Kim M., Terzi N., Soares L. M., Buratowski S. 2008. Transcription termination and RNA degradation contribute to silencing of RNA polymerase II transcription within heterochromatin. Mol. Cell 29:313–323 [DOI] [PubMed] [Google Scholar]
- 34.Venditti S., Camilloni G. 1994. In vivo analysis of chromatin following nystatin-mediated import of active enzymes into Saccharomyces cerevisiae. Mol. Gen. Genet. 242:100–104 [DOI] [PubMed] [Google Scholar]
- 35.Venema J., Tollervey D. 1999. Ribosome synthesis in Saccharomyces cerevisiae. Annu. Rev. Genet. 33:261–311 [DOI] [PubMed] [Google Scholar]
- 36.Verdone L., Camilloni G., Di Mauro E., Caserta M. 1996. Chromatin remodeling during Saccharomyces cerevisiae ADH2 gene activation. Mol. Cell. Biol. 16:1978–1988 [DOI] [PMC free article] [PubMed] [Google Scholar]
- 37.Vogelauer M., Camilloni G. 1999. Site-specific in vivo cleavages by DNA topoisomerase I in the regulatory regions of the 35 S rRNA in Saccharomyces cerevisiae are transcription independent. J. Mol. Biol. 293:19–28 [DOI] [PubMed] [Google Scholar]
- 38.Vogelauer M., Cioci F., Camilloni G. 1998. DNA protein-interactions at the Saccharomyces cerevisiae 35 S rRNA promoter and in its surrounding region. J. Mol. Biol. 275:197–209 [DOI] [PubMed] [Google Scholar]
- 39.Vu L., Siddiqi I., Lee B. S., Josaitis C. A., Nomura M. 1999. RNA polymerase switch in transcription of yeast rDNA: role of transcription factor UAF (upstream activation factor) in silencing rDNA transcription by RNA polymerase II. Proc. Natl. Acad. Sci. U. S. A. 96:4390–4395 [DOI] [PMC free article] [PubMed] [Google Scholar]