Abstract
Dynamical properties of the heme compound iron octaethylporphyrin (FeOEP) were previously determined by direct measurement of the Fe vibrational density of states with nuclear resonance vibrational spectroscopy (NRVS). A best-fit set of normal modes was calculated by comparing simulations using classical force fields to the NRVS results. Like all previous calculations of this type, a single isolated molecule was assumed, even though the data were from solid polycrystalline specimens. A complete three-dimensional crystal normal mode calculation reported here reveals that the previously neglected intermolecular couplings lead to a significantly better fit at low frequencies, and certain high frequency artifacts are removed as well. The off-diagonal coupling constants imposed by single molecule calculations prove to be unnecessary, indicating that these had served to simply emulate the missing crystal field effects. Dispersion curves also yield the speed of sound, which could be compared to the independently determined NRVS value to further fine-tune intermolecular force constants.
1. Introduction
The normal modes of vibration in a molecule are determined by the set of interatomic force constants associated with the molecule’s equilibrium structure. Normal mode frequencies are measured with a variety of experimental techniques such as Raman and infrared spectroscopies,1–3 with gas phase, liquid, and even solid specimens, and the experimental spectra are compared to those predicted by empirical force field4,5 or from density functional theory,6,7 for example, in order to refine the force fields or confirm the validity of the particular density functionals employed. The calculations typically assume that any intermolecular interactions are weak, so that only a single molecule need be considered.
The normal modes of an infinite crystal, on the other hand, also depend on the phase shift of a given atomic motion with respect to translation from one unit cell to the next, a consequence of Bloch’s theorem. This phase shift is expressed by the factor exp(ik•R) in the normal mode eigenfunction, where k is the wavevector and R the unit cell translation vector. The complete set of normal modes is calculated for each value of k, and the dependence of these normal modes on wave vector leads to dispersion curves where a given normal mode (now referred to as a phonon) might be dispersed over a continuous band of energies for the range of k vectors encompassed by the reciprocal unit cell. Molecular crystals are ones where the molecules that condense to form a crystal retain strong intramolecular interactions but the intermolecular interactions are relatively weak. For molecular crystals one expects a close correspondence between the normal modes of the single molecule and the phonon bands of the crystal.
Nuclear resonance vibrational spectroscopy (NRVS) is a synchrotron-based technique that measures the Fe-weighted vibrational density of states (VDOS) for iron-containing materials, based on the resonant interaction of 57Fe nuclei with x-rays.8 VDOS spectra have been obtained from a variety of heme proteins and iron-porphyrin complexes, and several have been compared to normal mode calculations.4,5,9 Normal mode refinement to NRVS data is especially stringent because the computed normal modes must match the measured VDOS in both frequency and Fe amplitude, on an absolute scale. NRVS measurements of heme model compounds have been obtained mostly from polycrystalline material, and from single crystals in a few special cases.10 Despite that, all normal mode calculations have assumed an isolated single molecule, neglecting any intermolecular interactions associated with crystal packing.
Two issues commonly arise in the normal mode refinements to NRVS data on heme compounds: the fits are always relatively poor for energies below about 50 cm−1, and the empirical force field approach generally requires the introduction of off-diagonal coupling constants that couple one kind of motion at a particular location in the molecule to another motion at a different location. Although necessary for a good fit, these off-diagonal terms typically have no clear physical origin. The disagreement at low energies has been attributed to the neglect of intermolecular coupling.
In this work we calculate the full lattice dynamics of a simple heme molecular crystal, iron octaethylporphyrin (FeOEP), using an empirical force field that explicitly includes intermolecular force constants. We compare these results with a previously published single molecule normal mode analysis for FeOEP refined to NRVS data,11 to demonstrate what essential dynamics are neglected by the standard single molecule approach. Including lattice dynamics leads to better fits to the low energy density of states and the elimination of certain high energy artifacts. The lattice calculations are done without the off-diagonal couplings necessary for the single molecule fits, showing that these were a consequence of leaving out the intermolecular interactions. We also show how comparison of calculated and measured sound velocities allows for improved refinement of the intermolecular couplings.
While density functional calculations (DFT) are normally restricted to single molecules6,12, some molecular crystals have been a subject for periodic DFT as well. Calculations have been reported for benzoic acid and compared with inelastic neutron scattering (INS) measurements on powder molecular crystals13. Later, inelastic x-ray scattering (IXS) data were obtained and compared to INS data14 and to dispersion curves obtained from periodic DFT calculations. Full lattice dynamics results with periodic DFT 15 were also described for benzene molecular crystal powder specimens.
2. Crystal Model and Normal Mode Calculations
Sample preparation and experimental methods are described in a previous report.11 The NRVS technique16 utilizes the Mössbauer transition in the 57Fe nucleus to observe shifts in resonant x-ray absorption to measure the Fe vibrational density of states (VDOS). All data were obtained at the Advanced Photon Source x-ray synchrotron at Argonne National Laboratory.
Empirical force field normal mode calculations for a molecular crystal are very similar to those for a single molecule, except for the addition of intermolecular force constants and the consequences of symmetry. From Bloch’s theorem, if an eigenvector has a given atomic displacement within one molecular unit cell, the atomic displacement in another unit cell differs by a phase shift exp(ik•R), where k is a wave vector within the Brillouin zone and R the unit cell translation vector. Choosing a particular wave vector we compute the normal modes, then repeat for a set of wave vectors that span the Brillouin zone. The final Fe VDOS is the average of each individual Fe VDOS.
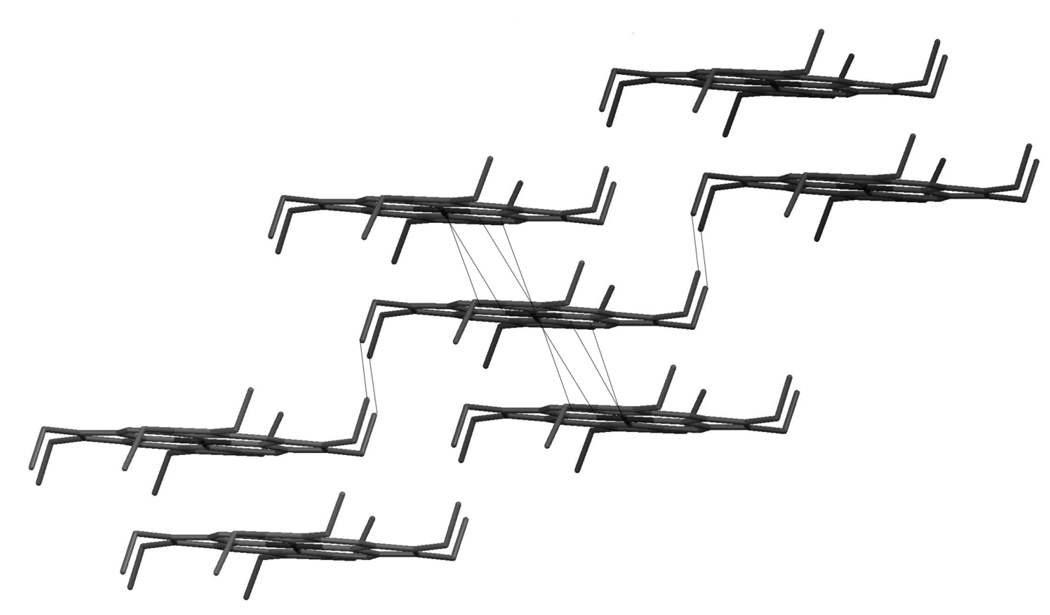
The FeOEP molecule has 41 non-hydrogen atoms, with no ligand attached to the four-coordinated Fe atom. The x-ray structure determined a point group of Ci, having only inversion symmetry, and the P1 space group with one molecule per unit cell.17 Figure 1 shows the stacking of molecules within a [100] plane, with four dashed lines originating on the Fe atom denoting the nearest neighbor distances between the Fe and C atoms of the adjacent molecules. In the purely phenomenological approach we have adopted, we assign intermolecular force constants to these “bonds.” Since prior single molecule normal mode analysis demonstrated the importance of peripheral substituents to Fe motion, we also assigned force constants to the nearest-neighbor intermolecular ethyl-ethyl pairs, also indicated by dashed lines in Figure 1. The number of such pairs turns out to be especially important for fitting the measured speed of sound.
Figure 1.
Crystal packing of FeOEP in the (100) plane. This wireframe version does not include hydrogen atoms at the eight ethyl groups. The dashed lines emanating from the core of the molecule show the shortest nearest neighbor distances to the central Fe atoms, and additional dashed lines denote ethyl-ethyl intermolecular distances. These form the initial set of intermolecular couplings for the crystal normal mode analysis.
There are three atoms (one Fe atom and two C atoms) in the porphyrin core of the neighboring molecule that form four such bonds with distances about 3.5Å, in addition to four bonds between four pairs of ethyl carbon atoms. Thus we have chosen seven (three core plus four ethyl) extra atoms to form eight (four core plus four ethyl) intermolecular bonds. As a result, our extended molecule has 41+7 = 48 non-hydrogen atoms. Since the number of atoms per unit cell in the crystal equals the number of atoms in the original molecule (41), to compute the normal modes we need to modify the B-matrix which contains all the internal coordinates (as described by Califano18), and to impose periodicity by introducing a phase shift exp(ik•R).
The single molecule B-matrix, Bsm, has n rows for the internal coordinates and m columns for the three vector components of the N atoms (m=3N), a matrix of size 334×123. The molecule is then enlarged to include seven additional atoms from neighboring molecules (1 Fe and 2 C from the core, and 4 C from ethyls) and these are assigned stretch, bend and torsional internal coordinates, for an extended matrix Bext of size 410×144. This extended matrix must be mapped back onto the same number of atoms as in the single molecule, since there is one molecular unit per unit cell in the crystal. The mapping is given by:
for a crystal B-matrix of size 410×123. The wave vector k is incorporated as a phase factor in the B-matrix,
where r⃗j are the position coordinates of the atom corresponding to the j-th column. Solving for the complete set of normal modes for a given wave vector k takes less than a minute of computation time using minimal computer resources. Sampling the Brillouin zone at 27 equally spaced intervals proved sufficient for observing the effects of dispersion for most modes.
3. Results
Normal mode calculations commenced with the best-fit empirical force constants determined by the single molecule analysis of NRVS data, with the addition of trial values for the intermolecular force constants. After sampling the entire Brillouin zone, results were averaged to produce the Fe-weighted VDOS to compare with the NRVS data.
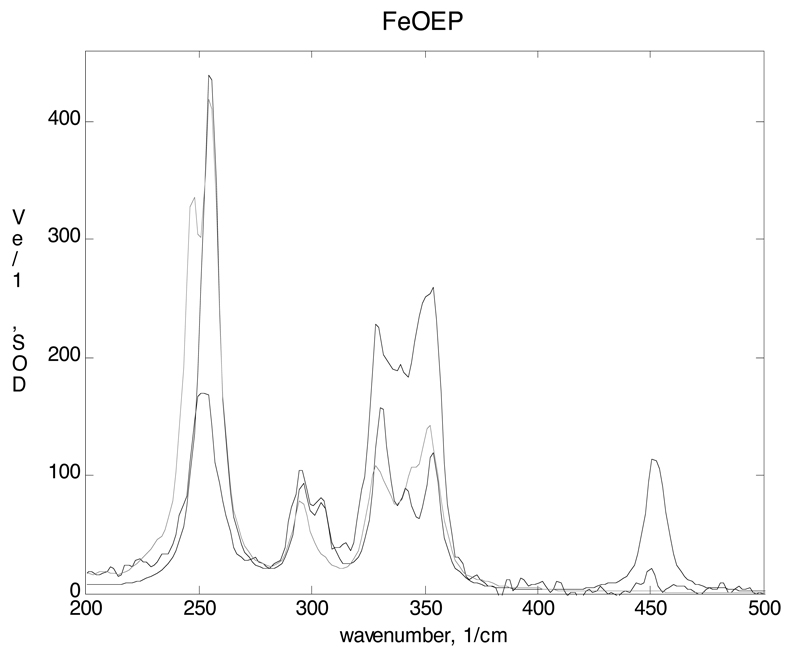
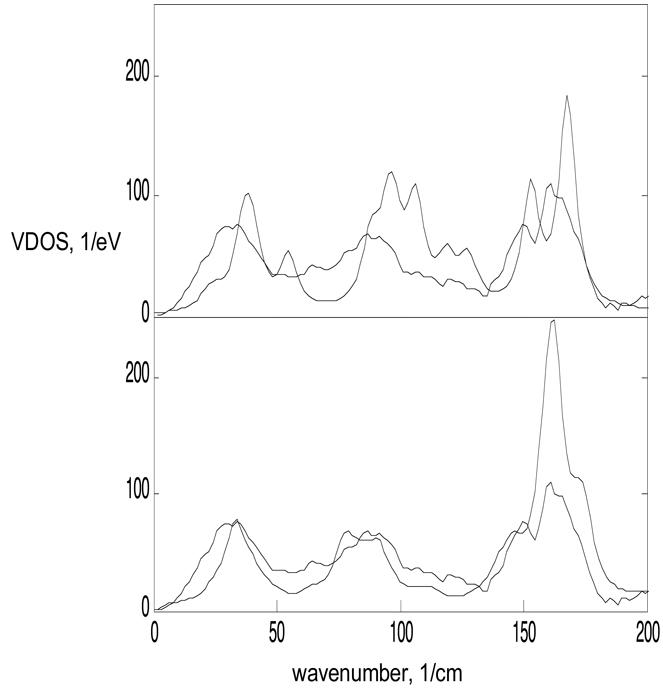
To speed up and simplify our calculations the protocol described in previous work11 on FeOEP single molecule normal mode analysis was used. First, we reduced the number of force constants, breaking them into groups using symmetry. The FeOEP molecule possesses only inversion symmetry, but we initially impose D4h symmetry on the force constants. After optimizing the fit with D4h symmetry, inversion symmetry was re-imposed and force constants fine-tuned to achieve the best fit shown in Fig. 2 &Fig. 3. In general the crystal model is clearly superior to the single molecule model. Only slight changes to the single molecule force constants were required; most of the improvement arises from the additional intermolecular force constants.
Figure 2.
Comparison of calculated Fe VDOS to the NRVS data above 200 cm−1. The Fe VDOS from crystal (light line) and single molecule (dark line) normal mode calculations are both in fairly good agreement for the modes between 200 and 400 cm−1. The single molecule calculation predicts a strong peak at 450 cm−1 that is not seen in the data. Since it does not appear in the crystal calculation, it appears to be a consequence of neglecting intermolecular coupling.
Figure 3.
Low frequency comparison. The top panel compares the single molecule Fe VDOS calculation to the NRVS data for frequencies below 200 cm−1; lower panel is the same for the crystal calculation. There is significantly improved agreement for the crystal calculation, showing that intermolecular coupling is especially important for low frequencies.
The spectrum can be divided into three regions: low frequencies below 100 cm−1, the central region from 100 to 450 cm−1, and high frequencies above 450 cm−1. Modes in the central region are largely core vibrations that prove to be relatively insensitive to the addition of intermolecular interactions. This is consistent with the previous observation that artificially increasing the ethyl masses on the single molecule had little impact in this frequency range.11 The single molecule normal mode analysis also produced to high frequency modes associated with out-of-plane ethyl motion at 450 and 750, where none existed in the data. These were clearly artifacts of the single molecule approximation that are absent in the crystal results.
Poor fits to NRVS data at low frequencies have previously been attributed to the neglect of interactions with neighboring molecules. Figure 3 shows both the single molecule best fit to FeOEP and the crystal best fit, showing the significant improvement possible from the inclusion of only a few intermolecular coupling constants and crystalline periodicity. Even better fits are likely with more complete modeling of all physically relevant interactions between molecular units.
The crystal model without off-diagonal force constants yields a better fit than the single molecule model that includes them. This strongly suggests that these terms, which have no clear physical origin, merely served to emulate the crystal field effects that are explicitly neglected in single molecule models. The improved fit is not due to an increase in the number of fitting parameters: more off-diagonal terms were needed for the single molecule best-fit VDOS than the number of additional intermolecular force constants for the crystal calculation. That is, a crystal calculation replaces ad hoc off-diagonal terms with fewer but physically realistic force constants and produces a better fit.
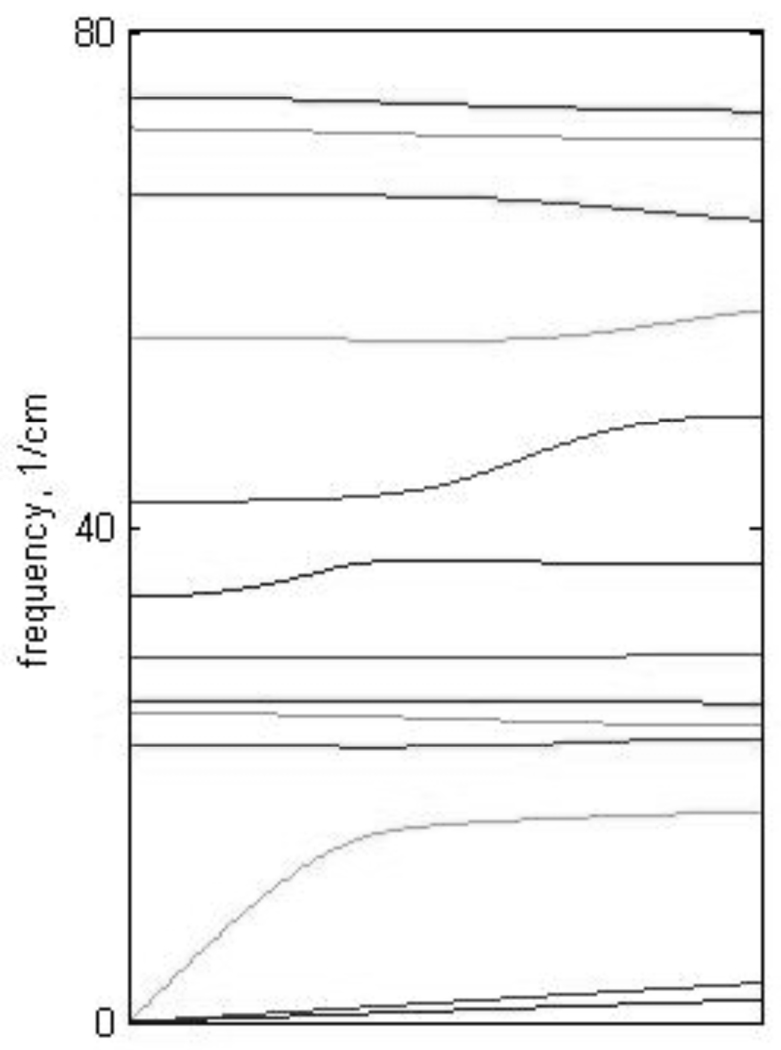
Normal mode analysis (NMA) for a crystal is done by calculating the VDOS at different points of the Brillouin zone and then calculating the total VDOS weighting each point of the zone according to the amplitude of the iron atom vibration. While in single molecule NMA each particular mode has a distinct frequency, in crystal NMA each particular mode can have slightly different frequencies at different points of the Brillouin zone (i.e. dispersion) that can result in some broadening of the VDOS. To investigate the dispersion effect, the frequency of each mode was calculated as a function of the wavevector k in any chosen direction. As can be seen from Fig. 4 only a few low frequency modes exhibit dispersion comparable to or larger than the instrumental broadening of 8 cm−1. More quantitative analysis of all modes shows that dispersion contributes little to the observed width of peaks in the Fe VDOS.
Figure 4.
(Note: final figure shows 3 panels, one for each reciprocal lattice vector.) Phonon dispersion curves for FeOEP. The three panels display the dispersion curves for modes below 80 cm−1 for the three reciprocal lattice vector directions. Note significant dispersion only for a few modes.
Crystal normal mode analysis refined to NRVS data provides not only a best-fit force field, but can also reveal elastic properties that are determined by the dispersion curves, such as the velocity of sound:
This equation allows one to find speed of sound in any chosen direction as a slope of the dispersion curve (mode frequency ω vs. wave vector k) as it approaches the origin.
The average speed of sound can be extracted directly from the measured VDOS, where the PHOENIX program for computing the VDOS from the raw data imposes the Debye limit at the very lowest frequencies:19 20
where D(E) is the density of states, mFe the mass of 57Fe nucleus, E the energy, ρ the density, and v the average velocity of sound, which can be written as
with vl and vt being the longitudinal and transverse velocities. The NRVS-determined value for FeOEP is 1204 m/s, consistent with values for similar materials.21
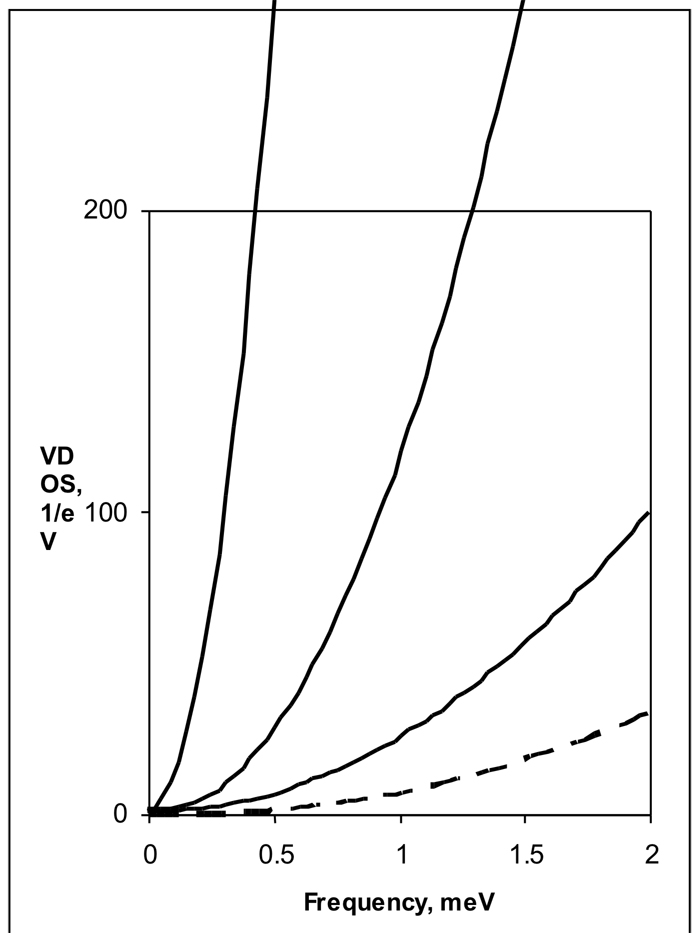
The average sound velocity in FeOEP obtained from the dispersion curves computed from the initial calculation (4 ethyl and 4 core intermolecular bonds) was only 234 m/s. Although this small number of intermolecular bonds is sufficient to get a good fit to the overall VDOS, it is lacking in the very low frequency limit. Increasing the strength of these force constants had little effect on the speed of sound, so increasing the number of intermolecular bonds was explored. It was found that while changing the number of core bonds increased only the transverse speed of sound in [001] direction, had little impact on longitudinal speeds, and significantly degraded the VDOS fit in the high frequency region. Increasing the number of ethyl-ethyl bonds from 4 to 8, however, increased the speed from 234 to 504 m/s, and 16 bonds further improved it to 843 m/s.
This phenomenological approach to matching the measured speed of sound by increasing the intermolecular couplings without impairing the fit to the overall Fe VDOS is apparently on the right track, as summarized in Fig. 5. Increasing the number of couplings does come at the expense of larger force matrices and longer computation times, but it does convergence should be readily attainable with adequate computational resources. These preliminary results point to the relative importance of the ethyl-ethyl bonds as opposed to Fe-C bonds for elastic constants, but a more physical approach, perhaps based on periodic DFT calculations, would be appropriate.
Figure 5.
Calculated sound velocity versus increasing number of ethyl-ethyl bonds. The lowest frequency VDOS from the NRVS data (dashed line) correspond to a velocity of sound of 1204 m/s. VDOS determined from calculated dispersion curves are plotted for increasing number of ethyl-ethyl bonds: 4 bonds (234 m/s), 8 bonds (504 m/s) and 16 bonds (843 m/s).
4. Conclusions
Normal mode analysis for a molecular crystal produces a better fit to the NRVS vibrational density of states for FeOEP that the usual single molecule approximation, without a significant increase in fitting parameters. A minimal set of intermolecular bonds was successful in achieving improved fits across the frequency range, but additional ethyl-ethyl couplings are needed for good agreement with the measured speed of sound. Since good fits are obtained without the use of off-diagonal coupling constants, these ad hoc terms apparently serve only to emulate the physical intermolecular couplings. The effect of dispersion on the vibrational density of states for this molecular crystal was found to be insignificant compared to the NRVS instrumental broadening except for a few low frequency bands. Calculating normal modes for refinement to the NRVS vibrational density of states from polycrystalline or crystal specimens is thus more effective with a crystal model that includes intermolecular coupling.
Acknowledgements
We thank Jianguang Guo for help with the computer program, and advice from E. W. Prohofsky. This work was supported by the National Science Foundation through the Award no. PHY-9988763, by the National Institutes of Health Grant GM-3840, and by the Purdue Research Foundation. Use of the Advanced Photon Source was supported by the US Department of Energy, Basic Energy Sciences, Office of Science, under contract no. W-31-109-Eng-38
References
- 1.Kitagawa T, Abe M, Ogoshi H. The Journal of Chemical Physics. 1978;69:4516. [Google Scholar]
- 2.Kincaid JR, Urban MW, Watanabe T, Nakamoto K. Infrared spectra of matrix-isolated metal complexes of octaethylporphine. 1983;Vol. 87:3096. [Google Scholar]
- 3.Spiro TG, editor. Resonance Raman Spectra of Heme and Metalloproteins. Vol. 3. New York: Wiley-Interscience; 1988. [Google Scholar]
- 4.Rai BK, Durbin SM, Prohofsky EW, Sage JT, Wyllie GRA, Scheidt WR, Sturhahn W. Alp, E. E. Biophys J. 2002;82:2951. doi: 10.1016/S0006-3495(02)75636-1. [DOI] [PMC free article] [PubMed] [Google Scholar]
- 5.Rai BK, Durbin SM, Prohofsky EW, Sage JT, Ellison MK, Roth A, Scheidt WR, Sturhahn W. Alp, E. E. J Am Chem Soc. 2003;125:6927. doi: 10.1021/ja028219w. [DOI] [PubMed] [Google Scholar]
- 6.Kozlowski PM, Spiro TG, Berces A, Zgierski MZ. Low-Lying Spin States of Iron(II) Porphine. 1998;Vol. 102:2603. [Google Scholar]
- 7.Jonas V, Thiel W. Journal of Chemical Physics. 1995;102:8474. [Google Scholar]
- 8.Scheidt WR, Durbin SM, Sage JT. Journal of Inorganic Biochemistry. 2005;99:60. doi: 10.1016/j.jinorgbio.2004.11.004. [DOI] [PubMed] [Google Scholar]
- 9.Budarz TE, Prohofsky EW, Durbin SM, Sjodin T, Sage JT, Sturhahn W. Alp, E. E. Determination of the Complete Set of Iron Normal Modes in the Heme Model Compound FeIII(OEP)Cl from Nuclear Resonance Vibrational Spectroscopic Data. 2003;Vol. 107:11170. [Google Scholar]
- 10.Rai BK, Durbin SM, Prohofsky EW, Sage JT, Wyllie GRA, Scheidt WR, Sturhahn W. Alp, E. E. Biophysical Journal. 2002;82:2951. doi: 10.1016/S0006-3495(02)75636-1. [DOI] [PMC free article] [PubMed] [Google Scholar]
- 11.Starovoitova V, Budarz TE, Wyllie GRA, Scheidt WR, Sturhahn W, Alp EE, Prohofsky EW, Durbin SM. Vibrational spectroscopy and normal-mode analysis of Fe(II) octaethylporphyrin. Purdue University; 2006. [DOI] [PMC free article] [PubMed] [Google Scholar]
- 12.Ghosh A, Bocian DF. Carbonyl Tilting and Bending Potential Energy Surface of Carbon Monoxyhemes. 1996;Vol. 100:6363. [Google Scholar]
- 13.Johnson MR, Trommsdorff HP. Chemical Physics Letters. 2002;364:34. [Google Scholar]
- 14.Plazanet M, Beraud A, Johnson M, Krisch M, Trommsdorff HP. Probing vibrational excitations in molecular crystals by inelastic scattering: From neutrons to X-rays. 2005 [Google Scholar]
- 15.Kearley GJ, Johnson MR, Tomkinson J. Intermolecular interactions in solid benzene. 2006 doi: 10.1063/1.2145926. [DOI] [PubMed] [Google Scholar]
- 16.Li XY, Czernuszewicz RS, Kincaid JR, Su YO, Spiro TG. Consistent porphyrin force field. 1. Normal-mode analysis for nickel porphine and nickel tetraphenylporphine from resonance Raman and infrared spectra and isotope shifts. 1990;Vol. 94:31. [Google Scholar]
- 17.Strauss SH, Silver ME, Long KM, Thompson RG, Hudgens RA, Spartalian K, Ibers JA. Journal of the American Chemical Society. 1985;107:4207. [Google Scholar]
- 18.Califano Vibrational States. London: Wiley; 1976. [Google Scholar]
- 19.Sturhahn W. Hyperfine Interactions. 2000;125:149. [Google Scholar]
- 20.Achterhold K, Keppler C, Ostermann A, van Bürck U, Sturhahn W, Alp EE, Parak FG. Physical Review E. 2002;65:051916. doi: 10.1103/PhysRevE.65.051916. [DOI] [PubMed] [Google Scholar]
- 21.Edwards C, Palmer SB, Emsley P, Helliwell JR, Glover ID, Harris GW, Moss DS. Thermal motion in protein crystals estimated using laser-generated ultrasound and Young's modulus measurements. In Acta Crystallographica Section A. 1990;Vol. 46:315. [Google Scholar]


