Abstract
This study explores how substituting a new high molecular mass oligomeric poly(ethylene glycol) extended urethane dimethacrylate (PEG-U) for 2-hydroxyethyl methacrylate (HEMA) in photo-activated urethane dimethacrylate (UDMA) resins affects degree of vinyl conversion (DC), polymerization shrinkage (PS), stress development (PSSD) and biaxial flexure strength (BFS) of their amorphous calcium phosphate (ACP) composites. The composites were prepared from four types of resins (UDMA, PEG-U, UDMA/HEMA and UDMA/PEG-U) and zirconia-hybridized ACP. Introducing PEG-U improved DC while not adversely affecting PS, PSSD and the BFS of composites. This improvement in DC is attributed to the long, more flexible structure between the vinyl groups of PEG-U and its higher molecular mass compared to poly(HEMA). The results imply that PEG-U has the potential to serve as an alternative to HEMA in dental and other biomedical applications.
Keywords: amorphous calcium phosphate, composite, urethane dimethacrylate, polymerization shrinkage stress
Introduction
Amorphous calcium phosphate (ACP)-based polymeric composites are biomimetic materials with a potential to reform damaged mineral structures of the tooth (and other mineralized tissues) by providing an extended supply of remineralizing calcium and phosphate ions [1-5]. They are easily formulated into a visible light-curable, simple-to-manipulate, and injectable composite pastes. Advantages of ACP as composite filler are its facile, single solid phase preparation, and biocompatibility similar to that of hydroxyapatite (HAP) and other other crystalline calcium phosphates. What makes ACP suitable as a potential remineralizing/anti-cariogenic agent is its high solubility/degradability in aqueous millieu relative to HAP [6].
ACP polymeric composites, however, have the certain shortcomings such as uneven dispersion of ACP filler within polymerized resin matrix [7] (caused by the uncontrolled agglomeration of ACP [8] and resulting in diminished strength and durability of these composites), and excessive polymerization shrinkage (PS; [9]) which leads to stress development (PSSD) both within the composite and at the tooth/restoration interface(s). The latter may lead to marginal leakage and bacterial ingression leading to pulpal irritation, post-restorative sensitivity and recurrent caries, which ultimately decrease the longevity of restoration. Both PS and PSSD are related to the chemical structure of matrix resin and the degree of vinyl conversion (DC) attained upon photo-polymerization.
We have previously shown that urethane dimethacrylate (UDMA) yielded, when blended with 2-hydroxyethyl methacrylate (HEMA), generally acceptable ACP composites [10]. However, there was concern about this resin formulation because of the leachability of residual HEMA and possible adverse effects of this low mass monomer on PS and PSSD. The objective of this study was to replace mono-functional HEMA with a high molecular mass oligomeric urethane dimethacrylate co-monomer (poly(ethylene glycol) extended UDMA; PEG-U) in UDMA-based resin formulations and determine the effects of on DC, PS and PSSD of ACP-filled composites. Additionally, the composites were screened for their mechanical strength [biaxial flexure strength (BFS)] in both the dry state and after exposure to an aqueous environment.
Materials and Methods
ACP synthesis and characterization
Zirconia-hybridized ACP (Zr-ACP) was synthesized as detailed earlier [3, 4]. It precipitated instantaneously in a closed system at 23 °C upon rapidly mixing equal volumes of a 800 mmol/L Ca(NO3)2 solution, a 536 mmol/L Na2HPO4 solution that contained a molar fraction of 2 % Na4P2O7 as a stabilizing component for ACP, and an appropriate volume of a 250 mmol/L ZrOCl2 solution (mole fraction of 10 % ZrOCl2 based on the calcium reactant. The suspension was filtered, the solid phase washed subsequently with ice-cold ammoniated water and acetone, and then lyophilized. To avoid exposure to humidity, ACP was kept under vacuum (2.7 kPa) until utilized in composite formulations.
The amorphous state of ACP was verified by powder X-ray diffraction (XRD; Rigaku DMAX 2000 X-ray diffractometer, Rigaku/USA Inc., Danvers, MA, USA0 and Fourier-Transform Infrared (FTIR) spectroscopy. XRD patterns were recorded from 4° to 60° 2θ with CuKα radiation (λ = 0.154 nm) at 40 kV and 40 mA. ACP sample was step-scanned in intervals of 0.010° 2θ at a scanning speed of 1.000°/min. The FTIR spectrum of Zr-ACP was recorded using a KBr pellet technique ((0.8 to 1.0) mg Zr-ACP/400 mg KBr). Morphology of the filler was examined by scanning electron microscopy (SEM; JEOL 35C microscope, JEOL Inc., Peabody, MA, USA). Particle size distribution of Zr-ACP was determined by gravitational and centrifugal sedimentation analysis (SA-CP3 analyzer, Shimadzu Scientific Instruments, Inc., Columbia, MD, USA).
Formulation of the resins
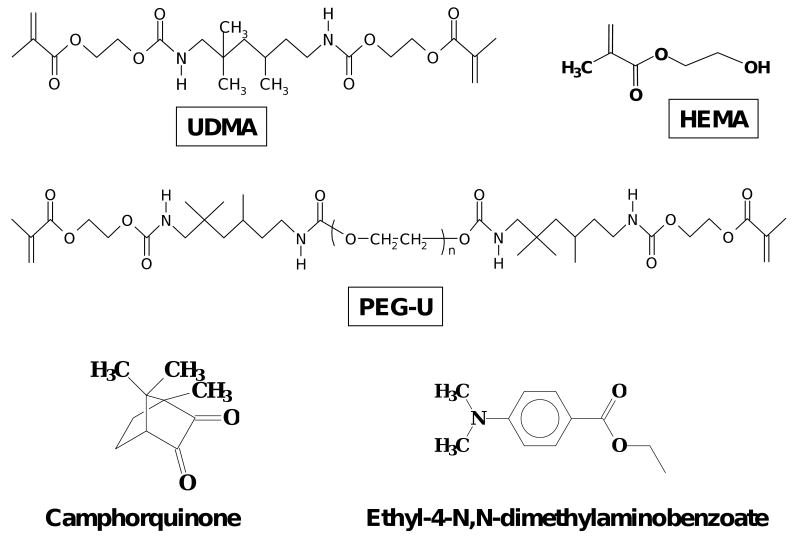
The experimental resins, photo-activated with camphorquinone and ethyl-4-N,N-dimethylaminobenzoate, were formulated from the commercially available UDMA, PEG-U and HEMA monomers. Their chemical structures are provided in Fig. 1. The list of monomers and the components of photo-initiator systems (with the corresponding acronyms that are used throughout this manuscript) and the composition of the resins (% mass fraction) are provided in Tables 1 and 2, respectively. The average molecular mass of the oligomer, PEG-U, was determined by MALDI time of flight mass spectrometry [Bruker Daltonics Reflux II, Billerica, MA, USA] as previously described [10, 11].
Fig. 1.
Chemical structure of the monomers and photo-initiator system employed in the study.
Table 1.
Monomers and components of the photoinitiator systems.
| Chemical name | Acronym |
|---|---|
| Urethane dimethacrylate (Mw = 470) | UDMA |
| Poly(ethylene glycol) extended UDMA (Mw = 1414) | PEG-U |
| 2-hydroxyethyl methacrylate | HEMA |
| Camphorquinone | CQ |
| Ethyl-(4-N,N-dimethylaminobenzoate) | 4EDMAB |
Table 2.
Composition (mass fraction, %) of experimental resins employed in the study.
| Resin/monomer | UDMA | PEG-U | HEMA | CQ | 4EDMAB |
|---|---|---|---|---|---|
| UDMA | 99.00 | - | - | 0.20 | 0.80 |
| PEG-U | - | 99.0 | - | 0.20 | 0.80 |
| UDMA/PEG-U | 74.25 | 24.75 | - | 0.20 | 0.80 |
| UDMA/HEMA | 92.00 | - | 7.00* | 0.20 | 0.80 |
Based on the equivalent molar concentration of UDMA monomer.
Preparation of ACP composite specimens
Composite pastes were made by mixing the resins (mass fraction 60 %) with Zr-ACP filler (mass fraction 40 %) using hand spatulation. The homogenized pastes were kept under a moderate vacuum (2.7 kPa) overnight to eliminate the air entrained during mixing. The pastes were molded into disks (14.9 mm to 15.3 mm in diameter and 1.31 mm to 1.53 mm in thickness) by filling the circular openings of flat Teflon molds, covering each side of the mold with a Mylar film plus a glass slide, and then clamping the assembly together with spring clips. The disks were photo-polymerized by irradiating sequentially each face of the mold assembly for 60 s with visible light (Triad 2000).
Physicochemical testing of composites
Degree of vinyl conversion, DC, attained in four groups of experimental ACP composites was determined by near-infrared (NIR) spectroscopy [12]. NIR spectra (three specimens/group) were acquired before photo-cure, immediately after and 24 h post-cure. Use of an internal reference was not required, provided that the thickness of uncured (monomer) and cured (polymer) specimens have been measured. DC was calculated from the decrease in the integrated peak area/sample thickness values of the 6165 cm-1 methacrylate=CH2 absorption band between the polymer and monomer. Triplicate measurements were performed for each experimental group.
The polymerization shrinkage, PS, of composites was measured by a computer-controlled mercury dilatometer [13] (designed and manufactured at the Paffenbarger Research Center (PRC), American Dental Association Foundation (ADAF), Gaithersburg, MD, USA; Fig. 2). Composite pastes ((100 ± 10) mg) were irradiated twice: initially for 60 s followed by a second irradiation for 30 s after 60 min. Data were collected for a total of 90 min. Three replicate measurements were performed for each experimental group. The PS was calculated based on the known mass of the sample and its density. The latter was determined by means of the Archimedean displacement principle using an attachment to a microbalance (Sartorius YDK01 Density Determination Kit, Sartorius AG, Goettingen, Germany).
Fig. 2.
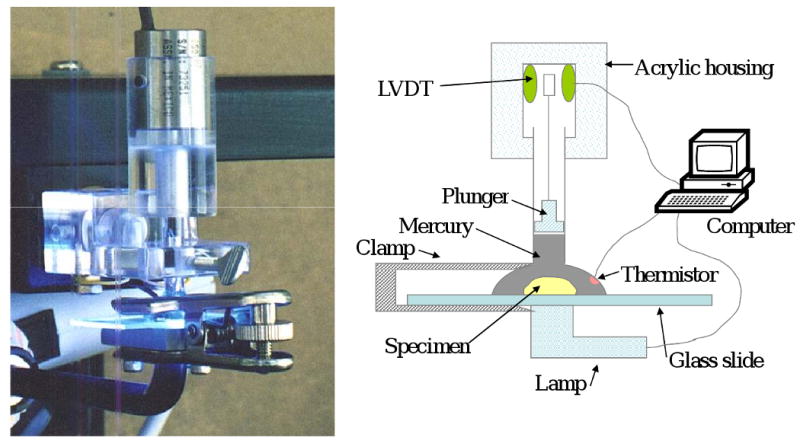
Computer-controlled mercury dilatometer utilized for measuring the polymerization shrinkage, PS, of composites.
The polymerization shrinkage stress development, PSSD, was quantified by utilizing a computer-interfaced tensometer ([14]; Fig. 3) developed at PRC-ADAF, Gaithersburg, MD, USA. The deflection of the cantilever beam was measured with a linear variable differential transformer. The tensile force was calculated from a beam length (12.5 cm) and a calibration constant (3.9 N/μm). PSSD was obtained by dividing the measured tensile force with the cross sectional area of the sample. Triplicate measurements were made for each experimental group.
Fig. 3.
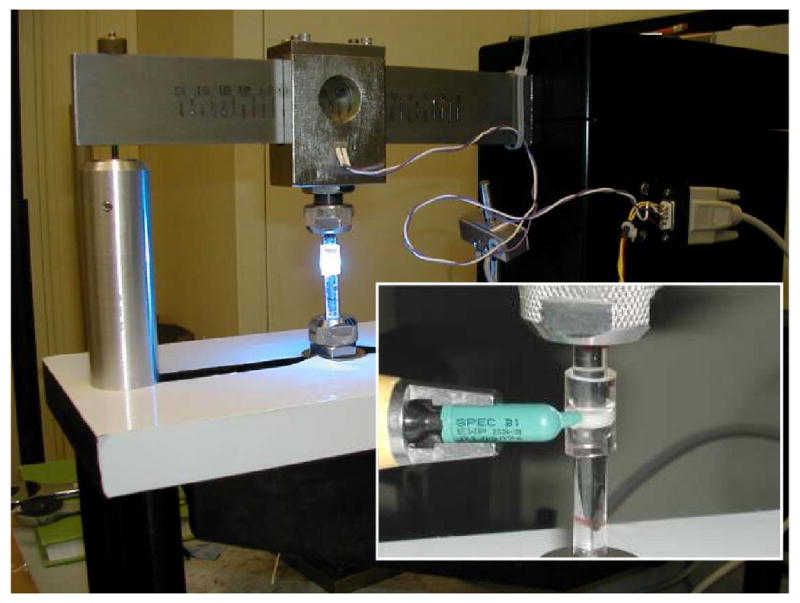
Computer-interfaced tensometer used to determine polymerization shrinkage stress development, PSSD.
Biaxial flexure strength, BFS, testing was employed to compare the mechanical strength of dry (after 24 h storage in the air at 23 °C) and wet (after 1 mo immersion in HEPES-buffered saline solution (0.13 mol/L NaCl; pH = 7.4) at 23 °C; 100 mL saline solution/specimen) composite specimens. Piston-on-three-ball loading cell (Fig. 4) and a computer-controlled Universal Testing Machine (Instron 5500R, Instron Corp., Canton, MA, USA) operated by Testworks 4 software were utilized. BFS values were calculated according ASTM F394-78 [15]. The measurement of the strength of brittle dental materials under bi-axial flexure conditions rather than uni-axial flexure is considered more reliable, because the maximum tensile stresses occur within the central loading area and spurious edge failures are eliminated. This allows slightly warped specimens to be tested and produces results unaffected by the edge conditions of the specimen [16]. A minimum of four samples were tested for each experimental group.
Fig. 4.
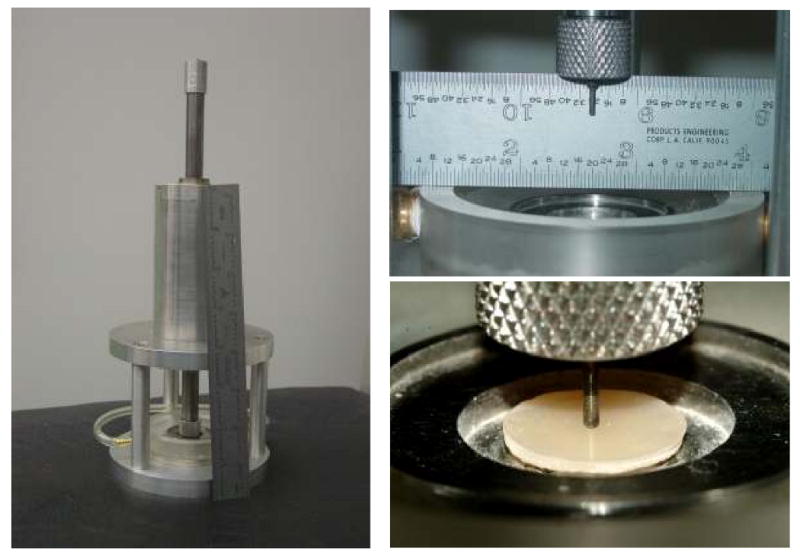
Piston-on-three-ball loading cell employed to determine biaxial flexure strength, BFS, of composite specimens.
Flexural strength (FS) and modulus (E) of the unfilled UDMA, UDMA/PEG-U and UDMA/HEMA polymer specimens 2 mm × 2 mm × 25 mm, photopolymerized as described for the ACP composite specimens (number of specimens n= 8/experimental group), were determined using a 3-point flexural test (specimen span = 20 mm) at a crosshead speed of 5.0 mm/min on the computer-controlled Universal Testing Machine.
Modulus of elasticity (E) of the specimens was calculated by dividing the tensile stress (σ) by the tensile strain (ε) (equation (1)):
| (1) |
In Eq. 1, F is the force applied to the object, L0 is the original length of the object, A0 is the original cross-sectional area through which the force was applied and ΔL is the amount by which the length of the object changed. Values of F and ΔL were obtained from FS measurements.
Statistical data analysis
One standard deviation (SD) is identified in this paper for comparative purposes as the estimated standard uncertainty of the measurements. These values should not be compared with data obtained in other laboratories under different conditions. Experimental data were analyzed by ANOVA (α = 0.05). Significant differences between the groups were determined by all pair-wise multiple comparisons (two tail t-test; unequal variances).
Results
Zr-ACP employed in this study showed the typical features of amorphous calcium phosphate solid with two wide phosphate absorbance bands at (1200-900) cm-1 and (630-550) cm-1 in its FTIR spectrum (Fig. 5) and two diffuse broad bands in 2θ = (4-60)° region of its XRD spectrum (Fig. 5; inset). The filler had heterogeneous particle sizes ranging in diameter from submicron up to approx. (80-100) μm, as clearly seen from both the SEM image of the filler (Fig. 6) and the size distribution histogram (Fig. 6; inset). Calculated median diameter of the powder was (5.9 ±0.7) μm.
Fig. 5.
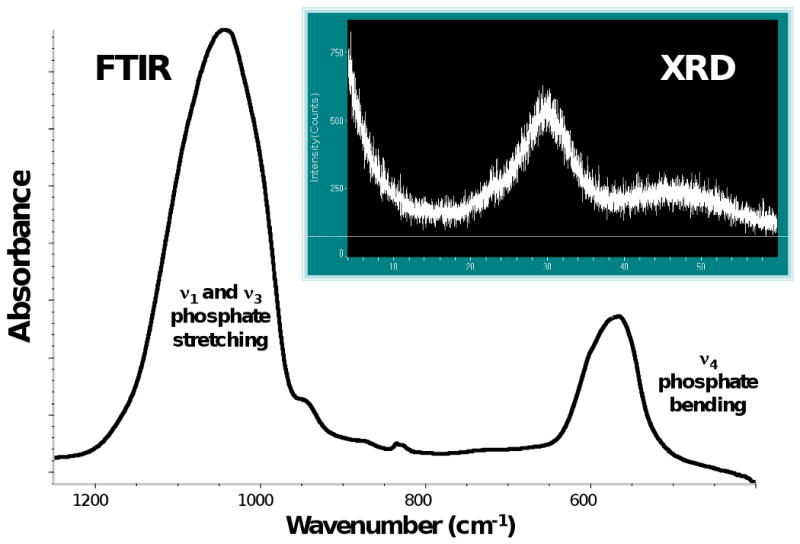
FTIR spectrum and XRD pattern (inset) of Zr-ACP used in the study.
Fig. 6.
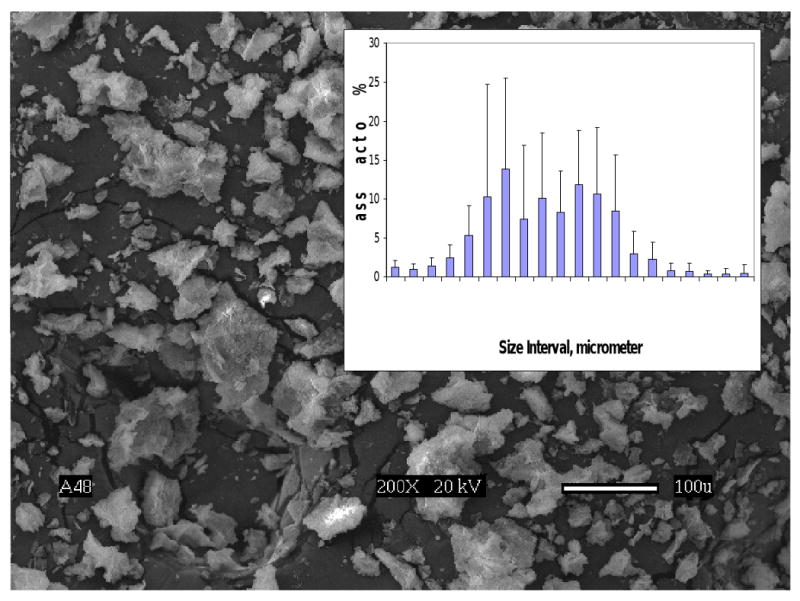
Scanning electron microphotograph and the particle size distribution (inset) of Zr-ACP used in the study.
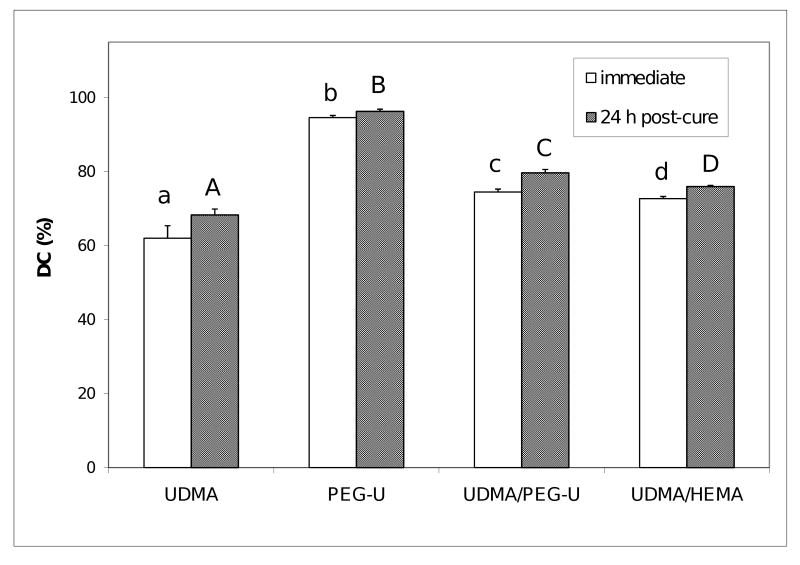
The DC of composites attained immediately after photo-cure and 24 h post-cure, shown in Fig. 7., revealed the following order of decreasing DC values as a function of resin composition: PEG-U ≫ UDMA/PEG-U > UDMA/HEMA > UDMA. Post curing had only a minimal effect (supplementary 1.8 %) on DC of PEG-U composites contrary to UDMA composites which showed additional 10.2 % of double bonds conversion. In binary matrices, DC increases with post-curing were 4.5 % and 7.0 % for UDMA/HEMA and UDMA/PEG-U composites, respectively.
Fig. 7.
Degree of vinyl conversion (DC; mean value + SD), attained in composites immediately after photo-cure and 24 h post-cure. Number of specimens n≥ 4. Different letters indicate significantly different values (p < 0.05).
As revealed in Fig. 8, the level of PS was approx. 20 % higher in UDMA and PEG-U composites (5.3 vol % and 5.1 vol %, respectively) compared to the PS measured in binary UDMA/PEG-U and UDMA/HEMA composites (4.4 vol % and 4.2 vol %, respectively).
Fig. 8.
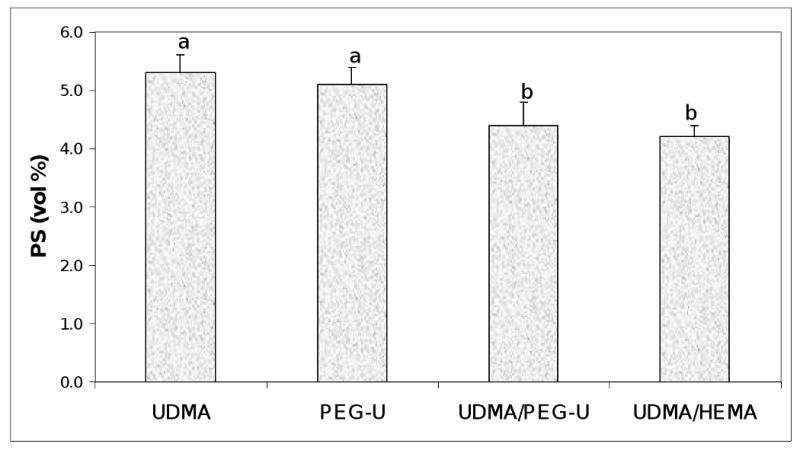
Polymerization shrinkage, PS, of the composites. Indicated are mean values + standard deviation (SD) in each group. Number of specimens n=3. Different letters indicate significantly different values (p < 0.05).
The PSSD data (Fig. 9) showed no difference between the UDMA, PEG-U and UDMA/PEG-U composites (mean PSSD values = (3.3 to 3.4) MPa). However, stress developed in UDMA/HEMA composites was approx. 33 % higher ((4.5 ± 0.1) MPa).
Fig. 9.
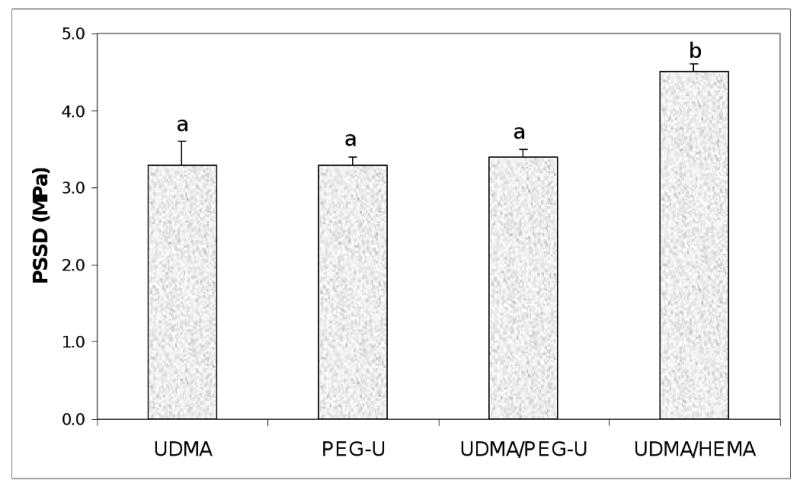
Shrinkage stress (mean value + SD) developed in composite specimens upon photo-polymerization. Number of specimens n=3. Different letters indicate significantly different values (p < 0.05).
The results of the BFS testing of dry (before immersion) and wet (after 1 mo immersion in saline) composite specimens are summarized in Fig. 10. The BFS of dry UDMA, UDMA/PEG-U and UDMA/HEMA composites (average values between (62.1 ± 12.9) MPa and (68.0 ± 8.1) MPa) were significantly higher than the BFS of dry PEG-U composites ((39.2 ± 5.3) MPa). Upon aqueous immersion, the BFS of all composites was reduced between 25 % and 45 % compared to the corresponding dry specimens, resulting in the following order of the decreasing BFS of wet specimens: UDMA ((46.9 ± 6.6) MPa) > {UDMA/HEMA ((38.5 ± 7.5) MPa), UDMA/PEG-U ((34.4 ± 5.2) MPa)} > PEG-U ((29.3 ± 1.1) MPa).
Fig. 10.
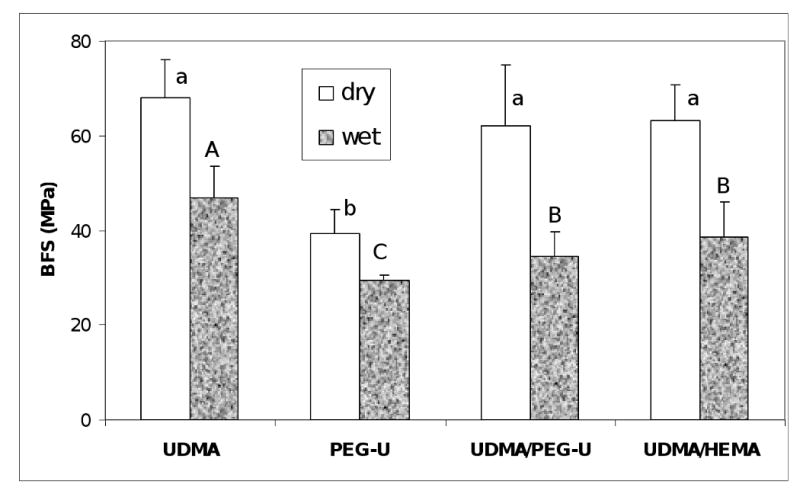
Biaxial flexure strength (BFS; mean value + SD) of dry and wet (after 1 mo immersion in saline solution) composite specimens. Number of specimens n=3. Different letters indicate significantly different values (p < 0.05).
Flexural strength (FS) and modulus (E) of the unfilled UDMA, UDMA/PEG-U and UDMA/HEMA specimens are summarized in Table 3. The higher FS of UDMA/HEMA copolymers (113 MPa) compared to UDMA/PEG-U (104 MPa) and UDMA (98 MPa) specimens was not statistically significant. However, the mean E value attained in UDMA/HEMA copolymers (2.43 GPa) was significantly higher than the mean E values attained in UDMA/PEG-U copolymers (1.90 GPa) and UDMA homopolymers (1.88 GPa) (p value ≤ 0.003).
Table 3.
FS and E values (mean ± standard deviation) of the unfilled UDMA, UDMA/PEG-U and UDMA/HEMA specimens. Number of specimens tested n=8/group.
| Resin formulation | FS (MPa) | E (GPa) |
|---|---|---|
| UDMA | 98.3 ± 5.7 | 1.88 ± 0.21 |
| UDMA/PEG-U | 104.5 ± 15.5 | 1.90 ± 0.31 |
| UDMA/HEMA | 113.1 ± 7.4 | 2.43 ± 0.28 |
Discussion
As DC results show (Fig. 7), introducing the PEG-U into resin formulation is desirable in order to attain the high DC, and presumably, maintain high biocompatibility of the material. These enhanced DC values obtained in PEG-U containing matrices are attributed to the long and flexible structure between the vinyl groups of PEG-U oligomer. It should be noticed that UDMA/HEMA composites also achieved higher DC compared to the unblended UDMA formulation. The reasons for this DC enhancement is most likely due to the co-polymerization of mono-functional HEMA with UDMA taking place without contributing pendant vinyl groups as can occur with bi-functional co-monomers.
The PS of UDMA and PEG-U Zr-ACP composites was higher than the level of shrinkage of UDMA/PEG-U or UDMA/HEMA specimens (Fig. 8) but for different reasons. UDMA has a lower relative molecular mass than the PEG-U (430 vs. 1414, respectively; Table 1) and also had much lower DC (68.3 % at 24 h post-cure) than PEG-U (96.3 % at 24 h post-cure). PS is indirectly related to relative molecular mass and directly related to DC. Significantly, there were no differences in the PSSD in UDMA, PEG-U and UDMA/PEG-U composites while higher PSSD was observed in UDMA/HEMA composites (Fig. 9). The higher DC obtained in UDMA/PEG-U specimens would imply that this material would also have higher PSSD. However, the measured PSSD in UDMA/PEG-U composites was lower. This phenomenon could possibly be related to the higher relative molecular mass and the more flexible character of PEG-U oligomer (due to a significant number of ethylene oxide units in its molecular structure) compared to less flexible poly(HEMA) segments in the matrix. UDMA/HEMA copolymer would be expected to have a higher modulus than the UDMA/PEG-U copolymer not only because of the additional physical cross-linking provided by hydrogen bond formation but also because of the expected higher glass transition temperature, Tg, of UDMA/HEMA vs. UDMA/PEG-U. (Tg of the homo-polymer of HEMA is 55 °C whereas that of poly(ethylene oxide) is − 67 °C). Comparative modulus data of these UDMA copolymers (Table 3) confirmed this assumption (the mean E of UDMA/HEMA specimens was 28 % higher than the E of UDMA/PEG-U copolymers).
The mechanical strength (i.e. BFS) of wet composites was, generally, lower than the BFS of corresponding dry specimens (Fig. 10). It is, however, important that there was no statistical difference between the UDMA/HEMA and UDMA/PEG-U binary resin composites. The most likely factors that are resin- formulation-independent, and that may have contributed to this reduction in strength of wet ACP composites are: a) excessive water sorption facilitated by the uneven dispersion of large ACP agglomerates throughout the composite, and b) inflexibility of the ACP/resin matrix interface originating from spatial changes that may have occurred during water-catalyzed ACP conversion to apatite, which inevitably took place once ACP composites were exposed to aqueous medium. ACP that is of finer size, less agglomerated and more homogeneously dispersed in the resin matrix, even without the reinforcing effect of an interfacial coupling agent, would be expected to improve the mechanical properties of ACP composites [8]. The presence of large, weak ACP agglomerates (Fig. 6) invites voids and flaws [7] that lead to poorer mechanical properties of the composites.
Conclusions
Inclusion of poly(ethylene glycol)-extended UDMA oligomer into UDMA based resins improves vinyl conversion and has no adverse effect on polymerization shrinkage, stress development and mechanical stability of UDMA based ACP composites. Lesser polymerization stress of UDMA/PEG-U ACP formulations, while maintaining high levels of vinyl conversion and the expected high biocompatibility, may lead to better clinical performance of such materials.
Acknowledgments
Reported work was supported by the National Institute of Dental and Craniofacial Research (NIST-NIDCR Interagency Agreement Y1-DE-7006 and grant 13169 to the American Dental Association Foundation). It is a part of the dental material research program supported by FDA, NIST and ADAF. Generous contribution of UDMA, PEG-U and HEMA monomers from Esstech, Essington, PA, USA, is gratefully acknowledged. The authors also acknowledge technical assistance of Ms. T.B. Icenogle, Mr. J.N.R. O'Donnel, Mr. A.A. Giuseppetti and Mr. D.W. Liu, and the valuable contribution of Mr. G.D. Quinn in modulus calculations and helpful discussions.
Footnotes
Publisher's Disclaimer: Disclaimer. Certain commercial materials and equipment are identified in this article to specify the experimental procedure. In no instance does such identification imply recommendation or endorsement by the Food and Drug Administration, the National Institute of Standards and Technology or the American Dental Association Foundation or that the material or equipment identified is necessarily the best available for the purpose.
Official contribution of the National Institute of Standards and Technology and the Food and Drug Administration; not subject to copyright in the United States
References
- 1.Skrtic D, Hailer AW, Takagi S, Antonucci JM, Eanes ED. Quantitative Assessment of the Efficacy of Amorphous Calcium Phosphate/Methacrylate Composites in Remineralizing Caries-like Lesions Artificially Produced in Bovine Enamel. J Dent Res. 1996;75(9):1679–1686. doi: 10.1177/00220345960750091001. [DOI] [PubMed] [Google Scholar]
- 2.Skrtic D, Antonucci JM, Eanes ED, Eichmiller FC, Schumacher GE. Physicochemical Evaluation of Bioactive Polymeric Composites Based on Hybrid Amorphous Calcium Phosphates. J Biomed Mat Res (Appl Biomater) 2000;53:381–391. doi: 10.1002/1097-4636(2000)53:4<381::aid-jbm12>3.0.co;2-h. [DOI] [PubMed] [Google Scholar]
- 3.Skrtic D, Antonucci JM, Eanes ED. Amorphous Calcium Phosphate-Based Bioactive Polymeric Composites for Mineralized Tissue Regeneration. J Res Natl Inst Stands Technol. 2003;108(3):167–182. doi: 10.6028/jres.108.017. [DOI] [PMC free article] [PubMed] [Google Scholar]
- 4.Antonucci JM, Skrtic D. Polymers for dental and orthopedic applications. Taylor and Francis group LLC; Boca Raton, FL: 2007. Physicochemical Properties of Bioactive Polymeric Composites: Effects of Resin Matrix and the Type of Amorphous Calcium Phosphate Filler; pp. 217–242. [Google Scholar]
- 5.Skrtic D, Antonucci JM. Dental Composites Based on Amorphous Calcium Phosphate - Resin Composition/Physicochemical Properties Study. J Biomat Appl. 2007;21:375–393. doi: 10.1177/0885328206064823. [DOI] [PMC free article] [PubMed] [Google Scholar]
- 6.Eanes ED. Octacalcium Phosphate. Karger; Basel: 2001. Amorphous Calcium Phosphate; pp. 130–147. [Google Scholar]
- 7.Skrtic D, Antonucci JM, Eanes ED, Eidelman N. Dental Composites Based on Hybrid and Surface-Modified Amorphous Calcium Phosphates – A FTIR Microspectroscopic Study. Biomaterials. 2004;25:1141–1150. doi: 10.1016/j.biomaterials.2003.08.001. [DOI] [PubMed] [Google Scholar]
- 8.Lee SY, Regnault WF, Antonucci JM, Skrtic D. Effect of Particle Size of an Amorphous Calcium Phosphate Filler on the Mechanical Strength and Ion Release of Polymeric Composites. J Biomed Mater Res. 2007;80B:11–17. doi: 10.1002/jbm.b.30561. [DOI] [PMC free article] [PubMed] [Google Scholar]
- 9.Skrtic D, Stansbury JW, Antonucci JM. Volumetric Contraction and Methacrylate Conversion in Photo-Polymerized Amorphous Calcium Phosphate/Methacrylate Composites. Biomaterials. 2003;24:2443–2449. doi: 10.1016/s0142-9612(02)00574-4. [DOI] [PubMed] [Google Scholar]
- 10.Regnault WF, Icenogle TB, Antonucci JM, Skrtic D. Amorphous Calcium Phosphate/Urethane Methacrylate Resin Composites. I. Physicochemical Characterization. J Mater Sci: Mater Med. 2008;19(2):507–515. doi: 10.1007/s10856-007-3178-3. [DOI] [PMC free article] [PubMed] [Google Scholar]
- 11.Farahani M, Wallace WE, Antonucci JM, Guttman CM. Analysis by Mass Spectrometry of the Hydrolysis/Condensation Reaction of a Trialkoxysilane in Various Dental Monomer Solutions. J Appl Polym Sci. 2006;99(4):1842–1847. [Google Scholar]
- 12.Stansbury JW, Dickens SH. Determination of Double Bond Conversion in Dental Resins by Near Infrared Spectroscopy. Dent Mater. 2001;17:71–79. doi: 10.1016/s0109-5641(00)00062-2. [DOI] [PubMed] [Google Scholar]
- 13.Reed B, Dickens B, Dickens S, Perry E. Volumetric Contraction Measured by a Computer-Controlled Mercury Dilatometer. J Dent Res. 1996;75:290. [Google Scholar]
- 14.Lu H, Stansbury JW, Dickens SH, Eichmiller FC, Bowman CN. Probing the Origins and Control of Shrinkage Stress in Dental Resin-Composites: I. Shrinkage Stress Characterization Technique. J Mater Sci: Mater Med. 2004;15:1097–1103. doi: 10.1023/B:JMSM.0000046391.07274.e6. [DOI] [PubMed] [Google Scholar]
- 15.ASTM F394-78. Standard test method for biaxial strength (modulus of rupture) of ceramic substrates. 1996. re-approved. [Google Scholar]
- 16.Ban S, Anusavice KJ. Influence of test method on failure stress of brittle dental materials. J Dent Res. 1990;69(12):1791–1799. doi: 10.1177/00220345900690120201. [DOI] [PubMed] [Google Scholar]


