

Abstract
We developed and tested the feasibility of a behavioral intervention that utilizes clinic and home visitations to reduce overweight in preschool children above the 95th BMI percentile. Five families of preschool children ages 2 to 5 years with a BMI above the 95th percentile and one overweight parent were enrolled in a 24-week behavioral weight management program. Phase I, Intensive Treatment included 12 weekly sessions, alternating group-based clinic sessions and home settings. Phase II, Maintenance included 6 bi-weekly sessions alternating between the clinic and home setting. Treatment focused on teaching parents to use behavioral child management strategies to systematically implement dietary changes across beverages and snacks, meals, and to increase physical activity. Home visits focused on modifying the home food environment and in vivo use of child behavior management skills. Treatment targeted either weight maintenance or a small weight loss. Outcome measures were obtained at baseline (week 0), end of treatment (week 24), and at 6 month follow up after treatment ended (week 52). Three participants completed 24 weeks of treatment and were compared to two participants who did not complete treatment. Treatment completers showed reductions in zBMI and percent overweight while two noncompleting families increased their percent overweight and maintained their zBMI at 6 month follow up. These results suggest initial support for development of a behavior-based weight management intervention for obese preschool children and their families. Intervention targets appear to be enhanced by the inclusion of home visitations, in which food environments are changed to facilitate treatment goals.
Keywords: Preschool, obesity, home visits, intervention
Introduction
The prevalence of obesity in preschool children has continued to increase at an alarming rate over the past 30 years (Ogden et al., 1997). Contrary to parental beliefs that preschoolers will outgrow their “baby fat”(Jain et al., 2001), longitudinal studies indicate preschool children who are above the 95th percentile for BMI (weight in kilograms/height in meters squared) anytime between the ages of 2 and 5 years of age are five times as likely to be obese by age 12 compared to preschoolers who never exceeded the 85th BMI percentile (Nader et al., 2006). The identification of associated health risks within pediatric obesity have emerged and adult disorders are being linked to children and adolescents, including cardiovascular risk factors (Davis, Dawson, Riley, & Lauer, 2001), type 2 diabetes (Pinhas-Hamiel et al., 1996), and sleep apnea (Marcus et al., 1996). While obesity related comorbidities have rarely been documented in obese preschoolers, preschool children above the 95th BMI percentile have been found to have elevated blood pressure (He, Ding, Fong, & Karlberg, 2000) and to be significantly more likely to have asthma at age 7 years (Mannino et al., 2006). Thus, evidence is accumulating that children who are obese during the preschool years are more likely to remain obese at older ages and to experience health risks associated with obesity.
Most obesity related research with preschoolers focus on obesity prevention. While prevention programs are important from a public health standpoint, the focus on prevention does not address the significant number of preschool children who are already obese. The most recent NHANES data show the prevalence of obesity in preschool children is 13.9%, based on the CDC’s classification of obesity defined as being at or above the 95th percentile for BMI (Kuczmarski et al., 2000). This is a significant increase from 5% during the period from 1971-1980 and even the 10.4% prevalence reported for 2000. Despite this significant increase in the prevalence of preschool obesity there are only two treatment studies in the literature for preschool children who were obese. One, by Epstein and colleagues (Epstein, Valoski, Koeske, & Wing, 1986), was conducted over 20 years ago and examined the efficacy of a family-based behavioral program and the other was an intervention study conducted with preschool children in Singapore (Ray, Lim, & Ling, 1994).
Given the paucity of studies with this population, the growing prevalence of obesity among preshoolers, and the recent data demonstrating long term risk of remaining obese, we set out to design an intervention for preschoolers and their parents. We utilized a family based model that focused on reducing high calorie, low nutrient foods, developed from a behavioral family based framework that has been found to be effective with school age children who are overweight and obese (Epstein, Paluch, Roemmich, & Beecher, 2007). However, we also designed the treatment program to specifically address behaviors that are unique to preschool children. Developmentally, preschool children are highly neophobic and resist trying new foods. Neophobia is a potential barrier to acceptance of healthy food alternatives such as fruits and vegetables. Research has shown that parents will typically only present a rejected food 3 to 5 times before deciding their child does not like the food verses the 10 to 15 exposures necessary to overcome food rejection by young children (Sullivan & Birch, 1990). Thus, teaching parents to repeatedly present a rejected food may be a necessary component of an effective treatment. Likewise, research has found that persistent tantrums for food at age 3 have been found to predict obesity at age 5 years (Agras, Hammer, McNicholas, & Kraemer, 2004), thus specifically targeting behavioral child management strategies for tantrums around food may be a unique but important skill for parents of preschool age children. Finally, because parents and other caregivers are the sole gatekeepers of all food for preschool age children, changing the home food environment may be especially effective in modifying the diet of preschool age children. While most obesity treatments are conducted in a clinic setting, the above factors lead us to speculate that didactic clinic based treatment alone may not be sufficient to build the skills necessary for parents to change their home environment or their response to child behaviors of neophobia or tantrums for food. Drawing upon the larger child treatment literature, we added a home visit component in which concepts and skills taught in clinic session could be reviewed and practiced with the families in their home environment. In a recent study of prevention of conduct problems in preschool children whose older sibling had been adjudicated, a clinic plus home based intervention was found superior to a no treatment control in decreasing negative parenting behaviors, increasing parental stimulations of learning in their preschool child, and increasing child social competency (Brotman et al., 2003). It was postulated that the home intervention supplemented the clinic visits by assisting parents in implementing the clinic based recommendations in the home through behavioral rehearsal of the parenting skills. Of note, all families in this trial were low income and were highly satisfied with the program. In addition to changing parenting behaviors, home visits have also been found to be effective in teaching parents to modify the home environment to reduce the exposure of children with asthma to allergens (Morgan et al., 2004).
The purpose of the present study is to develop and pilot test a family-based behavioral intervention that utilizes both clinic and home visits to modifying the diet and physical activity patterns of obese preschool children. We hypothesized that a behavioral parenting intervention, augmented with home visits, could be developed that effectively changes the weight trajectory as measured by BMI z score of children ages 2 to 5 years who meet the criteria for obesity as defined by the CDC as ≥ 95th percentile BMI for age and gender (Kuczmarski et al., 2000). Additionally, we hypothesized that overweight parents would also show a reduction in their percent overweight.
Research Methods and Procedures
Participants
Participants were 5 preschool children between the ages of 2 and 5 years (M = 4.2; SD: 1.1). All of the children met the CDC criteria for obesity (i.e., BMI for gender and age ≥ 95th percentile) (Kuczmarski et al., 2000) but were not more than 100% above their median BMI for sex and age. Additionally, participating children met inclusion criteria by having medical clearance from a physician to participate (child only) and at least one overweight caregiver (i.e., BMI > 25.0)(“Clinical Guidelines on the Identification, Evaluation, and Treatment of Overweight and Obesity in Adults--The Evidence Report. National Institutes of Health,” 1998). Participants were excluded if they met any of the of the following criteria: (a) reported physical contraindications, (b) non English-speaking, (c) a disability or illness that would preclude them from engaging in at least moderate intensity physical activity, (d) a medical conditions known to promote obesity (e.g., Prader-Willi syndrome), (e) already involved with another weight control program, or (f) taking weight-affecting medications (e.g., methylphenidate). The study was approved by the institutional review board for human subjects at the investigators’ institution.
Recruitment
A systematic chart review of preschool aged (2-5 years) children was conducted at a large pediatric practice in the Midwest. One hundred and fifty-eight children were identified as meeting initial inclusion criteria of being ≥ 95th percentile BMI for age and gender at their last well child visit. Of these 32 were randomly selected and sent an invitation from the pediatric practice to learn more about the study. This invitation also included a “Do Not Contact” postcard that could be mailed back to prevent future contact. Participants willing to receive further contact were screened by study personnel by phone 10 days later and a home visit was scheduled to obtain informed consent, and complete baseline measures for those families who met inclusion criteria and agreed to participate. Participants were compensated with $50 for travel to primary assessment visits which occurred at baseline, end of treatment, and a 6 month follow up.
Intervention
Learning about Activity and Understanding Nutrition for better Child Health (LAUNCH)
LAUNCH was designed to produce small decreases or stabilize the rate of children’s weight gain to allow for a gradual decline in percent overweight as the children grow in height in line with current recommendations for treatment of preschool obesity (Barlow, 2007; Gidding et al., 2006). The program emphasized establishing quality nutrition for preschoolers by increasing consumption of fruits and vegetables, decreasing high fat foods and eating out, limiting and/or eliminating sweet beverages, teaching portion sizes for preschoolers, and increasing physical activity via parent training on child behavior management techniques and environmental stimulus control. The 24-week intervention consisted of two phases: Phase I Intensive Intervention was 12 weekly sessions that alternated between group-based clinic sessions and individual home visits, and Phase II Maintenance was 12 weeks of every other week sessions, again alternating between group sessions in clinic and individual home sessions.
Parent Group
The clinic sessions included three components: 1) Dietary education with age specific, healthy eating patterns introduced systematically across beverages and snacks, followed by breakfast and lunch, and finally targeting dinner. Parents were taught to use stimulus control strategies of not having high fat foods in the home as the best step to decrease child consumption of these foods and to prevent and/or minimize tantrums for foods. Parents were instructed to offer fruits and vegetables at snack and to present small amounts of these foods repeatedly across snack opportunities. In this context parents were taught to ignore tantrums for other foods and food refusals. They were taught to praise children for tasting new foods, especially vegetables. Parents were asked to allow their child to spit out a food if they did not want to swallow it, but give minimal attention to this and to focus their praise on the child tasting the food. Families were taught how to accurately weigh and measure foods and kept a 7 day food record during Phase I; 2) Physical Activity education with age specific activities for children and families were provided and gradually increased to target children achieving 60 minutes of moderate and 30 minutes vigorous activity daily, or twice their baseline level, and to decrease screen viewing to ≤ 2 hours per day; 3) Parenting skills to achieve the diet and physical activity goals emphasized differential attention, contingency management, limit setting and time out, use of shaping and exposure to introduce new foods, and implementing stimulus control measures for eating and activity. These skills were taught or reviewed at each session.
The home sessions were structured to support generalization of the clinic-taught skills to the home environment through instruction, modeling and rehearsal of dietary, physical activity, parenting and stimulus control techniques. After the clinic session on snacks, beverages, and stimulus control, the home visit focused on a walkthrough of the home food environment and identification of low-nutrient, energy dense snack foods and beverages. These foods and beverages were then placed in a box and study staff reviewed specific nutrition information for the selected foods with each parent. Parents were then given an opportunity to remove from the home (by throwing the food/drink away) or to place the food back in the home. For foods parents did not feel they could throw away they were encouraged to refrain from purchasing them in the future. Parents were also observed offering snacks to their child. Parents were coached to offer two acceptable snack choices, such as two fruits or a fruit and a vegetable, and to use ignoring to manage requests or tantrums for different foods and to praise for the child choosing a healthy snack.
Phase II focused on identifying and solving barriers to maintaining new eating habits and daily physical activity for parents and children. For instance, families reduced the effort to maintain diet diaries by making lists of commonly consumed foods with portions and calorie estimates that could be added very quickly at the end of the day. Additionally, long term planning for eating and activity changes and parenting skills were discussed in order to maintain changes in diet and activity. Keeping of food records was reduced from 7 to 3 days per each week in Phase II.
Child Group
While parents were the primary implementers of the intervention, children were seen in a group format during clinic sessions and given education about healthy foods and provided behavioral opportunities to try new foods and various physical activities that could be done inside as well as outside a home. While children were provided education about healthy eating, there were no specific discussions regarding weight. Children were given sticker charts where their parents could award stickers whenever the child tried or ate a vegetable or fruit. The parent group was conducted by a licensed clinical psychologist and child groups and home visits were conducted by a pediatric psychology postdoctoral fellow.
Measures
Demographics
Family demographic information including parent age, occupation, income, and information related to socioeconomic status was collected in order to derive a total SES score based on the Hollingshead 4 factor index of social status (Hollingshead, 1975).
Anthropometrics
Child and parent weight and height at baseline, end of treatment (6 month), and 6 month follow up (12 month) were measured with standard anthropometric procedures (Lohman, Roche, & Martorell, 1988) by registered dieticians from the General Clinical Research Center (GCRC) not involved in treatment implementation. Children were weighed in under clothing and a paper gown without shoes; parents were weighed in light clothing without shoes. Participants were weighed in triplicate using a digital Scaletronix scale (Wheaton, IL). Heights were measured in triplicate using a Holtain stadiometer (Holtain, Cymch, UK). The average of the three measurements was recorded. Children’s percent overweight (percent above median BMI), BMI percentile, and zBMI were calculated using age- and gender normative data via growth charts from the Centers for Disease Control and Prevention (Kuczmarski et al., 2000). Adult BMI was calculated as kg/m2. Results are reported on changes in zBMI for children and percent overweight for children and parents.
Diet
Children’s dietary intake were assessed using three scheduled 24-hour recalls collected by a registered dietician from the GCRC (2 week days and 1 weekend) over a two-week period using the multiple-pass method (Guenther PM, 1995). This method has been validated against the doubly labeled water methods for energy intake, and deemed accurate for estimates of energy and nutrient intake of young children.(Johnson, Driscoll, & Goran, 1996) Prior to the recalls, parents were trained in the use of a 2-dimensional food portion size model (Nutrition Consulting Enterprises; Framingham, MA). Food recalls were analyzed for average caloric intake per day using the Minnesota Nutrient Data Systems (NDS) software, version 5.0 (NDS, 2004).
Physical Activity
Children’s physical activity was measured by the MTI (formerly Computer Sciences Applications or CSA) actigraph, a commonly used accelerometer for the objective measurement of physical activity. The actigraph has been validated and calibrated for and used with preschool children (Pate, Almeida, McIver, Pfeiffer, & Dowda, 2006; Pate, Pfeiffer, Trost, Ziegler, & Dowda, 2004). Participants wore the actigraph for seven days (Trost, Pate, Freedson, Sallis, Taylor, 2000), in which 15 second epochs were programmed for data collection, as this provides a reliable estimate of moderate-to-vigorous physical activity in preschool children (Trost, Sirard, Dowda, Pfeiffer, & Pate, 2003). Minutes of moderate (equivalent to brisk walking with epoch scores between 420-842), and vigorous activity (equivalent to jogging with epoch scores greater than 842) were calculated per day for each assessment period (Pate et al., 2004). Parents completed an actigraph log to indicate the days/dates and times worn. Actigraph data were collected at baseline, end of treatment, and at 6 month follow up.
Assessment of Home Food Environment
The home food environment was evaluated based on the presence/absence of specified indicator foods, as an assessment of all foods in the home for healthfulness is not feasible or necessary. The presence of predefined categories for unhealthy (e.g., potato chips), healthy foods (e.g., lean meat), and fresh fruits and vegetables were then summed to yield a score for each category. Food categories were based on the fat and sugar content using criteria adapted from the Traffic Light Diet which was based on the Food Guide Pyramid (Epstein and Squires, 1988). All reported data were coded by the primary coder after training to a minimum of .75 Kappa coefficient; Cohen’s Kappa coefficients were calculated with a minimum of .75 Kappa, indicating strong agreement above chance (Fleiss, 1973). An independent coder established inter-rater reliability on7 randomly selected home assessments (representing 50% of the total data). Kappa coefficients on the presence of available food averaged .93 (SD = .04), ranging from .87 to 1.00, suggesting excellent inter-rater reliability.
Secondary Outcomes
About Your Child’s Eating – Revised
The AYCE-R (Davies, Ackerman, Davies, Vannatta, & Noll, 2007) is a 25-item questionnaire that assesses caregiver beliefs and concerns about children’s eating and family mealtime interactions, on 3 scales including Positive Mealtime Interactions, Resistance to Eating, and Parent Aversions to Mealtimes. Convergent validity and internal consistency for these scales were considered adequate during psychometric validation (α = .72-.89; Davies, Ackerman, Davies, Vannatta, & Noll, 2007).Caregivers rate how often a variety of situations take place in their family around children’s eating on a 5-point Likert-type scale, from “never” to “nearly all the time.” To best represent the targeted parent and child behaviors, we utilized two of the three scales, Positive Mealtime Interaction (“Meal times are among the most pleasant of the day”), and a revised Resistance to Eating scale (“There are arguments between me and my child over eating”). We explored whether families who received the intervention would report changes on this measure from baseline to end of treatment and at the 6 month follow up.
Child Feeding Questionnaire
The CFQ (Birch, et al., 2001) is a 31-item self-report questionnaire that assesses parental child feeding attitudes and practices. Caregivers rated how much they agree with statements regarding parental feeding styles on a 5-point Likert-type scale, from “disagree” to “agree”. For the purposes of the present study, we utilized two scales, Restriction and Pressure to Eat, consisting of 12 items. Recent reviews on parental feeding practices have reported that restriction, in which the caregiver controls or limits child food choices or how much he/she eats, as well as maternal pressure to eat food have been linked with child eating and weight status (Faith & Kerns, 2005). Birch and others (2001) reported acceptable coefficient alphas for Restriction (.73) and Pressure to Eat (.70).
Parenting Styles and Dimensions
The PSD (Robinson, Mandleco, Olsen, & Hart, 1995)is a 53-item questionnaire assessing three parenting styles: authoritarian, authoritative, and permissive. Parents rated each item on a 5-point Likert-type scale ranging from never (1) to always (5). This measure has been standardized for parents of preschool children with satisfactory psychometric properties (Robinson, Mandelco, Olsen, & Hart, 1996). Parenting styles, such as authoritative, are qualitatively similar to the behavioral skills being taught to parents in the present intervention. We explored the potential changes in parenting practices from baseline to end of treatment and at the 6 month follow up. Researchers have recently begun to identify links between parenting styles, parental feeding practices, and child nutritional intake (Faith & Kerns, 2005).
Pediatric Quality of Life
The PedsQL Generic Core Scales (Varni, Seid, & Rode, 1999) were designed to assess generic Health Related Quality of Life (HRQoL) in children between the ages of 2 and 18 years. In this study we used parent report on child forms because of the children’s age. Parent report forms are available for children ages 2 to 18 years. The form for children below 5 years of age contains 23 items that ask the parent to rate how much of a problem each item has been for the past month on a 5-point scale (e.g., 0 = never a problem, 4 = almost always a problem) and make up the Physical Functioning Scale (8-items), the Emotional Functioning Scale (5-items), Social Functioning Scales (5-items) and the School Functioning Scale (5-items). The PedQL yields six scores for the 4 scales above, a Total Scale Score, and a Psychosocial Health Summary Score (combines Emotional, Social, and School Functioning Scales. Overweight children and adolescents have been found to have poorer health-related quality of life when compared to children classified as non-obese (Friedlander, Larkin, Rosen, Palermo, & Redline, 2003; Schwimmer, Burwinkle, & Varni, 2003), and similar children diagnosed with cancer (Schwimmer et al., 2003). Adequate internal reliability coefficients were reported during the psychometric validation study of the PedQL (Varni, Seid, & Kurtin, 2001).
Results
Figure 1 shows the flow of participants into the study. Of the 3000 charts reviewed, 158 were between 2 years 0 months and 5 years 11 months of age and had a BMI percentile ≥ 95th for age and gender. Thirty-two families were randomly selected to be sent letters and one family was referred by their pediatrician at the practice. Of these 33 families 5 met inclusion criteria and agreed to participate. Of these 5 families, 1 dropped out of treatment after baseline, and 1 dropped after Week 6. However, as both families agreed to continue to come in for weight and height assessments at end of treatment and the 6 month follow up. These families were used as a comparison of children who do not receive treatment and will subsequently be referred to as “noncompleters”. Baseline characteristics and demographic information for treatment completers and noncompleters are shown in Table 1.
Figure 1.

Participant flow depicting recruitment and reasons for noninvolvement
Table 1.
Baseline weight characteristics of treatment completers and noncompleters
| Participant | Treatment Status | Age | Weight (lbs) | BMI%ile | Percent over 50th BMI %ile | Maternal-BMI | Maternal Education | Family SES |
|---|---|---|---|---|---|---|---|---|
| “Mary” | Completer | 2.6 | 35.9 | 98.6 | 22.5 | 28.3 | graduate degree | 2 |
| “Greg” | Completer | 4 | 48.6 | 99.5 | 26.3 | 25.5 | college graduate | 1 |
| “Jenny” | Completer | 5.2 | 56.5 | 96 | 22 | 26.7 | graduate degree | 2 |
| “Susan” | Noncompleter | 5.2 | 59.8 | 98.3 | 31.6 | 28.9 | partial college | 2 |
| “Jill” | Noncompleter | 4 | 49.2 | 99 | 33.5 | 42.8 | graduate degree | 2 |
SES: Socioeconomic Status based on Hollingshead index, in which 1 = upper class and 2 = middle to upper-middle class.
Child Weight Loss
Treatment completers
As can be seen in Figure 2, children who completed the intervention all showed a decrease in zBMI by the end of treatment, ranging from -0.18 to -0.99. During the 6-month follow up period, 2 participants continued to show a reduction in zBMI, ranging from -0.08 to -0.19, while the participant who reduced their zBMI the most during treatment (-0.99) and achieved a BMI percentile of 84th maintained their improved zBMI reduction of -0.96 and BMI percentile (78.6%ile). Alternatively, change in percent over ideal body weight are shown in Table 2, in which treatment completers all showed reductions at the end of treatment and during the 6-month follow up.
Figure 2.
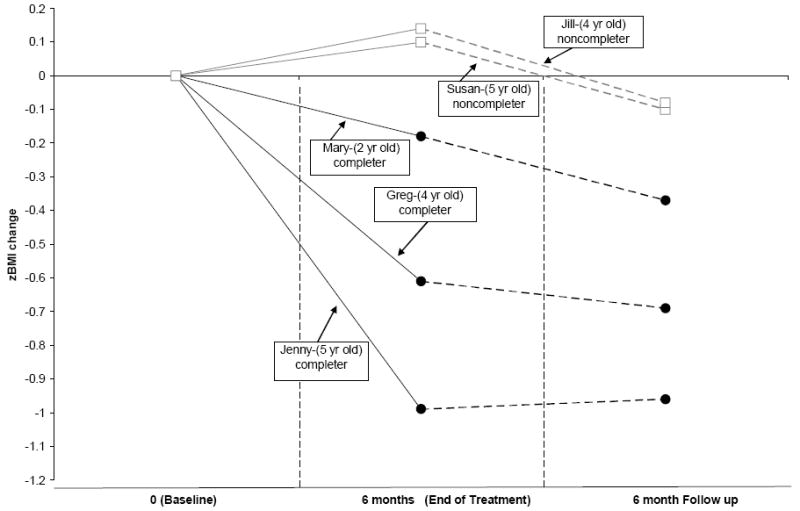
Change in zBMI values for the three children who completed treatment (Mary, Greg, and Jenny) and the two children who did not complete treatment (Susan and Jill) at baseline, end of treatment and the 6 month follow up.
Table 2.
Percent over ideal body weight, change in percent over ideal body weight at Baseline, End of Treatment, the 6 Month Follow up for treatment completers and noncompleters, and change in maternal percent overweight at end of treatment and 6 Month Follow Up.
| Participant | Percent over ideal body weight | Change in percent over ideal body weight compared to Baseline | Change in Maternal percent weight change from baseline | ||||
|---|---|---|---|---|---|---|---|
| Baseline | End of treatment | 6 month follow up | End of Treatment | 6 mo Follow up | End of Treatment | 6 mo Follow up | |
| “Mary” | 22.5 | 20.38 | 18.83 | - 2.12 | -3.67 | -0.50 | 7.15 |
| “Greg” | 26.28 | 18.59 | 20.78 | - 7.69 | -5.5 | -10.56 | -10.67 |
| “Jenny” | 22.0 | 7.89 | 9.21 | -14.11 | -10.17 | -13.70 | -14.34 |
| “Susan”a | 31.58 | 37.5 | 34.87 | +5.92 | +3.29 | -8.40 | -12.14 |
| “Jill”b | 33.5 | 33.1 | 38.16 | -0.44 | +4.66 | -3.94 | -2.97 |
completed 6 sessions.
completed 0 sessions.
Noncompleters
In contrast, the two children who dropped out of treatment showed gains in zBMI, ranging from 0.10 to 0.14 (Figure 2) during the time corresponding to the end of treatment and only showed a small reduction in zBMI, ranging from -0.08 to -0.1 at the time corresponding to the 6 month follow up when compared to their baseline. As can be seen in Table 2, change in percent over ideal bodyweight either stayed the same or increased at the end of treatment and increased for both participants during the 6-month follow up.
Parent Weight Loss
Treatment Completers
As shown in Table 2, two out of the three parents who completed treatment showed a reduction in percent overweight by the end of treatment of -10.56% to -13.70%, which resulted in a change in weight classification from overweight (i.e., BMI ≥ 25 < 29) to normal weight classification (BMI < 25). These two parents maintained their weight loss and normal weight classification at the 6 month follow up. The third treatment completing parent showed no change in weight at the end of treatment -0.50% and an increase in percent overweight of 7.15% at the 6 month follow up.
Noncompleters
The two parents who dropped from treatment also showed reductions in percent overweight during time corresponding to the end of treatment of -3.94% and -8.40%, and either maintained this improvement (-2.97) or further decreased their percent overweight (-12.14) at the time corresponding to the 6 month follow up (Table 2). However, neither parent attained a BMI < 25.
Child Height
Height increased normally over the year for all 5 participants, ranging from 4.1 cm to 7.3 cm of growth (M = 5.84cm; SD = 1.21), suggesting adequate growth was maintained.
Energy Intake
Treatment Completers
Average daily caloric intake was 1270.64 (SD = 178.81) kcal at baseline. At the end of treatment, there was a reduction in mean daily calories (M = 993.41 kcal; SD = 105.50), but at 6 month follow up, average calories returned to baseline level (M = 1266.27; SD = 162.68) (See Table 3).
Table 3.
Change during treatment in activity, home food environment, parenting characteristics, and quality of life for treatment completers.
| Mary | Greg | Jenny | |||||||
|---|---|---|---|---|---|---|---|---|---|
| Baseline | End of Tx | 6 mo follow up | Baseline | End of Tx | 6 mo follow up | Baseline | End of Tx | 6 mo follow up | |
| Physical Activity | |||||||||
| Moderate | 59 | 48.1 | 47.82 | 89 | 72.57 | 81.60 | 62 | 48.1 | 77.14 |
| Vigorous | 19 | 12.3 | 12.25 | 29 | 21.89 | 37.53 | 21 | 12.32 | 26.21 |
| Home Food Environment | |||||||||
| High Calorie/Fat Foods | 6-7 | 3-5 | 3-5 | >8 | >8 | >8 | >8 | 6-7 | >8 |
| Sweetened Beverages | 2 | 1 | 0 | 3 | 3 | 3 | 3 | 2 | 1 |
| Fresh Fruits and Vegetables | 7 | 10 | 11 | 10 | 10 | 13 | 11 | 14 | 13 |
| Caloric Intake | 1272.97 | 872.52 | 1087.18 | 1090.68 | 1066.91 | 1404.91 | 1448.27 | 1040.79 | 1306.72 |
| AYCE-R | |||||||||
| Resistance To Eating | 2.18 | 2.00 | 2.18 | 1.91 | 1.36 | 1.36 | 1.55 | 1.27 | 1.45 |
| Positive Mealtime Int. | 3.20 | 3.60 | 3.80 | 4.20 | 4.40 | 4.20 | 3.80 | 3.40 | 3.40 |
| CFQ | |||||||||
| Restriction | 4.75 | 4.75 | 4.38 | 4.75 | 4.00 | 3.75 | 4.75 | 3.88 | 4.25 |
| Pressure | 1.25 | 1.00 | 1.00 | 1.75 | 1.00 | 1.00 | 1.75 | 1.00 | 1.00 |
| Parenting Styles | |||||||||
| Authoritative | 3.91 | 4.32 | 3.73 | 4.32 | 4.14 | 4.18 | 4.41 | 4.23 | 4.23 |
| Authoritarian | 1.78 | 1.83 | 1.78 | 1.67 | 1.44 | 1.39 | 1.72 | 1.5 | 1.72 |
| Permissive | 1.75 | 1.83 | 2.00 | 1.92 | 1.5 | 1.58 | 1.5 | 1.5 | 1.58 |
| Quality of Life | 86.9 | 85.71 | 77.38 | 97.62 | 97.62 | 100.00 | 91.67 | 92.86 | 95.24 |
AYCE-R, About Your Child’s Eating-Revised; CFQ, Child Feeding Questionnaire.
Noncompleters
Average daily intake was available for only one child, and was relatively stable across baseline (average 1099 kcal/day) and the 6 month follow up (average 958 kcal/d) (See Table 4).
Table 4.
Change during treatment in activity, home food environment, parenting characteristics, and quality of life for noncompleters.
| Susan | Jill | ||||||||
|---|---|---|---|---|---|---|---|---|---|
| Baseline | End of Tx | 6 mo follow up | Baseline | End of Tx | 6 mo follow up | ||||
| Physical Activity | |||||||||
| Moderate | 44.37 | 45.9 | 36.78 | NC | NC | NC | |||
| Vigorous | 9.42 | 21.5 | 11.78 | NC | NC | NC | |||
| Home Food Environment | |||||||||
| High Calorie/Fat Foods | 6-7 | >8 | 6-7 | >8 | >8 | NC | |||
| Sweetened Beverages | 1 | 1 | 3 | 1 | 2 | NC | |||
| Fresh Fruits and Vegetables | 2 | 4 | 2 | 3 | 6 | NC | |||
| Caloric Intake | 1099.65 | NC | 958.09 | NC | NC | NC | |||
| AYCER | |||||||||
| Resistance To Eating | 1.55 | 1.91 | 1.82 | 2.18 | 1.55 | 1.64 | |||
| Positive Mealtime Int. | 4.20 | 4.60 | 4.80 | 4.00 | 3.80 | 4.00 | |||
| CFQ | |||||||||
| Restriction | 3.62 | 3.88 | 4.00 | 4.00 | 3.12 | 3.50 | |||
| Pressure | 1.75 | 1.25 | 1.00 | 1.50 | 1.25 | 1.50 | |||
| Parenting Styles | |||||||||
| Authoritative | 3.5 | 3.5 | 3.27 | 3.95 | 4.32 | 4.45 | |||
| Authoritarian | 1.78 | 1.50 | 1.61 | 2.06 | 2.00 | 1.89 | |||
| Permissive | 1.33 | 1.33 | 1.42 | 2.00 | 1.67 | 1.67 | |||
| Quality of Life | 82.14 | 78.57 | 90.48 | 84.52 | 86.90 | 84.52 | |||
AYCE-R, About Your Child’s Eating-Revised; CFQ, Child Feeding Questionnaire.
Activity Levels
Treatment Completers
As seen in Table 3 all completers were near the recommended levels for Moderate activity (M = 70 min; SD = 16.52) and Vigorous activity (M = 23.0; SD = 5.29) at baseline, but both of these decreased at the end of treatment assessment (Moderate M = 56.25min; SD = 14.12); (Vigorous M = 15.50; SD = 5.53). At the 6 month follow up Moderate (M = 68.85; SD = 18.35) and Vigorous activity levels (M = 25.33; SD = 12.66) returned to near baseline.
Noncompleters
One family agreed to wear the actigraph. As seen in Table 4, this child had a lower level of Moderate Vigorous activity at baseline than the treatment completers, but doubled their Vigorous activity (from an average of 9 to 21 min per day) from baseline to end of treatment. However, at the 6 month follow up, Moderate activity fell below average baseline level and Vigorous activity returned to near baseline levels.
Home Food Environment
Treatment completers
As shown in Table 3, the presence of high calorie/high fat foods remained high for two families (i.e., 8 or more items) while one family was able to reduce their number from between 6-7 items to 3-5 at the end of treatment and maintain this at the 6 month follow up. Sweetened beverages (e.g., regular soda, juice, and sports drinks) were reduced to zero or near zero levels for two out of the three families while the third remained at a constant level of 3 types of drinks available throughout treatment and follow up. Availability of fruits and vegetables increased for all three families when comparing baseline (7-11 foods) to the 6 month follow up period (11-13 foods; Table 3).
Noncompleters
The availability of high calorie/high fat foods and sweetened beverages either increased or remained unchanged over time for families who did not complete treatment (Table 4). The availability of fresh fruits and vegetables were increased from baseline to the end of treatment, although the amount available returned to baseline levels during the 6 month follow up period. A comparison of the absolute numbers of fresh fruits and vegetables between completers and noncompleters suggests these two groups were different at baseline, with those who completed treatment having an average of 9.33 fresh fruits and vegetables available during baseline, while the two noncompleting families had only 2 or 3 different types of fresh fruit and vegetables available.
Psychosocial Measures
About Your Child’s Eating
Treatment completers
Mothers generally reported either a decrease or consistent level of Resistance to Eating, when comparing baseline to end of treatment and 6 month follow up periods (Table 3). Positive Mealtime Interactions were relatively stable over all time points. Overall levels of Positive Mealtime Interactions were higher at all 3 time points compared to levels of Resistance to Eating, suggesting the mealtime environment was generally positive.
Noncompleters
Resistance to Eating increased over time for both families while Positive Mealtime Interaction scores remained stable (Table 4).
Child Feeding Questionnaire
Treatment completers
Restriction of foods and Pressure to Eat were reported by parents to be lower at the end of treatment than at baseline and remained at this level at the 6 month follow up assessment (Table 3).
Noncompleters
One family reported an increase in Restriction and lower levels of Pressure to Eat over time, while the other family reported lower levels of Restriction and consistent levels of Pressure to Eat (Table 4).
Parenting Styles
Treatment completers
Overall, Authoritative parenting behaviors were the most dominantly endorsed parenting style and parenting behaviors classified as being Authoritative, Authoritarian, or Permissive were relatively stable over all three time points (Table 3).
Noncompleters
Similar to treatment completers, parents of noncompleters showed stability in parenting behaviors over time, and Authoritative parenting was the most dominantly endorsed styles (Table 4).
Quality of Life
Treatment completers
Total Quality of Life values reported by completer parents about their children were high at baseline (i.e., scores >91.6) for two of the three families who responded best to treatment and slightly increased over time. The parent of the child who decreased their zBMI the least reported a slightly lower baseline value (86.9) and this decreased over time (77.38) (See Table 3).
Noncompleters
Total Quality of Life values for both noncompleters (82.14-84.52) were lower than treatment completers at baseline, with one parent reporting no change in scores for their child, the other parent reporting a decrease from baseline to end of treatment (6 months), and then an increase at the 6 month follow up (12 months) (Table 4).
Discussion
Our initial results indicate that preschool children who completed treatment achieved a decrease in weight, consistent with outcomes reported by obesity treatment programs for school aged children. When examining treatment completers, the reduction in percentage over weight of 3.67%, 5.5%, and 10.17%, was similar to behavioral treatment programs focused on increasing family-based lifestyle changes in nutrition and activity for school age children. For instance, a meta-analytic review of eight randomized controlled trials averaged an 8.2% and 8.9% decrease in percent overweight for immediate and long-term post-treatment effects (Wilfley et al., 2007). Moreover, other qualitative reviews of pediatric obesity treatment studies have reported 5-20% reductions in percent overweight for children between 5 and 13 years of age (Jelalian & Saelens, 1999). Although our study did not include a control group, the two participants who dropped out provided an opportunity to examine the effects of receiving minimal or no treatment. Similar to studies with control groups of children and adolescents who did not receive treatment, the two children who did not complete treatment showed an increased in percent overweight during the initial 6 months corresponding to treatment and maintained this weight gain at the 6 month follow up. This finding provides initial evidence that preschool children will likely not “outgrow their baby fat” overtime, but rather the problem of obesity may actually become worse without intervention.
A strength of the program is the positive parent report of the mealtime environment and the use of effective parental feeding strategies. There may be concern that by focusing on weight issues in so a young a population that maladaptive parenting and eating strategies may be inadvertently promoted. Our treatment included recommendations for healthy eating that should be standard nutritional advice to parents of young children, specifically to eliminate or reduce the amount of caloric-dense foods (e.g., soda, candy, fast food) while increasing the presence and servings of nutrient-dense foods (i.e., fresh fruits and vegetables). The positive adjustment by children and their family members to these nutritional changes suggests children at this age showed minimal resistance and that parents did not increase their use of maladaptive feeding strategies such as increasing restriction or pressure to eat (Birch et al., 2001; Faith & Kerns, 2005). Moreover, high baseline levels of quality of life appeared to generally remain stable over time or even increase, suggesting children at this age may benefit from intervention before overall quality of life has been compromised (Schwimmer et al., 2003).
A unique aspect of the study included home visits which were reported by parents as being very helpful and supportive during treatment. Overall, parents reported that the “clean out” of many foods in the home helped them better manage discussions with their child on what to eat and made it easy to redirect to healthy alternative foods when high-fat/high-calorie snack food were eliminated from the home. Interestingly, observations of the home food environment indicated that the number of high-fat/high calorie foods was not removed completely. Perhaps more importantly was the finding that families who completed treatment were able to successfully increase the number of healthy foods available while decreasing sweetened beverages. These changes in types of foods available likely contributed to the majority of families who completed treatment showing a reduction in percent overweight over time.
Challenges and Next Steps
While we are encouraged by the positive preliminary findings, several challenges to treatment were discovered when working with preschool children. One formidable challenge is recruitment. In the current development phase of a preschool treatment program we experienced a 62% declined rate, by mail and/or by phone. We also experienced a significant drop out rate. Of the 5 families who agreed to initially participate, only 3 completed the entire treatment (60% retention). The most often cited reasons for declining was that parents did not believe their child was overweight, despite having a BMI percentile at or above the 95th percentile, believed their child would outgrow their weight (“my child is fine and will grow out of it”) or that there is nothing they could do about the weight, or believed “he’s big like his father” and therefore parents were not interested in treatment. Two parents were offended at the idea that their child may need treatment as evidenced by their writing or calling the pediatrician to explicitly tell them they were offended. These parental responses confirm earlier findings that parents do not recognized their child is over weight in the preschool age group even when above the 95th percentile BMI. One reason for this lack of recognition may be that obese preschool children often do not visually look like the typically “obese” adult. Rather, these children may simply look older than same age peers. The problem associated with visual recognition of obesity is further compounded by the fact that pediatricians rarely use BMI percentile to determine or communicate the weight status of their patients of any age. For instance, documentation of BMI percentile has been found to be as low as 6.1% (Barlow, Bobra, Elliott, Brownson, & Haire-Joshu, 2007; Perrin, Flower, & Ammerman, 2004) in medical record review studies and overweight is least recognized or documented for preschool children. In retrospective medical chart reviews, only 31% of obese preschool children had a weight diagnosis in their chart compared with 60% of obese school age children and 76% of adolescents. Even though the practice we recruited from routinely charts BMI percentile on all patients it was clear from our recruitment calls that parents did not fully understand the implications and meaning of their child’s BMI.
Because the practice we recruited from routinely records and tracks BMI percentile, we assumed that parents would understand the implications of being above the 95th percentile and thus our initial recruitment letter to families only indicated the child was at or above the 95th BMI percentile, general information about the meaning of this percentile, and all letters were signed by the senior pediatrician. Clearly, our current recruitment rate would indicate that more education of parents is necessary in the initial pediatrician letter. In subsequent iterations of the treatment development we plan to include the individual child’s BMI percentile and a brief personnel note that connects this information to the most recent visit in a letter specifically from the pediatrician the family saw at that visit instead of the practice.
A second challenge was parental beliefs that removing fast foods and high fat/sugary snack foods made them feel like they were “depriving” their children. It was difficult for some family members to give up going out to lunch at a fast food restaurant, especially if this was tied in with extended family members, even though such meals provided calories equivalent to the entire day’s worth of energy for a preschooler. Additionally, parents often reported receiving pressure from family members, including spouses or grandparents, to continue serving “treats” when they were watching the child. Grandparents, especially, reported that it felt like an infringement on their relationship with the child if they could not “spoil them” with perceived favorite foods. As a result treatment effectiveness was limited when grandparents provided daily caregiving to preschoolers in our treatment. Thus, while parents may have changed the home environment, this did not impact multiple opportunities to eat outside their primary home with different rules and available foods and activities from other caregivers. Future treatment interventions may benefit from having more than one caregiver participating in the treatment, particularly when others have significant responsibility in feeding the child or providing opportunities for physical activity. Expanding the home visits to include these caregivers may be a feasible means of including them.
A primary goal of dietary changes during LAUNCH involves increasing the availability and consumption of fresh fruits and vegetables. Although we provided specific guidelines on appropriate serving sizes and ways to increase fruits and vegetables, parents did not actually set up a dedicated time to offer repeated exposures to new fruits and vegetables. Some parents expressed reluctance to actually purchase these foods, fearing the child would resist and the food would spoil. Others simply reported not being able to find the time to prepare and present new vegetables and/or fruits routinely. Increasing the tolerance and preference for new fruits and vegetables may require more direct intervention such that parents are given samples of vegetables and a schedule for presenting these as was done in an exposure study with preschoolers (Wardle et al., 2003).
Although the preliminary data suggest a positive effect for the treatment, we are unable to know which aspects of treatment contributed to the outcome. As often the case with packaged behavioral interventions, it is unclear at this time what impact the home visitations had on the overall effectiveness of the intervention. Future studies that compare groups with and without home visitations as well as other components of the intervention will be able to better identify the most efficacious treatment mechanisms.
Finally, we were not able to increase either moderate or vigorous physical activity in this sample. While our participants showed recommended levels of moderate (60 min), vigorous (30 min) activity at baseline this did not increase during treatment despite parent perceptions that their children were “much more active” and that the end of treatment occurred during summer months when weather should not have been a barrier. However, it was clear that parents are not a good judge of child activity levels. In order to make meaningful changes it may be that parents will need daily feedback about activity levels by some more objective means. Low cost pedometers along with daily activity goals based on increasing steps from their baseline average may be one method worth exploring. Such a mechanism would provide a feedback loop to parents about their child’s activity level who often believed their child was much more active than indicated by actigraph data.
Implications for Practice
Changing the obesity epidemic in even our youngest children, will likely require the development of treatment options for the already obese preschool children in addition to effective prevention programs that exist. Younger children may benefit from early intervention before eating habits become more ingrained and they begin to make independent choices on what to eat, and how physically active they are on a daily basis. Moreover, during the preschool years, parents have the most control over these facets of their child’s lives which may be a critical period for intervention. As shown in the present study, such a treatment program appears feasible. Our outcomes are consistent with successful weight reduction recommended for preschoolers who are obese and consistent with outcomes of school age weight control programs. However, parental perception of the problem and belief they are “depriving” their child when they reduce or eliminate fast food or foods commonly thought of “child friendly” foods and treat foods are formidable barriers to be over come in future iterations of the treatment program described in the current study. Overall, this study demonstrates the need for continued family-based research with preschool children with obesity to further develop efficacious treatments.
Acknowledgments
This study was supported by grant D24 DK 059492 from the National Institutes of Health (L.J.S.) M01 RR 0808 from the National Center for Research Resources of the NIH.
References
- Agras WS, Hammer LD, McNicholas F, Kraemer HC. Risk factors for childhood overweight: a prospective study from birth to 9.5 years. Journal of Pediatrics. 2004;145:20–25. doi: 10.1016/j.jpeds.2004.03.023. [DOI] [PubMed] [Google Scholar]
- Barlow SE. Expert committee recommendations regarding the prevention, assessment, and treatment of child and adolescent overweight and obesity: summary report. Pediatrics. 2007;120:164–192. doi: 10.1542/peds.2007-2329C. [DOI] [PubMed] [Google Scholar]
- Barlow SE, Bobra SR, Elliott MB, Brownson RC, Haire-Joshu D. Recognition of childhood overweight during health supervision visits: Does BMI help pediatricians? Obesity. 2007;15:225–232. doi: 10.1038/oby.2007.535. [DOI] [PubMed] [Google Scholar]
- Birch LL, Fisher JO, Grimm-Thomas K, Markey CN, Sawyer R, Johnson SL. Confirmatory factor analysis of the Child Feeding Questionnaire: a measure of parental attitudes, beliefs and practices about child feeding and obesity proneness. Appetite. 2001;36:201–210. doi: 10.1006/appe.2001.0398. [DOI] [PubMed] [Google Scholar]
- Brotman LM, Klein RG, Kamboukos D, Brown EJ, Coard SI, Sosinsky LS. Preventive intervention for urban, low-income preschoolers at familial risk for conduct problems: a randomized pilot study. Journal of Clinical Child Adolescent Psychology. 2003;32:246–257. doi: 10.1207/S15374424JCCP3202_10. [DOI] [PubMed] [Google Scholar]
- Clinical Guidelines on the Identification, Evaluation, and Treatment of Overweight and Obesity in Adults--The Evidence Report. National Institutes of Health. Obesity Research. 1998;6:51S–209S. [PubMed] [Google Scholar]
- Davies WH, Ackerman LK, Davies CM, Vannatta K, Noll RB. About Your Child’s Eating: factor structure and psychometric properties of a feeding relationship measure. Eating Behavior. 2007;8:457–463. doi: 10.1016/j.eatbeh.2007.01.001. [DOI] [PubMed] [Google Scholar]
- Davis PH, Dawson JD, Riley WA, Lauer RM. Carotid intimal-medial thickness is related to cardiovascular risk factors measured from childhood through middle age: The Muscatine Study. Circulation. 2001;104:2815–2819. doi: 10.1161/hc4601.099486. [DOI] [PubMed] [Google Scholar]
- Epstein LH, Squires S. The stop-light diet for children. Boston: Little, Brown; 1988. [Google Scholar]
- Epstein LH, Valoski A, Koeske R, Wing RR. Family-based behavioral weight control in obese young children. Journal of the American Dietetic Association. 1986;86:481–484. [PubMed] [Google Scholar]
- Epstein LH, Paluch RA, Roemmich JN, Beecher MD. Family-based obesity treatment, then and now: twenty-five years of pediatric obesity treatment. Health Psychology. 2007;26:381–391. doi: 10.1037/0278-6133.26.4.381. [DOI] [PMC free article] [PubMed] [Google Scholar]
- Faith MS, Kerns J. Infant and child feeding practices and childhood overweight: the role of restriction. Maternal and Child Nutrition. 2005;1:164–168. doi: 10.1111/j.1740-8709.2005.00024.x. [DOI] [PMC free article] [PubMed] [Google Scholar]
- Fleiss JL. Statistical methods for rates and proportions. John Wiley & Sons; Oxford, England: 1973. [Google Scholar]
- Friedlander SL, Larkin EK, Rosen CL, Palermo TM, Redline S. Decreased quality of life associated with obesity in school-aged children. Archives of Pediatrics & Adolescent Medicine. 2003;157:1206–1211. doi: 10.1001/archpedi.157.12.1206. [DOI] [PubMed] [Google Scholar]
- Gidding SS, Dennison BA, Birch LL, Daniels SR, Gillman MW, Lichtenstein AH, et al. Dietary recommendations for children and adolescents: a guide for practitioners. Pediatrics. 2006;117:544–559. doi: 10.1542/peds.2005-2374. [DOI] [PubMed] [Google Scholar]
- Guenther PM, DeMaio TJ, Ingwersen LA, Berline M. International Conference on Dietary Assessment Methods. Boston, MA: 1995. The multiple-pass approach for the 24-hour recall in the Continuing Survey of Food Intakes by Individuals (CSFII) 1994-1996. [Google Scholar]
- He Q, Ding ZY, Fong DY, Karlberg J. Blood pressure is associated with body mass index in both normal and obese children. Hypertension. 2000;36:165–170. doi: 10.1161/01.hyp.36.2.165. [DOI] [PubMed] [Google Scholar]
- Hollingshead AB. Four factor index of social status. New Haven, CT: Yale University, Department of Sociology; 1975. Unpublished paper. [Google Scholar]
- Jain A, Sherman SN, Chamberlin LA, Carter Y, Powers SW, Whitaker RC. Why don’t low-income mothers worry about their preschoolers being overweight? Pediatrics. 2001;107:1138–46. doi: 10.1542/peds.107.5.1138. [DOI] [PubMed] [Google Scholar]
- Jelalian E, Saelens BE. Empirically supported treatments in pediatric psychology: pediatric obesity. Journal of Pediatric Psychology. 1999;24:223–248. doi: 10.1093/jpepsy/24.3.223. [DOI] [PubMed] [Google Scholar]
- Johnson RK, Driscoll P, Goran MI. Comparison of multiple-pass 24-hour recall estimates of energy intake with total energy expenditure determined by the doubly labeled water method in young children. Journal of the American Dietetic Association. 1996;96:1140–1144. doi: 10.1016/S0002-8223(96)00293-3. [DOI] [PubMed] [Google Scholar]
- Kuczmarski RJ, Ogden CL, Grummer-Strawn LM, Flegal KM, Guo SS, Wei R, et al. CDC growth charts: United States. Advance Data. 2000:1–27. [PubMed] [Google Scholar]
- Lohman TG, Roche AF, Martorell R. Anthropometric standardization reference manual. Human Kinetics Books; Champaign, IL: 1988. [Google Scholar]
- Mannino DM, Mott J, Ferdinands JM, Camargo CA, Friedman M, Greves HM, et al. Boys with high body masses have an increased risk of developing asthma: findings from the National Longitudinal Survey of Youth (NLSY) International Journal of Obesity. 2006;30:6–13. doi: 10.1038/sj.ijo.0803145. [DOI] [PubMed] [Google Scholar]
- Marcus CL, Curtis S, Koerner CB, Joffe A, Serwint JR, Loughlin GM. Evaluation of pulmonary function and polysomnography in obese children and adolescents. Pediatric Pulmonology. 1996;21:176–183. doi: 10.1002/(SICI)1099-0496(199603)21:3<176::AID-PPUL5>3.0.CO;2-O. [DOI] [PubMed] [Google Scholar]
- Morgan WJ, Crain EF, Gruchalla RS, O’Connor GT, Kattan M, Evans R, et al. Results of a home-based environmental intervention among urban children with asthma. New England Journal of Medicine. 2004;351:1068–1080. doi: 10.1056/NEJMoa032097. [DOI] [PubMed] [Google Scholar]
- Nader PR, O’Brien M, Houts R, Bradley R, Belsky J, Crosnoe R, et al. Identifying risk for obesity in early childhood. Pediatrics. 2006;118:594–601. doi: 10.1542/peds.2005-2801. [DOI] [PubMed] [Google Scholar]
- NDS. Minneapolis: Nutrition Data Systems Nutrition Coordinating Center. University of Minnesota, Division of Epidemiology; Minneapolis, MN: 2004. [Google Scholar]
- Ogden CL, Troiano RP, Briefel RR, Kuczmarski RJ, Flegal KM, Johnson CL. Prevalence of overweight among preschool children in the United States, 1971 through 1994. Pediatrics. 1997:E1. doi: 10.1542/peds.99.4.e1. [DOI] [PubMed] [Google Scholar]
- Pinhas-Hamiel O, Dolan LM, Daniels SR, Standiford D, Khoury PR, Zeitler P. Increased incidence of non-insulin-dependent diabetes mellitus among adolescents. Journal of Pediatrics. 128:608–615. doi: 10.1016/s0022-3476(96)80124-7. [DOI] [PubMed] [Google Scholar]
- Pate RR, Almeida MJ, McIver KL, Pfeiffer KA, Dowda M. Validation and calibration of an accelerometer in preschool children. Obesity. 2006;14:2000–2006. doi: 10.1038/oby.2006.234. [DOI] [PubMed] [Google Scholar]
- Pate RR, Pfeiffer KA, Trost SG, Ziegler P, Dowda M. Physical activity among children attending preschools. Pediatrics. 2004;114:1258–1263. doi: 10.1542/peds.2003-1088-L. [DOI] [PubMed] [Google Scholar]
- Ray R, Lim LH, Ling SL. Obesity in preschool children: an intervention programme in primary health care in Singapore. Annals of the Academy of Medicine. 1994;23:335–341. [PubMed] [Google Scholar]
- Robinson CC, Mandleco B, Olsen SF, Hart CH. Authoritative, authoritarian, and permissive parenting practices - Development of a new measure. Psychological Reports. 1995;77:819–830. [Google Scholar]
- Robinson CC, Mandleco B, Olsen SF, Hart CH. Psychometric support for a new measure of authoritative, authoritarian, and permissive parenting practices: A cross-cultural perspective. Four new measures of parenting styles developed in different cultural contexts; Symposium conducted at XIVth Biennial International Society for the Study of Behavioral Development; Quebec, Canada. 1996. [Google Scholar]
- Schwimmer JB, Burwinkle TM, Varni JW. Health-related quality of life of severely obese children and adolescents. Journal of the American Medical Association. 2003;289:1813–1819. doi: 10.1001/jama.289.14.1813. [DOI] [PubMed] [Google Scholar]
- Sullivan SA, Birch LL. Pass the sugar, pass the salt: Experience dictates preference. Developmental Psychology. 1990;26:546–551. [Google Scholar]
- Trost SG, Pate RR, Freedson PS, Sallis JF, Taylor WC. Using objective physical activity measures with youth: How many days of monitoring are needed? Medicine and Science in Sports and Exercise. 2000;32(2):426–431. doi: 10.1097/00005768-200002000-00025. [DOI] [PubMed] [Google Scholar]
- Trost SG, Sirard JR, Dowda M, Pfeiffer KA, Pate RR. Physical activity in overweight and nonoverweight preschool children. International Journal of Obesity Related Metabolic Disorders. 2003;27:834–839. doi: 10.1038/sj.ijo.0802311. [DOI] [PubMed] [Google Scholar]
- Varni JW, Seid M, Rode CA. The PedsQL (TM): Measurement model for the pediatric quality of life inventory. Medical Care. 1999;37:126–139. doi: 10.1097/00005650-199902000-00003. [DOI] [PubMed] [Google Scholar]
- Wardle J, Cooke LJ, Gibson EL, Sapochnik M, Sheiham A, Lawson M. Increasing children’s acceptance of vegetables; a randomized trial of parent-led exposure. Appetite. 2003;40:155–162. doi: 10.1016/s0195-6663(02)00135-6. [DOI] [PubMed] [Google Scholar]
- Wilfley DE, Tibbs TL, Van Buren DJ, Reach KP, Walker MS, Epstein LH. Lifestyle interventions in the treatment of childhood overweight: a meta-analytic review of randomized controlled trials. Health Psychology. 2007;26:521–532. doi: 10.1037/0278-6133.26.5.521. [DOI] [PMC free article] [PubMed] [Google Scholar]