Abstract
Study Objectives:
To look for an association between the vertical position of the hyoid, as measured by the sella-hyoid (S-H) distance and the severity of obstructive sleep apnea (OSA). A previously published study on this subject showed a significant correlation between S-H distances more than 120 mm and severe OSA.
Design and Setting:
A retrospective study of patients who were treated with a mandibular advancement splint (MAS) for sleep disordered breathing during June 2000 to May 2005 at the orthodontic department of Colchester University Hospital.
Patients and Participants:
One hundred and six consecutive patients who were treated with MAS during the period.
Measurements and Results:
Lateral cephalograms were taken and traced prior to the provision of MAS therapy, and the distance S-H was measured. The mean S-H distance was 125.5 mm (103-148 mm) with a median of 126 mm. Four out of 8 patients (50%) with severe OSA had a S-H distance more than 120 mm, as did 38 out of 50 (76%) with mild to moderate OSA (AHI 5-30), and 17 out of 22 patients (77.27%) with an AHI of 0 to 4. No significant correlations between the S-H distance and the severity of OSA were found (Pearson correlation coefficient −0.034 and 95% confidence interval: −0.25, 0.18).
Conclusion:
There was no correlation between patients' OSA severity and their cephalometric S-H distance. The utility of the latter as a screening test cannot therefore be recommended as a substitute for existing diagnostic tests.
Citation:
Gulati A; Chate RAC; Howes TQ. Can a single cephalometric measurement predict obstructive sleep apnea severity? J Clin Sleep Med 2010;6(1):64-68.
Keywords: Cephalometric measurement, S-H distance, obstructive sleeps apnea, severity, Caucasoid
Obstructive sleep apnea (OSA) is a common disorder with an estimated prevalence of 2% to 4% in adults.1 It is characterized by recurrent episodes of upper airway collapse during sleep. Diagnosis is established by overnight polysomnography or respiratory-channel sleep studies showing repeated episodes of reduced or absent airflow with persistent respiratory efforts. The most common epidemiologic risk factor is obesity.2,3 Other than obesity, different anatomic and cephalometeric abnormalities are also associated with OSA, such as bimaxillary retrognathism, increased height of the anterior lower face, inferior hyoid-bone position, and a reduced size of the bony pharynx.4,5
Tangugsorn et al.4 looked at the cephalometeric features of 100 men with OSA and 36 healthy control subjects and found that the hyoid bone was inferiorly placed at C4-6 instead of at the usual position of around C4. It was hypothesized that this was due either to increased mandibular plane angles or to thick fat pads in the submental, submandibular, and pharyngeal regions.
More recently Young et al.6 evaluated different cephalometeric parameters in relation to diagnosis and severity of OSA. The S-H distance correlated best with the severity of OSA, with an S-H distance greater than 120 mm correlating with severe OSA and less than or equal to 120 mm with mild to moderate OSA. It was suggested that lateral cephalometric radiographs could be used as an inexpensive screening tool for patients with suspected OSA to help decide who might need further diagnostic evaluation or more complex and expensive sleep tests (i.e., polysomnography).
BRIEF SUMMARY
Current Knowledge/Study Rationale:The study was done to evaluate whether a correlation exists between the vertical position of the Hyoid bone, as measured by the distance between the midpoint of sella-turcica (S) and the anterior-superior point on the Hyoid bone (H), and the severity of any obstructive sleep apnea. It was undertaken to see if this cephalometric measurement could be used as a relatively inexpensive screening tool to differentiate between severe and non-severe forms of sleep apnea.
Study Impact:The vertical position of the Hyoid bone does not predict severity of obstructive sleep apnea. There appeared to be no correlation in the study between this cephalometric measurement (SH distance) and body mass index (BMI).
We carried out this study in Colchester Hospital University NHS Foundation Trust to look for any correlation between different severities of OSA and S-H distances.
METHODS
We collected data retrospectively from all the consecutive patients who were referred to the orthodontic department for mandibular advancement splints (MAS) during the period of 2000-2005. The indications for the referral in most of the cases were mild OSA, failed continuous positive airway pressure treatment, patient preference, or minor sleep disordered breathing with dominant snoring.
Diagnosis of OSA was established by sleep studies that were done locally or at the source of referral using respiratory-channel sleep studies or a polysomnogram. Apnea was defined as absent airflow for more than 10 seconds with persistent respiratory effort. Hypopnea was defined as at least a 50% reduction in airflow with a 3% oxygen desaturation or at least a 30% reduction in airflow with a 4% oxygen desaturation, with events lasting for more than 10 seconds. OSA severity was determined by the apnea hypopnea index (AHI), with an AHI of at least 5 but less than 15 as mild, at least 15 but less than 30 as moderate, and 30 or greater as severe OSA. Baseline height and weight were recorded to measure body mass index (BMI). Individuals with a BMI greater than or equal to 30 were classified as obese, and those with a BMI less than 30 as nonobese. Case notes were reviewed by 1 observer (AG), to record demographic and relevant sleep disorder-related information (e.g., reason for referral, Epworth Sleepiness Scale score and AHI). Information related to the orthodontic intervention (e.g., type of mandibular splint, whether still continuing with the splint, and, if not, then the reason for discontinuation) was also recorded. Cases with incomplete information in which sleep study results were unavailable were excluded from the study.
Lateral cephalograms were taken for all of the patients prior to the provision of a MAS. These were taken in natural head position with the patients standing upright, as has been previously described.7
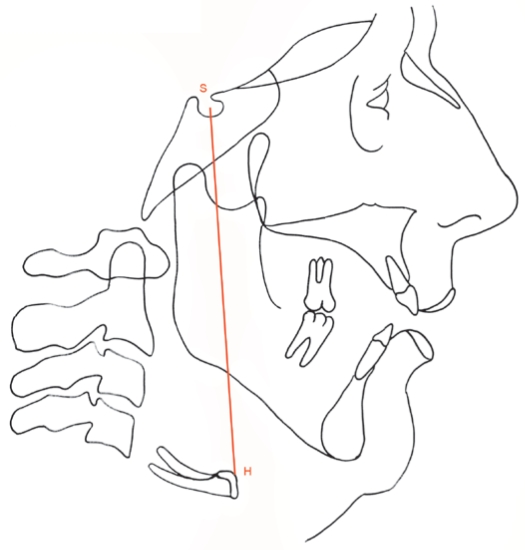
The cephalograms were taped on a flat, well-illuminated, viewing screen and traced in a darkened room by 1 operator (RACC). Good-quality acetate tracing paper and a 4H sharpened pencil were used. Two landmarks were recorded, namely sella (S), the midpoint of sella turcica, and hyoidius (H), the most anterior and superior point on the hyoid bone. For each radiograph, the distance between these 2 landmarks was then measured to the nearest half of a millimeter and recorded (Figure 1).
Figure 1.
Cephalometric tracing with the landmarks Sella (S) and Hyoidius (H)
Thirty-two cephalograms were subsequently randomly chosen and remeasured under the same conditions a month later. The Dahlberg formula of S = √Σd2 / 2n was used to calculate the random error, in which S is the standard error of a single determination, d is the difference between the 2 measurements, and n is the number of double determinations.8 The error of the method using this formula was found to be within acceptable limits (0.33 mm).
Statistical Analysis
Statistical analysis was done using SPSS version 15.0. Scatter plots were generated between AHI and S-H distance, and the Pearson correlation coefficient was calculated to measure any correlation between the two. A further correlation between the BMI and S-H distance was also done by the Pearson correlation coefficient method, along with generating the scatter plot.
RESULTS
Overall, 106 patients had a MAS during the period June 2000 to May 2005. Twenty-six were excluded from the study (sleep study results unavailable for 10 because their treatment was provided in a different center, and case records were incomplete in 16 patients). The mean age was 55.5 years (SD: 9) with a range of 34 to 76 years. There were 63 men and 17 women. The mean BMI was 30.5 (SD: 4.6), the mean pretreatment Epworth Sleepiness Scale score was 10.2 (SD: 4.4), and the median pretreatment AHI was 10 (range: 0-66) (Table 1). Table 2 shows the patient characteristics of this study and the previous one from Edinburgh.6
Table 1.
Baseline characteristics of patients
| Patients Characteristics | |
|---|---|
| Men/women, no. | 63 / 17 |
| Age, y | 55.5 (9) |
| BMI, kg/m2 | 30.5 (4.6) |
| Sella-hyoid distance, mm | 126 (10) |
| Pretreatment AHI, no,/h | 10 (4 -21) |
| Pretreatment ESS score | 10.2 (4.4) |
Data are presented as mean (SD), except sex, which is the number of men and women, and pretreatment apnea-hypopnea index (AHI), which is median (interquartile range). BMI refers to body mass index; ESS, Epworth Sleepiness Scale.
Table 2.
Results of the current study and the Edinburgh study
| Parameter | Gulati et al. | Young et al.6 |
|---|---|---|
| Patients, no. | 80 | 94 |
| Women | 17 | 20 |
| Ethnicity | Caucasian | NA |
| Age, y | ||
| Mean | 55.9 (9.0) | 54 |
| Range | 34-76 | 34-76 |
| AHI, no./h | ||
| Mean | 14.14 | 46.4 |
| Range | 0-66 | 0-206 |
| Interquartile range | 4-21 | NA |
| Subjects with AHI < 40/h, no.(%) | 76 (95) | 57 (61) |
| BMI, kg/m2 | 30.5 (4.6) | NA |
| Pretreatment ESS, score | 10.2 (4.4) | NA |
Data are presented as mean (SD) unless otherwise noted. BMI refers to body mass index; ESS, Epworth Sleepiness Scale; NA, not available.
OSA Severity and Cephalometric S-H Distance
Eight patients had severe OSA (AHI ≥ 30), 50 had mild to moderate OSA (AHI ≥ 5 to < 30), and 22 had snoring and minor sleep disordered breathing (AHI < 5). Correlating S-H with severity of OSA revealed that 4 out of 8 patients (50%) with severe OSA had an S-H distance greater than 120 mm, as did 38 out of 50 (76%) with mild to moderate OSA, and 17 out of 22 patients (77.27%) with an AHI of 0 to 4 (Table 3).
Table 3.
Correlation between AHI and S-H distance
| S-H distance |
||
|---|---|---|
| AHI, no./h | ≤ 120 mm | > 120 mm |
| < 5 | 5 | 17 |
| 5 to < 30 | 12 | 38 |
| ≥ 30 | 4 | 4 |
Data are presented as number of patients in each category. AHI refers to apnea-hypopnea index; S-H, sella-hyoid.
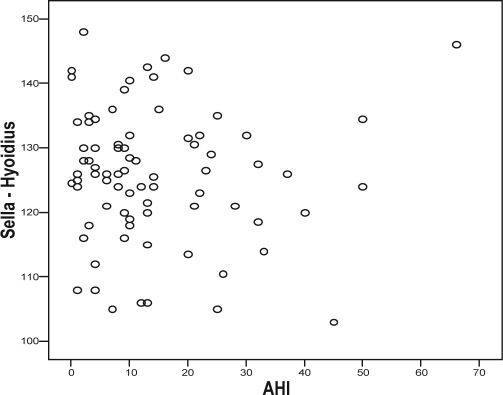
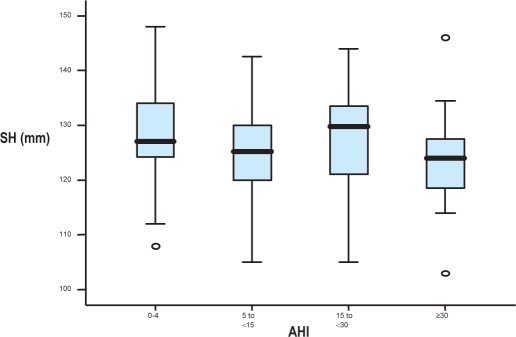
When S-H distances were plotted against AHI's in a scatter plot (Figure 2), no specific correlation was seen (Pearson correlation coefficient −0.034 and 95% confidence interval: −0.25, 0.18). With no specific relationship among the 3 groups in relation to S-H distance, we did further subgroup analyses by splitting the groups into 4 groups based upon AHI and OSA severity: Group 1 with an AHI 0 to 4, Group 2 with an AHI 5 to 14 (mild OSA), Group 3 with an AHI 15 to 30 (moderate OSA), and Group 4 with an AHI greater than 30 (severe OSA). Box plots of the S-H values in the 4 subgroups were generated as shown in Figure 3. The group with the smallest median S-H distance (124 mm) was observed to be the group with an AHI greater than 30, whereas the group with the largest S-H distance (130 mm) was the group with an AHI of 15 to 30. Patients with AHI's of 0 to 4 and 5 to 14 had median S-H distances of 127 mm and 125 mm, respectively. The median values in the 4 groups were not statistically significant different (p = 0.34). Thus, no relation between severity of AHI and the S-H distance appeared to exist in this data set.
Figure 2.
Scatter plot between AHI (per hour) and S-H distance (mm)
Figure 3.
Box plots - Sella-Hyoid distances (mm) for 4 AHI groups
Obesity and Cephalometric S-H distance
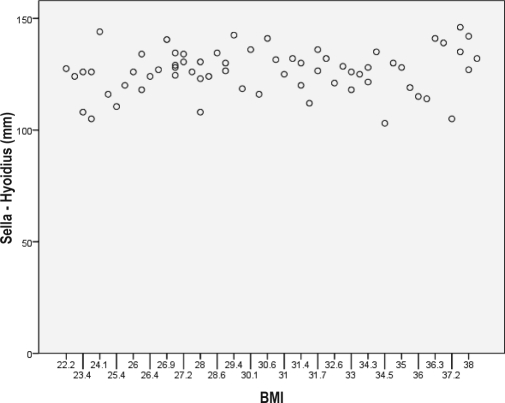
When comparing obese (BMI ≥ 30) versus nonobese (BMI<30) groups, there was no difference in mean S-H distance (126.97 vs 125.64 mm) (Table 4). Also, there was no significant correlation between AHI and the S-H distance in the 2 groups, with no specific pattern to suggest any correlation on a scatter plot (Pearson correlation coefficient 0.139) (Figure 4).
Table 4.
S-H distance between different groups according to the BMI
| Category | BMI, kg/m2 | S-H distance, mm |
|---|---|---|
| Obese | ≥ 30 | 126.97 (10.32) |
| Nonobese | ||
| Total | < 30 | 125.64 (10.39) |
| Normal weight | < 25 | 122.06 (12.37) |
| Overweight | 25-29.9 | 126.4 (8.32) |
| Overweight and obese | 25 | 126.72 (10.11) |
Sella-hyoid (S-H) distance is shown as mean (SD). BMI refers to body mass index
Figure 4.
Scatter plot between BMI (kg/m2) and S-H distance (mm)
Using patients with an AHI less than or equal to 4 per hour as control subjects, comparisons were made between the patients with OSA of variable severity and the control group. Again no significant differences were observed in the S-H distance in these groups. The results of these tests confirm that there was no significant correlation between S-H distance and severity of OSA.
DISCUSSION
In some of the earlier studies, the S-H distance has been found to correlate with the severity of OSA.6,9 In a study done in Edinburgh, S-H distance greater than 120 mm correlated with severe OSA and less than 120 mm with mild to moderate OSA. It was hence proposed that this distance could be used to predict OSA severity and to help make decisions regarding diagnostic triage and subsequent management (S-H less than 120 mm to be referred for mandibular repositioning and distance more than 120 mm for other treatments).6
Similarly, in a study done in a different ethnic population of Chinese men with OSA, the mean S-H distance in those with mild to moderate OSA was slightly less, compared with the men with severe OSA (129.4 mm vs 131.9 mm).9 Although linear regression analysis suggested that the difference was significant, given the small difference of measurement (2.5 mm) between the 2 groups (SD 7.5 and 8.3) and a method error of 0.4 mm, the clinical relevance of the difference is questionable.9 Our research was therefore undertaken to validate the results of the previous study that was done by the Edinburgh group.6
No correlation was found between S-H distance and severity of OSA in male and female Caucasian population, nor between S-H distance and obesity. There is no clear explanation as to why we could not replicate the results of the previous study. Direct comparison between the 2 groups was difficult because there are some perceptible differences between the groups, with some missing information in the Edinburgh group (Table 2). Though the groups were quite similar in age and sex, no information was available for ethnicity and BMI in the Edinburgh group. Some differences in S-H distance in relation to ethnicity are already observed in the literature.10 Though the Scottish and mixed-ethnic population of Edinburgh is likely to be slightly different, compared with our Caucasian population from north Essex in the UK, it seems less likely that this on its own can explain the differences observed. More importantly a higher proportion of the subjects in the Edinburgh study had more severe OSA, as compared with our subjects (39% vs 5%) (Table 2). With only 8 patients in the severe-OSA group, there is an argument that we cannot draw any definite conclusions about the validity of this cephalometric marker in the severe group. The results are hence likely to be valid for only mild to moderate OSA.
A review of the results in all the groups of our study (Table 3) reveals that the majority of the individuals with mild to moderate or no OSA had a S-H distance greater than 120 mm (76% vs 77.27%). Four out of 8 patients with severe OSA had a S-H distance greater than 120 mm. This raises reservations about recommending the S-H distance of 120 mm as a cutoff value for segregating patients with severe and those with mild to moderate OSA, as was suggested in a previous study.6 However, our finding cannot invalidate the previous results because of the small number of patients in the severe-OSA group.
No clear correlation was seen with BMI either, with no differences in the mean S-H distance in the obese and nonobese groups. However, some differences in mean S-H distance were observed between overweight and obese patients, as compared with those who had a normal weight (126.72 mm vs 122.9 mm). The missing BMI information from the Edinburgh study and not knowing what proportion of the subjects were of normal weight, overweight, or obese may or may not explain the differences in the results.
From a methodologic point of view, our study has advantages compared with the previous one6 because our study specifically assessed the validity of a single parameter. We had patients with different severities of OSA, as well as a significant number of subjects with an AHI less than or equal to 4 per hour, who acted as control subjects and gave us another group for comparison. One of the possible reasons suggested in an earlier study for greater distances between the hyoid bone and other cephalometeric landmarks and reference planes in patients with severe OSA could be a lower position of the hyoid bone secondary to considerable accumulation of adipose tissue in the submental, submandibular, and pharyngeal regions.4 In a retrospective study in 161 men with OSA, larger neck circumference was found to be related to a lower position of the hyoid and a high BMI.11 Another study done in Japanese subjects showed that lower position of hyoid is seen in obese as well as nonobese individuals with OSA, as compared with simple snorers.12 Our supposition is that, if obesity is the reason for the measurable changes in the S-H distance, then this should affect primarily obese patients. To test this relationship, we did a comparative analysis of S-H distances in obese and nonobese patients and found no significant correlation.
One of the limitations of this study is that it was retrospective; however, all of our patients had had lateral cephalometeric radiographs taken before they were provided with MAS therapy; they also had a sleep study before their orthodontic referral. Hence, all of the information required to look for any correlation between variable OSA and a single cephalometeric parameter was available. Another limitation of this study was that the radiographs were traced and measured by only 1 observer, and, although a method error was performed, the possibility that interobserver errors may exist cannot be discounted. A further source of bias was that a quarter of the original sample (26/106) were excluded from further analysis due to missing information—either the case records could not be found or the initial sleep studies that were done elsewhere were not available at the time of analysis. This is a practical limitation of most retrospective studies, and, as such, caution is required when the results of this study are interpreted.
In conclusion, the results obtained from our study suggest that the S-H distance on lateral cephalograms alone does not predict the severity of OSA in a Caucasoid population and, hence, cannot be recommended for use as a screening tool in OSA.
DISCLOSURE STATEMENT
This was not an industry-supported study. The authors have indicated no financial conflicts of interest.
ACKNOWLEDGMENT
The authors would like to thank Ms. Kalliopi Vrotsou, Centre for Applied Medical Statistics, Cambridge, United Kingdom, for her assistance with the project.
REFERENCES
- 1.Young T, Palta M, Dempsey J, Skatrud J, Weber S, Badr S. The occurrence of sleep disordered breathing among middle-aged population. N Engl J Med. 1993;328:1230–5. doi: 10.1056/NEJM199304293281704. [DOI] [PubMed] [Google Scholar]
- 2.Young T, Peppard PE, Gottlieb DJ. Epidemiology of obstructive sleep apnea: a population health perspective. Am J Respir Crit Care Med. 2002;165:121–39. doi: 10.1164/rccm.2109080. [DOI] [PubMed] [Google Scholar]
- 3.Vgontzas AN, Tan TL, Bixler EO, Martin LF, Shubert D, Kales A. Sleep apnea and sleep disruption in obese patients. Arch Intern Med. 1994;154:1705–11. [PubMed] [Google Scholar]
- 4.Tangugsorn V, Skatvedt O, Krogstad O, Lyberg T. Obstructive sleep apnoea: a cephalometric study. Part 1. Cervico-craniofacial skeletal morphology. Eur J Orthodontics. 1995;17:45–56. doi: 10.1093/ejo/17.1.45. [DOI] [PubMed] [Google Scholar]
- 5.Sakakibara H, Tong K, Matsushita M. Cephalometric abnormalities in nonobese and obese patients with obstructive sleep apnea. Eur Respir J. 1999;13:403–10. doi: 10.1183/09031936.99.13240399. [DOI] [PubMed] [Google Scholar]
- 6.Young JW, McDonald JP. An investigation into the relationship between the severity of obstructive sleep apnoea/hypopnoea syndrome and the vertical position of the hyoid bone. J R Coll Surg Edinb Irel. 2004;2:145–51. doi: 10.1016/s1479-666x(04)80075-1. [DOI] [PubMed] [Google Scholar]
- 7.Solow B, Tallgren A. Natural head position in standing subjects. Acta Odontol Scand. 1971;29:591–607. doi: 10.3109/00016357109026337. [DOI] [PubMed] [Google Scholar]
- 8.Dahlberg G. Statistical Methods for Medical and Biological Students. London, UK: George Allen & Unwin Ltd; 1940. [Google Scholar]
- 9.Hou HM, Hagg U, Rabie AB, Bendeus M, Yam LY, Ip MS. Dentatofacial characteristics of Chinese obstructive sleep apnea patients in relation to obesity and severity. Angle Orthod. 2006;76:962–9. doi: 10.2319/081005-273. [DOI] [PubMed] [Google Scholar]
- 10.Liua Y, Lowea AA, Zengb X, Fub M, Fleetham JA. Cephalometric comparisons between Chinese and Caucasian patients with obstructive sleep apnea. Am J Orthodont Dentofacial Orthopedics. 2000;117:479–85. doi: 10.1016/s0889-5406(00)70169-7. [DOI] [PubMed] [Google Scholar]
- 11.Ferguson KA, Ono T, Lowe AA, Ryan CF, Fleetham JA. The relationship between obesity and craniofacial structure in obstructive sleep apnea. Chest. 1995;108:375–81. doi: 10.1378/chest.108.2.375. [DOI] [PubMed] [Google Scholar]
- 12.Yu X, Fujimoto K, Urushibata K, Matsuzawa Y, Kubo K. cephalometric analysis in obese and nonobese patients with obstructive sleep apnea syndrome. Chest. 2003;124:212–8. doi: 10.1378/chest.124.1.212. [DOI] [PubMed] [Google Scholar]


