

Abstract
Neuronal nitric-oxide synthase (nNOS) contains a unique autoinhibitory insert (AI) in its FMN subdomain that represses nNOS reductase activities and controls the calcium sensitivity of calmodulin (CaM) binding to nNOS. How the AI does this is unclear. A conserved charged residue (Lys842) lies within a putative CaM binding helix in the middle of the AI. We investigated its role by substituting residues that neutralize (Ala) or reverse (Glu) the charge at Lys842. Compared with wild type nNOS, the mutant enzymes had greater cytochrome c reductase and NADPH oxidase activities in the CaM-free state, were able to bind CaM at lower calcium concentration, and had lower rates of heme reduction and NO synthesis in one case (K842A). Moreover, stopped-flow spectrophotometric experiments with the nNOS reductase domain indicate that the CaM-free mutants had faster flavin reduction kinetics and had less shielding of their FMN subdomains compared with wild type and no longer increased their level of FMN shielding in response to NADPH binding. Thus, Lys842 is critical for the known functions of the AI and also enables two additional functions of the AI as newly identified here: suppression of electron transfer to FMN and control of the conformational equilibrium of the nNOS reductase domain. Its effect on the conformational equilibrium probably explains suppression of catalysis by the AI.
Keywords: Electron Transfer, Enzymes/Nitric Oxide Synthase, Flavoproteins, Kinetics, Reductase, Autoinhibitory insert, FMN, Semiquinone, Calmodulin
Introduction
The nitric-oxide synthases (NOSs)3 generate nitric oxide (NO) from l-arginine by catalyzing two sequential monooxygenation reactions (1–3). The three mammalian NOS isoforms are composed of an N-terminal oxygenase domain that contains (6R)-tetrahydrobiopterin, heme, and an l-arginine binding site and a C-terminal reductase domain that contains FAD, FMN, and an NADPH binding site (4–10), with the domains being linked together by a central calmodulin (CaM)-binding element (4, 8). The NOS enzymes share a common electron transfer pathway (NADPH → FAD → FMN → heme) and mechanism for NO production. However, they exhibit different kinetic, biochemical, and regulatory behaviors due to some isozyme-specific structural features and the type of cells in which they are expressed (1–3, 11–14). In particular, the two constitutively expressed NOS isozymes (neuronal and endothelial NOS, nNOS, and eNOS) differ from the inducible NOS by virtue of their activity being dependent on reversible binding of CaM, which is governed through changes in the intracellular Ca2+ concentration (15–17). In fact, studies with nNOS and eNOS have shown that their electron transfer reactions (both input and output) are catalytically repressed in the CaM-free state. The repression appears to depend on unique structural elements that are present in the nNOS and eNOS flavoprotein domains, which otherwise are structurally and functionally similar to NADPH-cytochrome P-450 reductase and related dual-flavin reductases (18). The novel structural elements include a 20–40-amino acid extension at the C-terminal tail (CT) (19), several phosphorylation sites (20–23), and an autoinhibitory insert (AI) within the FMN-binding subdomain (24). Deletion of the AI of nNOS relieved some of the repression on NO synthesis and reductase activities and also affected the CaM/Ca2+-dependent activation of nNOS (25–28), confirming its role as an autoinhibitory element. Similar results were obtained for eNOS upon deletion of its AI (27, 29, 30). However, the molecular details of AI function are still unclear.
CaM/Ca2+ binding facilitates both intradomain (FAD to FMN) (31, 32) and interdomain (FMN to heme) electron transfer (33–35) in nNOS. Both processes are repressed in CaM-free nNOS (36, 37). The FMN module may need to swing away from the rest of the reductase domain in order to transfer electrons to acceptors like cytochrome c or the NOS ferric heme (36, 38, 39). Binding of CaM/Ca2+ causes a shift in the conformational equilibrium of nNOS, such that its reduced FMN module exists in a more deshielded state, enabling more efficient electron transfer (36, 37, 40). Although much is known about how the CT of nNOS helps to regulate the FMN conformational equilibrium in conjunction with NADPH binding (36, 37, 41, 42), what role the AI might play in regulating this critical equilibrium is completely unknown. It is also unclear which residues of the AI are key to its function regarding its effects on CaM binding and NOS catalytic activity. To address these issues, we mutated a conserved charged residue (Lys842; Fig. 1) in the AI of full-length nNOS and in our nNOS reductase domain construct (nNOSred) to test how charge neutralization and charge reversal at this site would affect AI function. Our results show that Lys842 helps the AI to have its known macroscopic effects (antagonizing CaM binding and suppressing cytochrome c reductase activity) and moreover reveal new molecular level roles for the AI in suppressing the rates of flavin reduction and in governing the conformational equilibrium of the reductase domain to favor the closed or FMN-shielded conformational state. Together, our results define for the first time a multifaceted mechanism by which the AI inhibits catalysis by nNOS in the CaM-free state.
FIGURE 1.

Top, amino acid sequence of the AI in Rat nNOS and bovine eNOS. The residues comprising the AI helix and the portion of the AI that is visible in the nNOSred crystal structure are indicated. The three canonical hydrophobic residues in the putative CaM binding motif of the AI are in boldface type. Lys842 is marked with an asterisk. Bottom, ribbon diagram of the nNOSred crystal structure that highlights the relative position of the AI and Lys842 in the FMN subdomain. The FMN subdomain is colored black, and the rest of the reductase domain is gray. Only the AI residues that are visible in the crystal structure are shown. The bound FAD and FMN molecules are shown as space-filling models. This figure was drawn using Protein Data Bank file 1TLL.
EXPERIMENTAL PROCEDURES
Materials
DE52-cellulose was purchased from Whatman Inc. 2′,5′-ADP-Sepharose 4B and CaM-Sepharose were products of Amersham Biosciences. 2′,3′-AMP and cytochrome c were obtained from Sigma. All other chemicals were of the highest grade available from commercial suppliers as reported previously (43–46).
Generation of Mutants
The bacterial expression vector pCWori contained cDNA that coded for wild type (WT) rat nNOS cDNA with a His6 tag attached to its N terminus (47, 48) or nNOSred with its adjacent N-terminal CaM binding motif (Met695–Ser1429) (37) as described previously. Site-directed mutagenesis was done using a QuikChange XL site-directed mutagenesis kit (Stratagene, La Jolla, CA). The oligonucleotide pairs 5′-AGAGAAAGAGCTACGCGGTCCGATTCAACA-3′ (3′-TCTCTTTCTCGATGCGCCAGGCTAAGTTGT-3′) and 5′-AGAGAAAGAGCTACGAG GTCCGATTCAACA-3′ (3′-TCTCTTTCTCGATGCTCCAGGCTAAGTTGT-5′) were used to generate the K842A and K842E mutants, respectively. Molecular biology techniques were performed using standard procedures or according to the manufacturer's instruction. Mutations were confirmed by DNA sequencing at the Cleveland Clinic genomics core facility.
Expression and Purification of WT and Mutant Enzymes
WT and mutant enzyme expression was induced at room temperature over 1 or 2 days in Escherichia coli BL21(DE3) that harbored the pACYC-CaM plasmid as described previously (37). WT nNOSred and mutants were purified using sequential 2′,5′-ADP-Sepharose and CaM affinity chromatography as reported previously (37). The full-length nNOS and mutants were purified by sequential Ni2+-Sepharose and 2′,5′-ADP-Sepharose affinity chromatography as previously described (45, 49).
Determination of Enzyme-bound Flavins
FAD and FMN were released from NOS samples by heat denaturation in a 95 °C water bath for 5 min in the dark and measured using a high pressure liquid chromatograph with fluorometric detection (50).
Assay of Enzymatic Activities
The ferricyanide reductase activity was determined by monitoring the absorbance decrease at 420 nm using an extinction coefficient of 1.02 mm−1 cm−1 in assays containing 1 mm ferricyanide and 0.3 mm NADPH. Cytochrome c reductase activity was determined from the absorbance increase at 550 nm using a difference extinction coefficient of 21 mm−1 cm−1 in assays containing 0.1 mm cytochrome c, 0.3 mm NADPH. The rate of NO synthesis was determined from the NO-mediated conversion of oxyhemoglobin to methemoglobin using a difference extinction coefficient of 49 mm−1 cm−1 at 401 nm in reactions containing 10 μm oxyhemoglobin, 0.1 mm NADPH, 10 μm (6R)-tetrahydrobiopterin, and 1 mm l-arginine. The NADPH oxidation rate was measured from the absorbance decrease at 340 nm using an extinction coefficient of 6.22 mm−1 cm−1. All assays were performed in cuvettes at 25 °C in 40 mm EPPS buffer (pH 7.6) containing 10% glycerol, 10 units/ml superoxide dismutase, 100 units/ml catalase, 0.5 μm FAD/FMN, and 50 μm EDTA, using a Hitachi U-3110 spectrophotometer. In some reactions, 0.5 mm Ca2+ and 5 μm CaM were also added.
Kinetics of Heme and Flavin Reduction
Rapid mixing reactions were performed in a SF-51MX stopped-flow spectrophotometer (HiTech Ltd.), which had a dead time of 2 ms and was equipped with an anaerobic workbox. All stopped-flow experiments were performed at 10 °C in 40 mm EPPS buffer, pH 7.6, containing 150 mm NaCl. The rate of heme reduction was determined by monitoring the absorbance increase at 444 nm, which indicated formation of the ferrous heme-CO complex as previously described (41, 49). Reactions were initiated by rapid mixing an anaerobic CO-saturated solution containing 50 μm NADPH with an anaerobic CO-saturated solution containing 5 μm of WT or mutant nNOS in 40 mm EPPS buffer, pH 7.6, containing 10 μm (6R)-tetrahydrobiopterin, 1 mm l-arginine, 10 μm CaM, and 1 mm Ca2+.
The kinetics of flavin reduction were studied by rapid mixing stopped-flow analysis of reactions that mixed nNOSred enzymes with excess NADPH or 1 molar eq of NADPH under anaerobic conditions at 10 °C using a stopped-flow apparatus and diode array detector (Hi-Tech Scientific KinetAsyst SF-61DX2) equipped for anaerobic analysis. In some experiments, single wavelength data were obtained in identical reactions run in a HiTech Ltd. SF-51MX equipped with photomultiplier detection equipped for anaerobic analysis. The procedures used were similar to those described previously (37). Briefly, the fully oxidized or 1-electron-reduced forms of nNOSred proteins were diluted to 5–10 μm (for nNOSred) and then rapidly mixed with a 10-fold molar excess of NADPH. In some cases, a 5- or 15-fold molar excess of NADPH was used. Also, in some cases, residual NADP+ present in the NADPH solutions or in the 1-electron-reduced enzyme samples was eliminated by adding an enzymatic NADPH-regenerating system (consisting of 2–6 units of glucose-6-phosphate dehydrogenase and 2–6 mm glucose-6-phosphate, depending on molar ratio of NADPH to enzyme) or by passing the NADPH-reduced proteins through a G-25 desalting column prior to use, respectively. To analyze CaM-bound enzyme samples, EDTA was replaced with CaCl2 (2 mm) and CaM (15–20 μm). Averaged spectra or absorbance traces were compiled from 7–10 reactions, and the traces at various wavelengths were fit to single or multiple exponential functions using software provided by the instrument manufacturer. Only the observed flavin absorbance change apparent in the traces was used for fitting (the fitting does not include any absorbance change that was calculated to take place in the mixing dead time). The percentage of flavin reduction that takes place in the instrument mixing dead time was calculated after obtaining absorbance traces from control stopped-flow reactions that rapidly mixed the same enzyme solutions described above with buffer that did not contain NADPH, as previously described in detail (37).
Anaerobic Pre-steady-state Cytochrome c Reduction
The rate of cytochrome c reduction by an excess of prereduced nNOSred proteins under various conditions was measured in the stopped-flow apparatus (SF-51MX, HiTech Ltd.) at 10 °C as described previously (37). Briefly, each nNOSred protein (16 μm) was prereduced using a slide projector bulb in a sealed cuvette in buffer containing EDTA (1 mm), 5-deazariboflavin (catalytic amount), glucose oxidase (10 units/ml), catalase (134 units/ml), and glucose (2 mm). To analyze CaM-bound samples, EDTA was replaced with glycine, and CaCl2 (2 mm) and CaM (25 μm) were included. The photoreduced proteins were incubated with (1 mm) or without NADPH and then rapidly mixed with cytochrome c (4 μm) while recording the absorbance changes at 550 nm. Multiple absorbance traces were averaged and fit to a single exponential function.
EGTA Titration of CaM-bound WT nNOS and Mutants
The CaM-bound WT nNOS and mutants were titrated with EGTA in a range of final concentration from 1 to 50 μm, and their rates of NO synthesis and concurrent NADPH oxidation were measured. The assay conditions were as described above. The concentrations of CaM-bound WT nNOS and mutants in the reaction mixture were 20 nm. An initial concentration of 20 μm Ca2+ was added into each of the reaction mixtures prior to the EGTA titration.
RESULTS
Protein Expression
The mutant proteins could be expressed in amounts that were similar to those of WT proteins, and they all contained 1 FAD and 1 FMN per NOSred molecule or per NOS heme.
Steady-state Catalytic Activities
Table 1 lists the NO synthesis, NADPH oxidation, cytochrome c reductase, and ferricyanide reductase activities we obtained for nNOS and the Lys842 mutants. The WT and mutant enzymes (K842A and K842E nNOS) required CaM/Ca2+ binding for NO synthesis. NO synthesis activity was lower only in the K842A mutant. Corresponding rates of NADPH oxidation during NO synthesis were comparable with WT nNOS although somewhat higher in the K842E mutant. In the absence of CaM/Ca2+, the K842A and K842E mutants had 3- and 4-fold greater rates of NADPH oxidation, respectively, than WT nNOS. Both nNOS mutants also had greater cytochrome c reductase activities (∼1.5-fold for K842A and ∼2.9-fold for K842E nNOS) in the absence of CaM/Ca2+ (Table 1). The ferricyanide reductase activities of the mutants were similar to WT nNOS in the absence or presence of CaM/Ca2+.
TABLE 1.
Steady-state catalytic activities of nNOS and the Lys842 mutants
Rates were measured at 25 °C as described under “Experimental Procedures.” Values represent the mean ± S.D. of three independent measurements with two preparations of each enzyme. ND, not detected.
| Enzyme | CaM | NO synthesis | NADPH Oxidation | Cytochrome c reduction | K3Fe(CN)6 reductase |
|---|---|---|---|---|---|
| min−1 | min−1 | min−1 | min−1 | ||
| nNOS WT | + | 42 ± 2.9 | 168 ± 2.2 | 4941 ± 100 | 10486 ± 796 |
| − | ND | 4.6 ± 0.1 | 511 ± 13 | 7825 ± 252 | |
| K842A | + | 32 ± 2.2 | 114 ± 2.1 | 3417 ± 12 | 9098 ± 314 |
| − | ND | 18 ± 0.2 | 754 ± 38 | 7294 ± 209 | |
| K842E | + | 40 ± 1.5 | 186 ± 0.5 | 4547 ± 220 | 10087 ± 283 |
| − | ND | 23 ± 0.2 | 1471 ± 81 | 7104 ± 265 |
The Lys842 mutations altered the cytochrome c reductase activity of nNOSred in a manner similar to that observed for full-length nNOS (Fig. 2). The activities of the CaM-free K842A and K842E mutants were ∼1.9- and ∼3.1-fold greater than WT nNOSred, respectively. The activity of the CaM-free K842E mutant was 65% of the value obtained in its CaM-bound state. Together, the data indicate that Lys842 helps the AI repress the cytochrome c reductase activity and the NADPH oxidase activity of nNOS in the CaM-free state and may also help to fully enable NO synthesis in CaM-bound nNOS.
FIGURE 2.

Steady-state cytochrome c reductase activities of WT nNOSred and Lys842 mutants in the absence and presence of CaM. Activities were measured at 25 °C in the presence of superoxide dismutase and in either the absence or presence of CaM. Values are representative of three measurements done under identical conditions using two different protein preparations for each enzyme.
CaM/Ca2+ Concentration Dependence
Deleting the AI enables nNOS to bind CaM at lower Ca2+ concentrations (25, 26). We investigated the importance of Lys842 by titrating the CaM-bound mutants with the Ca2+ chelator, EGTA, and measuring their NO synthesis and NADPH oxidation activities under each condition relative to WT nNOS. All experiments contained 20 μm free Ca2+ at the start to normalize the free Ca2+ concentration. As shown in Fig. 3, A and B, both of the Lys842 mutants required greater concentrations of EGTA than WT nNOS to lose their CaM-dependent NADPH oxidation and NO synthesis activities. The results indicate that Lys842 is an essential component of the AI that helps it to antagonize Ca2+-dependent CaM binding to nNOS.
FIGURE 3.

NADPH oxidase (A) and NO synthesis (B) activities of WT nNOS and Lys842 mutants as a function of EGTA concentration in the presence of 20 μm free Ca2+. Values are representative of three measurements done under identical conditions using two different protein preparations for each enzyme. S.E. fell within 15% in all cases, and error bars were omitted for clarity.
Flavin Reduction Kinetics in Fully Oxidized nNOS Enzymes
NADPH-dependent flavin reduction is kinetically repressed in CaM-free nNOS (37). We utilized stopped-flow spectroscopy to determine how the Lys842 mutations might affect the kinetics of flavin reduction in fully oxidized CaM-free nNOS (i.e. containing FAD and FMN) by an excess of NADPH. In this circumstance, flavin reduction should occur in the following sequential steps: a rapid hydride transfer from NADPH to FAD, two 1-electron transfers from FAD to FMN, and then further reduction of the FAD by a second molecule of NADPH or by other reduced nNOSred molecules in solution4 (Scheme 1). The flavin reduction rates were calculated from the absorbance decrease obtained at 485 nm after mixing the oxidized enzymes with excess NADPH. Representative traces for the CaM-free WT and K842E nNOS proteins are shown in Fig. 4A. All traces could be fit reasonably well to a two-phase exponential equation. The observed rate constants obtained for WT nNOS and the two Lys842 mutants are reported in Table 2. Both phases of flavin reduction were found to be faster in the mutants than in WT nNOS under the CaM-free conditions. In contrast, the CaM-bound mutant and wild type enzymes had similar rates of flavin reduction.
SCHEME 1.
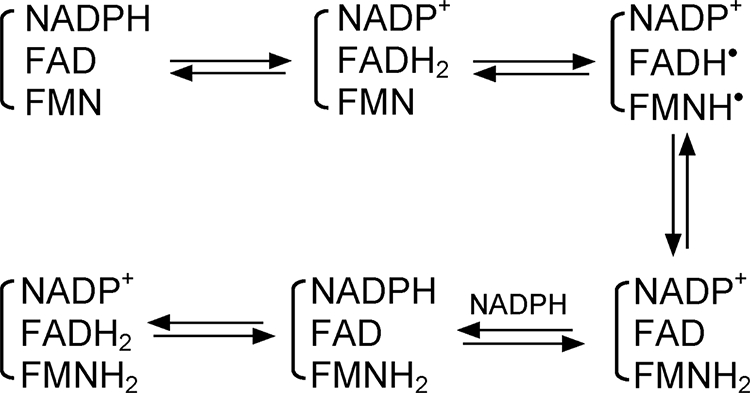
Flavin reduction.
FIGURE 4.
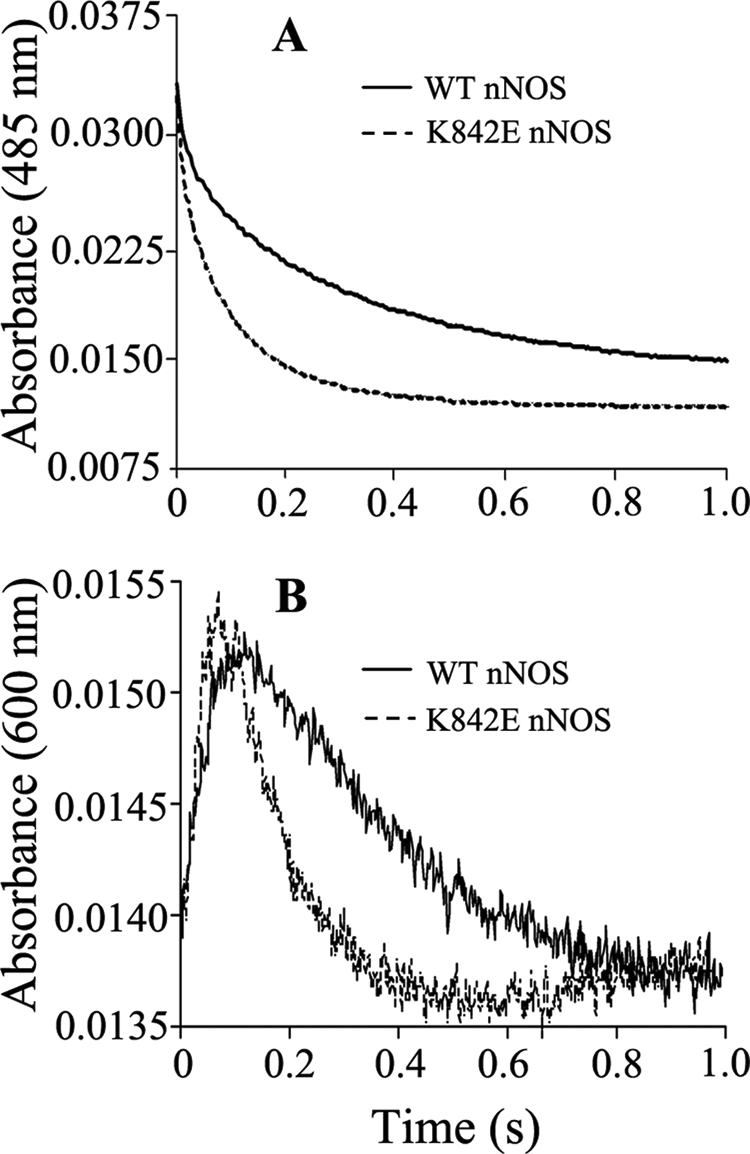
Kinetics of anaerobic flavin reduction in CaM-free WT and K842E nNOS mutant by excess NADPH. Spectral change was recorded at 485 nm (A) and 600 nm (B) in a stopped-flow spectrophotometer after rapidly mixing 5 μm enzyme with a 10-fold excess of NADPH at 10 °C as described under “Experimental Procedures.” The rate constants obtained by fitting these data to biexponential functions. Final concentrations after mixing were as follows: nNOSred enzymes, 2.5 μm; NADPH, 25 μm.
TABLE 2.
Heme reduction and flavin reduction of nNOS and the Lys842 mutants
All reactions were carried out at 10 °C under anaerobic conditions in a stopped-flow spectrophotometer as described under “Experimental Procedures.” k1 and k2 refer to the rates for biphasic reactions. The values for flavin and heme reduction in wild-type and mutant NOSs are the mean ± S.D. of 7–10 individual reactions and are representative of experiments done with two different enzyme preparations. The numbers in parentheses indicate the percentage of absorbance change attributed to the fast phase (k1). ND, not detected.
| Enzyme | CaM | Flavin reduction |
Heme reduction (k) | |
|---|---|---|---|---|
| k1 | k2 | |||
| s−1 | s−1 | |||
| nNOS WT | + | 72 ± 1.5 (40%) | 8.0 ± 0.05 | 3.6 ± 0.01 |
| − | 7.3 ± 0.2 (45%) | 1.5 ± 0.01 | ND | |
| K842A | + | 53 ± 1.3 (52%) | 9.1 ± 0.1 | 2.4 ± 0.01 |
| − | 22 ± 0.6 (55%) | 5.0 ± 0.1 | ND | |
| K842E | + | 78 ± 3.0 (40%) | 10 ± 0.1 | 3.2 ± 0.01 |
| − | 34 ± 0.7 (44%) | 6.7 ± 0.07 | ND | |
We also examined the absorbance change at 600 nm that occurred during the flavin reduction experiments noted above, because absorbance change at this wavelength can indicate the buildup and subsequent reduction of flavin semiquinone species during the flavin reduction reactions (Scheme 1). As shown in Fig. 4B, the absorbance at 600 nm increased rapidly and then decayed after mixing the CaM-free K842E or WT nNOS enzymes with excess NADPH. The rates of absorbance increase and decay at 600 nm were faster in the K842E mutant than in WT nNOS. The peak absorbance at 600 nm was reached more quickly in the K842E nNOS reaction (50 ms) than in the WT reaction (85 ms). This is consistent with the kinetic differences we observed at 485 nm (Fig. 4A) and implies that the CaM-free K842E mutant has faster flavin semiquinone formation and flavin semiquinone reduction relative to WT nNOS during the reduction by excess NADPH.
Kinetics of Flavin Reduction in Fully Oxidized nNOSred Enzymes
We next performed a more extensive investigation of flavin reduction kinetics using the nNOSred protein constructs in order to extend our initial findings with the full-length nNOS proteins. Reactions were run by mixing the fully oxidized nNOSred proteins with a 10-fold molar excess of NADPH at 10 °C under anaerobic conditions in stopped-flow diode array and single wavelength spectrophotometers. Fig. 5 contains representative absorbance traces at 457 nm from reactions of the K842E and WT nNOSred proteins in their CaM-free and CaM-bound states. The traces fit best to a triple exponential equation, and the rates derived with the different nNOSred proteins are listed in Table 3. A significant proportion (20–30%) of the total absorbance decrease at 457 nm occurred in the mixing dead time of the instrument in these reactions, consistent with previous reports (37) and with the reactions involving a rapid initial hydride transfer step from NADPH to FAD. The results indicate that the K842E (Table 3) and K842A nNOSred (data not shown) have generally faster rates of flavin reduction than does WT nNOSred in the CaM-free condition, similar to what we observed for the full-length nNOS proteins. The flavin reduction rates obtained in reactions of the CaM-bound nNOSred proteins indicate that they all were increased and became similar in this condition.
FIGURE 5.

Kinetics of anaerobic flavin reduction in WT and K842E nNOSred by excess NADPH (457 nm). Stopped-flow traces were collected at 457 nm after rapidly mixing 7–8 μm oxidized WT nNOSred (top) and K842E nNOSred (bottom) with a 10-fold excess of NADPH at 10 °C, as described under “Experimental Procedures.” The point of maximum absorbance prior to any reduction is indicated in each panel with arrows. The three individual rate constants obtained by fitting these data to multiple exponential functions are reported in Table 3. Final concentrations after mixing were as follows: nNOSred enzymes, 3.5–4.0 μm; NADPH, 35–40 μm.
TABLE 3.
Rates of anaerobic flavin reduction of nNOSred proteins by excess NADPH at 457 nm
Reductions were carried out in the stopped-flow instrument at 10 °C with a 10-fold excess of NADPH while monitoring the absorbance changes at 457 nm. Data were fit to a triple exponential function as described under “Experimental Procedures.”
| Enzyme | Conditions | Dead timea | k1b | k2b | k3b |
|---|---|---|---|---|---|
| % | s−1 | s−1 | s−1 | ||
| Wild type | −CaM | 30 | 63 ± 7.2 (24%) | 6 ± 0.28 (31%) | 0.86 ± 0.022 (15%) |
| +CaM | 21 | 146 ± 3.7 (21%) | 15 ± 0.6 (33%) | 2.2 ± 0.16 (25%) | |
| K842E | −CaM | 31 | 157 ± 5.7 (33%) | 23 ± 2 (10%) | 3.8 ± 0.3 (26%) |
| +CaM | 25 | 161 ± 8 (42%) | 28 ± 2.3 (14%) | 7.6 ± 0.4 (19%) |
a Percentage of the total absorbance change occurring in the instrument dead time.
b Individual rate constants are reported as follows: calculated rate (s−1) and percentage of the total absorbance change for this process in parentheses.
Fig. 6, A and B, contains representative absorbance traces at 600 nm that were obtained during reactions of the fully oxidized, CaM-free, or CaM-bound forms of K842E and WT nNOSred proteins with a 10-fold molar excess of NADPH. The absorbance increase and decrease at 600 nm in this circumstance can indicate the rates of buildup and subsequent reduction of flavin semiquinone species that must form during the reductive reaction (Scheme 1). We monitored these reactions using a single wavelength detector over a relatively short time frame (main panels) and over a somewhat longer time frame (insets), in order to determine and compare the rates of change at 600 nm as accurately as possible. In all cases, we observed an initial rapid buildup of absorbance at 600 nm that reached a plateau and then decreased to achieve absorbance levels that remained above the initial value.5 The remaining absorbance at 600 nm that is apparent at the end of the collection periods (relative to the initial values) may indicate a contribution from a transient NADP+-FADH2 charge transfer complex. Overall, this finding is consistent with maximal flavin radical formation occurring upon electron transfer from the FAD hydroquinone to FMN, followed by further import of electrons into enzyme flavins from additional NADPH as the reaction proceeds (Scheme 1). The absorbance buildup and decay phases fit reasonably well to monophasic transitions in all cases, and the observed rates are reported in Table 4. Companion diode array spectra that we obtained in replica reactions that mixed 10-fold molar excess NADPH with the fully oxidized, CaM-free nNOSred proteins are shown in supplemental Fig. S1. The diode array spectra show that the absorbance buildup at 600 nm was relatively small in all reactions, consistent with previous data obtained for WT nNOSred (37, 51). Despite this, the CaM-free K842E nNOSred had a significantly faster buildup and decay of the 600 nm absorbance during its reduction with excess NADPH as compared with WT nNOSred. CaM binding to the WT protein increased its absorbance buildup and decay rates at 600 nm, as reported previously (37), whereas CaM binding to the K842E mutant caused only small additional rate increases.
FIGURE 6.

Kinetics of anaerobic flavin reduction in WT and K842E nNOSred by excess NADPH (600 nm). Stopped-flow traces were collected at 600 nm after rapidly mixing 7–8 μm CaM-free oxidized WT nNOSred or K842E nNOSred (A) and CaM-bound oxidized WT nNOSred or K842E nNOSred (B) with a 10-fold excess of NADPH at 10 °C as described under “Experimental Procedures.” Inset, plots obtained from collecting traces for longer time frames. Rate constants obtained by fitting the absorbance increase and decrease to single exponential functions are reported in Table 4. The calculated best fit curves are plotted as solid lines. Final concentrations after mixing were as follows: nNOSred enzymes, 3.5–4.0 μm; NADPH, 35–40 μm.
TABLE 4.
Rates of anaerobic flavin reduction of nNOSred proteins by excess NADPH at 600 nm
Reductions were carried out in the stopped-flow instrument at 10 °C with a 10-fold excess of NADPH while monitoring the absorbance changes at 600 nm as described under “Experimental Procedures.” All rates are the result of fitting absorbance changes to a single exponential function.
| Enzyme | Conditions | Increase | Decrease |
|---|---|---|---|
| s−1 | s−1 | ||
| Wild type | Without CaM | 56 ± 1.4 | 2.3 ± 0.2 |
| With CaM | 160 ± 6 | 8 ± 1 | |
| K842E | Without CaM | 253 ± 6 | 42 ± 3 |
| With CaM | 290 ± 7.5 | 54 ± 5 |
The rates of flavin reduction in nNOSred can be dependent on the NADPH concentration (51) and can also be affected by NADP+ (52). To assess whether the kinetic differences in flavin reduction that we observed between K842E and WT nNOSred were due to a difference in their interactions with NADPH or NADP+, we repeated the stopped-flow analyses described above but this time using a 5- or 15-fold molar excess of NADPH or using NADPH solutions that had all of their residual NADP+ converted to NADPH by inclusion of an enzymatic NADPH-regenerating system. In all cases, these modifications caused 15% or less change in the flavin transition rates at 600 nm (data not shown) that we had observed in our studies using a 10-fold molar excess of NADPH (Table 4). This suggests that the kinetic differences we observed between WT and K842E nNOSred were not due to possible differences in their interactions with NADPH or NADP+.
Because of the relatively small amplitude changes we observed at 600 nm during the reductive reactions, we also compared the kinetics of the coincident absorbance change at 700 nm, which can indicate the buildup of a charge transfer complex that forms after the bound NADPH transfers a hydride to FAD (i.e. the NADP+/FADH2 species) (37). As shown in supplemental Fig. S2, there was a very fast buildup of absorbance at 700 nm that mostly preceded the buildup of absorbance at 600 nm in the same reaction and then a rapid decay in absorbance at 700 nm during further buildup of the 600 nm absorbance. This is consistent with the absorbance change at 700 nm reflecting a rapid hydride transfer to FAD and formation of a NADP+/FADH2 charge transfer complex. Together, the results are consistent with faster interflavin electron transfer in the CaM-free Lys842 mutant proteins, which in turn enables a faster rate of flavin semiquinone formation during the reductive reaction.
Kinetics of Flavin Reduction Using 1 Molar Eq of NADPH
We also compared flavin reduction in the fully oxidized enzymes upon mixing with 1 molar eq of NADPH. In such cases, the reaction involves the initial hydride transfer from NADPH to FAD and then equilibration of the two electrons between the FAD and FMN cofactors. Because of the more positive midpoint potential of the FMN/FMNsq couple, the system will ultimately achieve a thermodynamic equilibrium where the primary species is the flavin disemiquinone with maximal absorbance at 600 nm.
Supplemental Fig. S3 and supplemental Table S1 contain representative spectroscopic and kinetic data collected in stopped-flow experiments with the CaM-free enzymes. Their reduction by 1 eq of NADPH generated initial spectral changes (0.2 s spectra) that were very similar to what we observed in reactions done with excess NADPH and indicate that there was a mixture of charge transfer complex and flavin semiquinone species present in both the WT and K842E nNOSred reactions at this point. Spectra collected after longer reaction times indicate that both enzymes eventually formed their flavin disemiquinone species. The kinetic traces at 600 nm show that the K842E mutant had faster absorbance transitions than the WT enzyme (supplemental Table S1), consistent with the results we obtained using excess NADPH. The slow rates of flavin disemiquinone formation for either enzyme in the single equivalent reactions probably reflects a poor capacity of the NADP+-FADH2 complex to reduce the FMN cofactor (53). This observation highlights the importance of excess NADPH, as would normally be present, in driving flavin reduction in nNOSred.
Kinetics of Flavin Reduction in One-electron-reduced nNOSred Enzymes
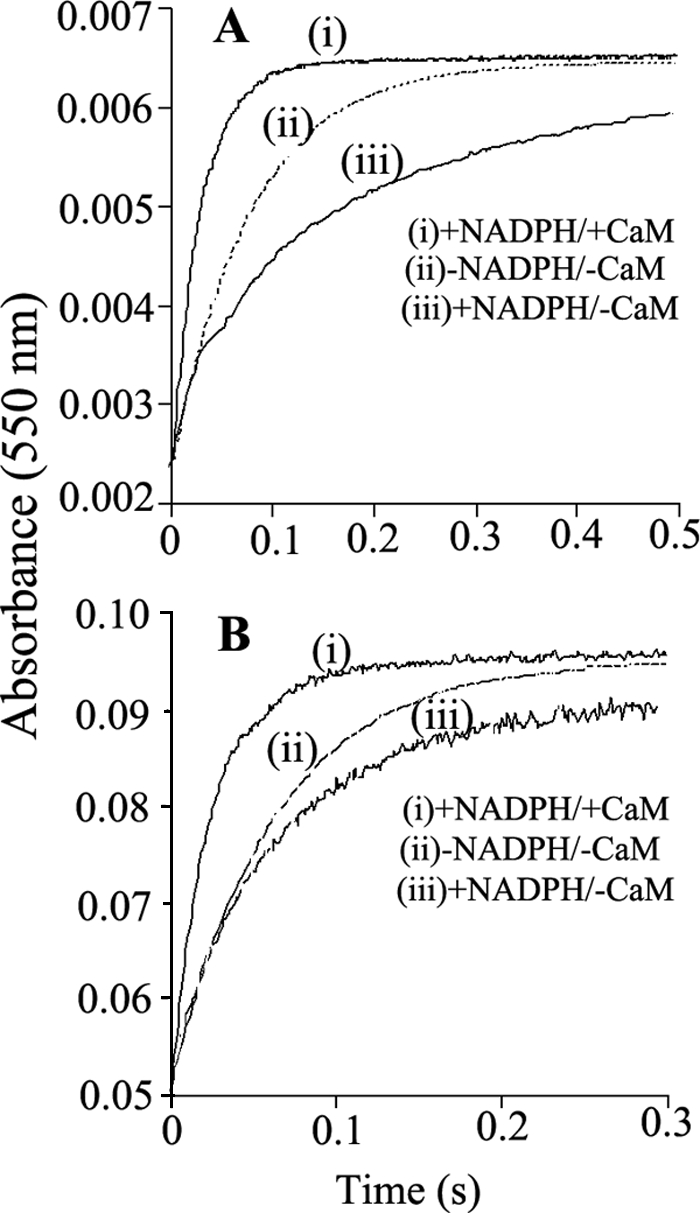
A characteristic absorption peak at 520 nm has been attributed to the FAD semiquinone species (FADH·) in human nNOS (11, 31). This provides a means to follow interflavin electron transfer in the one-electron-reduced form of nNOSred (which contains an air-stable FMN semiquinone) by monitoring the absorbance increase at 520 nm during reduction of the enzyme with NADPH (31) (Scheme 2). We first checked if the 520 nm absorbance peak previously associated with FAD semiquinone formation in human nNOS would also form in rat nNOSred. As shown in Fig. 7A, a 520 nm absorbance peak built up during the steady-state reaction of CaM-free nNOSred as it catalyzed NADPH oxidation. Identical spectral changes were observed during NADPH oxidation by K842A and K842E nNOSred (data not shown). We then generated the air-stable semiquinone form (i.e. FAD/FMNH·) of our CaM-free WT and mutant nNOSred enzymes for stopped-flow studies by incubating them with a 5-fold molar excess of NADPH and allowing them to air-oxidize at room temperature for 20 min. As shown in Fig. 7, B and C, when the air-stable semiquinone form of WT or K842E nNOSred was mixed with a 10-fold excess of NADPH in the stopped-flow spectrophotometer, we observed an absorbance increase at 520 nm that indicated the conversion from FADH2/FMNH· to FADH·/FMNH2 (subsequent to an initial, fast hydride transfer from NADPH to FAD, as summarized in Scheme 2). A similar reaction was also run to measure the rate of absorbance change at 520 nm in the one-electron-reduced, CaM-bound K842E nNOSred upon mixing with NADPH (supplemental Fig. S4). All of the absorbance traces at 520 nm fit well to a single phase exponential equation and gave observed rate constants of 13.5 ± 0.4, 30.2 ± 1.0, and 35.8 ± 1.0 s−1 for the CaM-free WT, K842A, and K842E nNOSred, respectively, and 54 ± 2.0 s−1 for the CaM-bound K842E nNOSred. Companion experiments showed that removal of residual NADP+ from the one-electron-reduced enzyme samples prior to their use in the stopped-flow study did not alter the rates of absorbance change we observed at 520 nm (data not shown). The results indicate that interflavin (FADH2 to FMNH·) electron transfer is also faster in the one-electron-reduced, CaM-free Lys842 mutants than in the WT nNOSred, such that the rates observed in the CaM-free mutants approach that seen in the CaM-bound enzyme.
SCHEME 2.
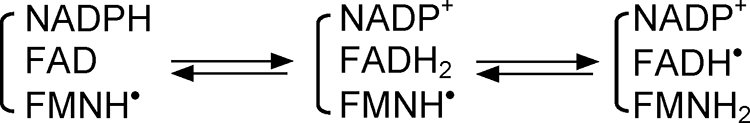
Reduction of nNOSred with NADPH.
FIGURE 7.

Kinetics of electron transfer between FAD hydroquinone and FMN semiquinone in nNOSred and the K842E mutant. A, representative spectra recorded in air-saturated buffer at room temperature: oxidized WT nNOSred (i) and nNOSred immediately (ii) and 2 min (iii) after receiving a 10-fold molar excess of NADPH and after all of the NADPH had been oxidized (iv). Wavelengths that indicate general flavin reduction (457 nm), formation of the FAD semiquinone (520 nm), and general formation of flavin semiquinones (600 nm) are indicated. B and C, absorption change at 520 nm obtained after mixing the air-stable semiquinone forms of WT nNOSred (B) or K842E nNOSred (C) with NADPH. Final concentrations after mixing were as follows: nNOSred enzymes, 5 μm; NADPH, 50 μm. Lines of best fit are shown as dashed lines. Insets, absorbance changes recorded over a longer time period (200 ms). Kinetic traces shown are the average calculated from 8–10 mixing experiments each.
Conformational Equilibrium of the FMN Module
The cytochrome c reductase activity of CaM-free nNOSred is inversely dependent on the degree of FMN shielding, and the shielding is increased when NADPH is bound (36, 37, 41, 42). It is unknown if the AI has a role in this process. We therefore investigated if the Lys842 mutations impact the FMN shielding level in nNOSred by performing single turnover cytochrome c reduction reactions in the stopped-flow instrument (37, 42). In these experiments, the rate of absorbance increase at 550 nm, which represents cytochrome c reduction by an excess of a prereduced nNOSred protein, is inversely proportional to the degree of FMN shielding and to the relative ratio of the FMN-shielded (or closed) versus FMN-deshielded (or open) conformation of the nNOSred.
Fig. 8 contains representative absorbance traces collected for the WT (A) and K842E (B) nNOSred reactions that were run under three different experimental conditions: CaM- and NADPH-free, CaM-free and NADPH-bound, and CaM plus NADPH-bound. The first condition reports on the intrinsic set point of the conformational equilibrium for the given nNOSred protein being studied. The second and third conditions indicate the impacts of NADPH and CaM, respectively, on the conformational equilibrium. Identical experiments were also done with the K842A mutant (data not shown). All of the kinetic traces fit well to a single exponential equation. In the reactions with WT nNOSred, the traces show that bound NADPH slowed the rate of electron transfer to cytochrome c, whereas CaM increased the rate relative to the CaM-free enzyme (with or without NADPH), as reported previously (36, 37, 41). In contrast, the K842E mutant had a greatly blunted response to NADPH but had a relatively normal response to CaM. Calculated rate constants for the three enzymes are listed in Table 5. The rate values are proportional to the percentage of FMN-deshielded conformer that is present at equilibrium for the particular protein or experimental condition. The data indicate that the intrinsic set point for the conformational equilibrium of nNOSred is perturbed by the Lys842 mutations, such that a greater percentage of the CaM-free K842E and K842A mutants exist in an FMN-deshielded conformation, with the rank order being K842E > K842A ≫ WT. In contrast to WT, neither mutant significantly increased its FMN shielding in response to NADPH binding. However, CaM decreased the level of FMN shielding in both mutants, such that their conformational equilibrium became similar to that of the CaM-bound WT nNOSred. These results reveal that the Lys842 mutations and, by extension, the AI have a significant effect on the conformational equilibrium of nNOSred in the CaM-free condition.
FIGURE 8.
Stopped-flow traces illustrating the NADPH-dependent activation or inhibition of electron transfer to cytochrome c in prereduced WT and K842E nNOSred. Photoreduced samples of WT (A) and K842E (B) nNOSred with and without NADPH and CaM, as indicated, were prepared and rapidly mixed with a substoichiometric amount of cytochrome c in the stopped-flow instrument at 10 °C, as described under “Experimental Procedures” while recording the absorbance increases at 550 nm. Rate constants obtained by fitting these data to single exponential functions are reported in Table 4. The calculated best fit curves to the traces shown here are plotted as dotted lines. The kinetic traces shown are the average calculated from 8–10 mixing experiments each. Final concentrations after mixing were as follows: nNOSred enzymes, 8 μm; cytochrome c, 2 μm.
TABLE 5.
Effect of CaM and NADPH on FMN shielding in fully reduced nNOSred and the Lys842 mutants
An excess of each prereduced NOSr protein in the presence or absence of NADPH and CaM was mixed with cytochrome c in a stopped-flow instrument under anaerobic conditions at 10 °C. All reactions were initiated by mixing 16 μm photoreduced nNOSred proteins with 4 μm cytochrome c. The observed rates of absorbance increase at 550 nm are reported as the mean ± S.D. of 5–6 single mixing experiments and are representative of at least two different enzyme preparations.
| NADPH/CaM | Wild type | K842A | K842E |
|---|---|---|---|
| s− | s− | s− | |
| −/− | 11.6 ± 0.3 | 14.8 ± 0.3 | 18.8 ± 0.5 |
| +/− | 3.8 ± 0.06 | 12.9 ± 0.3 | 14.6 ± 0.1 |
| +/+ | 35.7 ± 0.2 | 36.8 ± 0.8 | 35.4 ± 0.5 |
Heme Reduction in WT nNOS and Mutants
It is unclear how the AI might impact the heme reduction rate in nNOS. We compared the rates of heme reduction in the CaM-bound mutants and WT nNOS. The experiments involved mixing each CaM-bound nNOS protein with excess NADPH in CO-saturated, anaerobic buffer in a stopped-flow spectrophotometer and monitoring the buildup of the ferrous heme-CO complex at 444 nm, which indicates heme reduction (43, 44). The absorbance gains we observed at 444 nm were monophasic in all cases and gave the heme reduction rates listed in Table 2. The heme reduction rate was somewhat slower (66% of WT) in K842A nNOS but approached the normal value in K842E nNOS, consistent with their measured NO synthesis activities in Table 1. This indicates that interdomain (FMN to heme) electron transfer can in one case be negatively affected by mutating Lys842 in the AI of nNOS.
DISCUSSION
The AI is unique to the NOS family of flavoproteins, and its mechanisms of action are of current interest. Previous studies showed that deleting the entire AI changes the catalytic profile of CaM-free nNOS and increases its affinity toward CaM binding (25, 26). Our Lys842 point mutants displayed these two characteristic properties of AI-deleted nNOS, namely an increased cytochrome c reductase activity under CaM-free conditions and an ability to bind CaM at lower Ca2+ concentration. The Lys842 mutants also had no detectable NO synthesis activity in the absence of CaM, which matches the findings in three of four reports for AI-deleted nNOS (26–28) (one AI-deleted nNOS was reported to support 10–30% maximal NO synthesis activity in the absence of CaM) (25). In the CaM-bound condition, we observed a partial loss of NO synthesis activity only in K842A nNOS, which correlated with a lower rate of heme reduction in this mutant. In comparison, among the four AI-deleted, CaM-bound nNOS reported in the literature, one had normal NO synthesis activity (27), one had a 40% reduction in activity (28), and two others had significantly lower activities (70–80% reductions) (25, 26), although in one case this was attributed to the mutant having a substoichiometric FMN content (26). On balance, this comparison suggests that Lys842 enables AI function in nNOS, particularly the ability of AI to antagonize CaM binding and repress the cytochrome c reductase activity in the CaM-free state. Beyond this, we also found that the Lys842 mutations altered other important aspects of catalysis that had not been examined before in any of the AI-deleted nNOS. These are discussed below.
Flavin Reduction Kinetics
The CaM-free Lys842 mutants had faster overall rates of NADPH-dependent flavin reduction (as judged by absorbance changes at 457 or 485 nm) compared with WT nNOS. This implies that the mutations eased the kinetic repression on flavin reduction in CaM-free nNOS and thus reveal for the first time a role for the AI in this fundamental regulation.
Our data also indicate which part of the flavin reduction process (FAD reduction by NADPH versus the FAD to FMN electron transfer) is suppressed by the AI and is relieved by the Lys842 mutations. Consider that the CaM-free Lys842 mutants showed no increase in their ferricyanide reductase activity (Table 1). Based on previous work with nNOS (11, 31, 51, 54), the ferricyanide reductase activity would have increased if the Lys842 mutations had increased the rate of FAD reduction by NADPH. Thus, the steady-state activity data suggest that the AI restricts its suppressive effect to the subsequent interflavin (FAD to FMN) electron transfer step. This model for AI function is supported by our stopped-flow studies that either monitored the formation of flavin semiquinones during NADPH reduction of the fully oxidized nNOSred proteins (600 nm) or monitored FADsq formation during NADPH reduction of the one-electron-reduced nNOSred proteins (520 nm). In both circumstances, we observed significantly faster rates of absorbance increase in the CaM-free Lys842 mutants compared with CaM-free WT nNOSred. The spectroscopic data we collected for the fully oxidized proteins when reacted with either molar equivalent or excess NADPH suggest that the observed changes in amplitude at 600 nm were due to a blended contribution from flavin semiquinone formation and formation of an NADP+-FADH2 charge transfer complex. We were able to kinetically resolve the formation and decay of these two species to some extent (see supplemental Fig. S2). We also found that the absorbance changes attributed to flavin semiquinone formation (or FADsq at 520 nm) in the CaM-free mutants were almost as fast as the rates we observed in the CaM-bound nNOSred. This implies that the Lys842 mutations incorporated into the AI relieved the kinetic suppression of interflavin electron transfer almost as well as CaM.
The rates of flavin semiquinone formation we observed during reduction of the fully oxidized enzymes (600 nm data sets) were faster in magnitude than the rates of FADsq formation that we observed during reduction of the one-electron-reduced enzymes (520 nm data sets). This difference is probably due to a large difference in thermodynamic driving force that exists in the two circumstances regarding the interflavin electron transfer step. With the fully oxidized enzymes, the reaction involves electron transfer from FADH2 to FMN to form the FMNsq, which is thermodynamically favorable and essentially an irreversible reaction (51, 52). In contrast, with the one-electron-reduced enzymes, the reaction involves electron transfer from FADH2 to FMNsq to form FMNH2, which is nearly an equipotential reaction (51, 52). This means that the back electron transfer (FMNH2 to FADsq) will contribute substantially to the rate that we observe during the anaerobic reduction of the one-electron-reduced proteins by NADPH. However, during steady-state catalysis, where an electron acceptor like cytochrome c is present to drive the equilibrium, the rate of the FAD to FMNsq electron transfer step is likely to be closer to the faster rates that we observed at 600 nm with the fully oxidized enzymes. In any case, a faster FAD-to-FMN electron transfer appears to take place in the CaM-free Lys842 nNOSred mutants, and this reveals a role for the AI in suppressing this electron transfer step. Because the effect is associated with an increased cytochrome c reductase activity, it also supports the possibility that the rate of FMNH2 formation helps to determine the steady-state reductase activity of CaM-free nNOS (11, 31, 32, 40).
How might the Lys842 mutations speed the observed rate of interflavin electron transfer in CaM-free nNOSred? In the crystal structure, the isoalloxazine rings of the bound FAD and FMN are close enough to support a very fast electron transfer between them (39). However, in solution, we suspect that this conformer of nNOSred (and others like it) exists in a dynamic equilibrium with other conformers that have a less optimal FAD/FMN geometry for electron transfer, and the AI may alter the population distribution to favor the latter. The Lys842 mutations probably alter the ability of the AI to impact the conformational equilibrium and consequently alter the observed “ensemble” rate of interflavin electron transfer that we can measure in the stopped-flow study. Any differences in flavin reduction kinetics between the full-length and reductase forms of the enzymes (compare Figs. 4–6) may be due to structural influences of the attached NOSoxy domain that could conceivably influence the electron transfer between the FAD and FMN cofactors in the “closed” conformation of the NOSred. However, it is important to note that the Lys842 mutations increased the rates of flavin reduction in both forms of the enzyme and thus must act independent of the NOSoxy domain.
Impact on the Conformational Equilibrium of nNOSred
Our data with the Lys842 mutations revealed a new role for the AI in stabilizing the FMN-shielded conformation of nNOSred. This was unexpected and was not apparent from the crystal structure of nNOSred. How the AI does this is not yet clear. In contrast, the crystal structure of nNOSred shows a clear role for the CT in stabilizing the FMN-shielded conformation. The α-helix in the first half of the CT acts as a hairpin to help hold the FMN module in the shielded conformation, where it is in contact with the NADPH-FAD (FNR) subdomain (39). Our current data establish that both the AI and CT are required to stabilize the FMN module in the shielded conformation. Whether their effect involves a physical interaction between the CT and AI elements, as recently proposed (55), deserves further study. In any case, we suspect that the effect of AI on the conformational equilibrium may be a primary cause for the greater (i.e. less repressed) cytochrome c reductase activities of the CaM-free Lys842 mutants and by extension of the AI-deleted nNOS enzymes as well (25–28).
NADPH Effect on the nNOSred Conformational Equilibrium
We also found that NADPH no longer increased the level of FMN shielding in the Lys842 mutants, in marked contrast to its ability to do so in WT nNOSred. This is surprising and provides the first evidence that the AI helps to transduce the effect of NADPH binding on the conformational equilibrium of nNOSred. This effect is potentially important because the conformational equilibrium helps to determine electron flux through CaM-free nNOS, as judged by the cytochrome c reductase activity (36, 37, 40). Previous work established that the CT and individual residues within it or near it are needed for NADPH to alter the conformational equilibrium (increase FMN shielding) in nNOS (37, 41, 42). We recently found that the NADPH effect was lost when the second half of the CT was deleted in nNOSred (this is the portion of the CT that lies beyond the helix and is not visible in the crystal structure) (42). Thus, the AI and the second half of the CT both appear to be necessary for NADPH to impact the conformational equilibrium. Whether this involves contact between the AI and CT elements (55) is still unclear.
Does the loss of the NADPH response explain why the CaM-free Lys842 mutants have greater cytochrome c reductase activities? At first this seems difficult to answer, because the Lys842 mutations also changed the intrinsic set point of the conformational equilibrium in addition to eliminating the NADPH effect on the equilibrium (see Table 5). However, our related study can address this question (42). We found that deletion of the second half of the CT eliminated the NADPH effect without changing the intrinsic set point of the conformational equilibrium of nNOSred. Significantly, this deletion mutant showed no increase in cytochrome c reductase activity in the CaM-free state (42). This argues that the important effect of the Lys842 mutations is not their blunting of the NADPH response but rather their ability to change the intrinsic set point of the conformational equilibrium to favor the FMN-deshielded state of nNOSred. On the basis of our related studies (40), this change in the conformational equilibrium is probably the primary way that the Lys842 mutations cause an increased reductase activity in CaM-free nNOSred.
Impact on CaM-bound nNOSred
The CaM-bound forms of the Lys842 mutants had cytochrome c reductase activities that were similar to that of CaM-bound WT nNOS. This is consistent with CaM having identical effects on nNOSred as do the Lys842 mutations in AI (i.e. CaM also increases the rate of flavin reduction and decreases the extent of FMN shielding) (37). The AI-deleted nNOS also showed only minor differences in their cytochrome c reductase activities relative to WT nNOS in the CaM-bound state (25, 27, 28). Indeed, inhibition by the AI and CT are thought to be disabled upon CaM binding (24, 28, 36, 37). Likewise, the effects of the Lys842 mutations on AI repressor function become moot once CaM binds to nNOSred. However, the K842A mutation still caused a modest decrease in heme reduction rate and NO synthesis activity in CaM-bound nNOS. This suggests that the AI may still function in the CaM-bound nNOS to facilitate an interaction between the FMN module and the oxygenase domain that enables heme reduction (25, 26, 28, 51).
Structural Aspects and Potential Mechanisms
The crystal structure of nNOSred shows that Lys842 is located on the exposed portion of the helical element that is the central feature of the first half of the AI (39). The AI helix contains a canonical CaM binding motif and in the structure makes contacts with both its parent FMN module and the adjacent FNR and connecting subdomains of nNOSred (Fig. 1) (39). Although the side chain of Lys842 has low density in the crystal structure and could only be visualized in one of the two reductase structures in the unit cell, it is expected to either project outward or assume a conformation that makes hydrogen bond contact with the side chain of Asn811 in the FMN subdomain. It is plausible that eliminating or reversing the positive charge at Lys842, which lies within the putative CaM binding motif of the AI helix, would diminish an antagonistic interaction of AI with CaM (39) and thus increase the apparent affinity of nNOS toward CaM as is observed. Mutation at Lys842 might also alter the ability of the AI to directly interact with other subdomains or the CT in nNOSred or might alter the ability of the AI to influence the interactions of the FMN subdomain with its partner subdomains. These structural changes could in turn explain the effects we observed on the interflavin electron transfer kinetics and on the conformational equilibrium of nNOSred and in these ways can explain the increased reductase activity for the mutants in their CaM-free state. Our current results provide a starting point to further investigate these relationships and to define the multifaceted regulation by the AI.
Supplementary Material
This work was supported, in whole or in part, by National Institutes of Health Grants GM51491, CA53914, and HL76491 (to D. J. S.) and HL58883 (to E. D. G.).

The on-line version of this article (available at http://www.jbc.org) contains supplemental Table S1 and Figs. S1–S5.
The electron distributions and extent of electron transfer at each step are also influenced by the relative midpoint potentials of NADPH and the flavin redox couples.
We used a shorter time frame for the absorbance data collection in the experiments with K842E nNOSred in order to better catch the faster transitions that occur in this mutant.
- NOS
- nitric-oxide synthase
- NO
- nitric oxide
- nNOS
- neuronal NOS
- eNOS
- endothelial NOS
- nNOSred
- reductase domain of nNOS
- CaM
- calmodulin
- CT
- C-terminal tail
- AI
- autoinhibitory insert
- FMNsq
- FMN semiquinone
- FADsq
- FAD semiquinone
- EPPS
- 4-(2-hydroxyethyl)-1-piperazinepropanesulfonic acid
- WT
- wild type.
REFERENCES
- 1.Alderton W. K., Cooper C. E., Knowles R. G. (2001) Biochem. J. 357, 593–615 [DOI] [PMC free article] [PubMed] [Google Scholar]
- 2.Roman L. J., Martásek P., Masters B. S. (2002) Chem. Rev. 102, 1179–1190 [DOI] [PubMed] [Google Scholar]
- 3.Stuehr D. J., Wei C. C., Wang Z., Hille R. (2005) Dalton Trans. 21, 3427–3435 [DOI] [PubMed] [Google Scholar]
- 4.Bredt D. S., Ferris C. D., Snyder S. H. (1992) J. Biol. Chem. 267, 10976–10981 [PubMed] [Google Scholar]
- 5.Hevel J. M., Marletta M. A. (1992) Biochemistry 31, 7160–7165 [DOI] [PubMed] [Google Scholar]
- 6.Klatt P., Schmidt K., Uray G., Mayer B. (1993) J. Biol. Chem. 268, 14781–14787 [PubMed] [Google Scholar]
- 7.McMillan K., Bredt D. S., Hirsch D. J., Snyder S. H., Clark J. E., Masters B. S. (1992) Proc. Natl. Acad. Sci. U.S.A. 89, 11141–11145 [DOI] [PMC free article] [PubMed] [Google Scholar]
- 8.Schmidt H. H., Smith R. M., Nakane M., Murad F. (1992) Biochemistry 31, 3243–3249 [DOI] [PubMed] [Google Scholar]
- 9.Stuehr D. J., Cho H. J., Kwon N. S., Weise M. F., Nathan C. F. (1991) Proc. Natl. Acad. Sci. U.S.A. 88, 7773–7777 [DOI] [PMC free article] [PubMed] [Google Scholar]
- 10.Stuehr D. J., Ikeda-Saito M. (1992) J. Biol. Chem. 267, 20547–20550 [PubMed] [Google Scholar]
- 11.Guan Z. W., Kamatani D., Kimura S., Iyanagi T. (2003) J. Biol. Chem. 278, 30859–30868 [DOI] [PubMed] [Google Scholar]
- 12.Marletta M. A., Hurshman A. R., Rusche K. M. (1998) Curr. Opin. Chem. Biol. 2, 656–663 [DOI] [PubMed] [Google Scholar]
- 13.Miller R. T., Martásek P., Omura T., Siler Masters B. S. (1999) Biochem. Biophys. Res. Commun. 265, 184–188 [DOI] [PubMed] [Google Scholar]
- 14.Stuehr D. J., Santolini J., Wang Z. Q., Wei C. C., Adak S. (2004) J. Biol. Chem. 279, 36167–36170 [DOI] [PubMed] [Google Scholar]
- 15.Bredt D. S., Snyder S. H. (1990) Proc. Natl. Acad. Sci. U.S.A. 87, 682–685 [DOI] [PMC free article] [PubMed] [Google Scholar]
- 16.Busse R., Mülsch A. (1990) FEBS Lett. 265, 133–136 [DOI] [PubMed] [Google Scholar]
- 17.Cho H. J., Xie Q. W., Calaycay J., Mumford R. A., Swiderek K. M., Lee T. D., Nathan C. (1992) J. Exp. Med. 176, 599–604 [DOI] [PMC free article] [PubMed] [Google Scholar]
- 18.Bredt D. S., Hwang P. M., Glatt C. E., Lowenstein C., Reed R. R., Snyder S. H. (1991) Nature 351, 714–718 [DOI] [PubMed] [Google Scholar]
- 19.Roman L. J., Martásek P., Miller R. T., Harris D. E., de La Garza M. A., Shea T. M., Kim J. J., Masters B. S. (2000) J. Biol. Chem. 275, 29225–29232 [DOI] [PubMed] [Google Scholar]
- 20.Bauer P. M., Fulton D., Boo Y. C., Sorescu G. P., Kemp B. E., Jo H., Sessa W. C. (2003) J. Biol. Chem. 278, 14841–14849 [DOI] [PubMed] [Google Scholar]
- 21.Dimmeler S., Fleming I., Fisslthaler B., Hermann C., Busse R., Zeiher A. M. (1999) Nature 399, 601–605 [DOI] [PubMed] [Google Scholar]
- 22.Komeima K., Hayashi Y., Naito Y., Watanabe Y. (2000) J. Biol. Chem. 275, 28139–28143 [DOI] [PubMed] [Google Scholar]
- 23.Michell B. J., Harris M. B., Chen Z. P., Ju H., Venema V. J., Blackstone M. A., Huang W., Venema R. C., Kemp B. E. (2002) J. Biol. Chem. 277, 42344–42351 [DOI] [PubMed] [Google Scholar]
- 24.Salerno J. C., Harris D. E., Irizarry K., Patel B., Morales A. J., Smith S. M., Martasek P., Roman L. J., Masters B. S., Jones C. L., Weissman B. A., Lane P., Liu Q., Gross S. S. (1997) J. Biol. Chem. 272, 29769–29777 [DOI] [PubMed] [Google Scholar]
- 25.Daff S., Sagami I., Shimizu T. (1999) J. Biol. Chem. 274, 30589–30595 [DOI] [PubMed] [Google Scholar]
- 26.Montgomery H. J., Romanov V., Guillemette J. G. (2000) J. Biol. Chem. 275, 5052–5058 [DOI] [PubMed] [Google Scholar]
- 27.Nishida C. R., Ortiz de Montellano P. R. (1999) J. Biol. Chem. 274, 14692–14698 [DOI] [PubMed] [Google Scholar]
- 28.Roman L. J., Masters B. S. (2006) J. Biol. Chem. 281, 23111–23118 [DOI] [PubMed] [Google Scholar]
- 29.Chen P. F., Wu K. K. (2000) J. Biol. Chem. 275, 13155–13163 [DOI] [PubMed] [Google Scholar]
- 30.Chen P. F., Wu K. K. (2003) J. Biol. Chem. 278, 52392–52400 [DOI] [PubMed] [Google Scholar]
- 31.Guan Z. W., Iyanagi T. (2003) Arch. Biochem. Biophys. 412, 65–76 [DOI] [PubMed] [Google Scholar]
- 32.Matsuda H., Iyanagi T. (1999) Biochim. Biophys. Acta 1473, 345–355 [DOI] [PubMed] [Google Scholar]
- 33.Abu-Soud H. M., Stuehr D. J. (1993) Proc. Natl. Acad. Sci. U.S.A. 90, 10769–10772 [DOI] [PMC free article] [PubMed] [Google Scholar]
- 34.Panda K., Ghosh S., Stuehr D. J. (2001) J. Biol. Chem. 276, 23349–23356 [DOI] [PubMed] [Google Scholar]
- 35.Rozhkova E. A., Fujimoto N., Sagami I., Daff S. N., Shimizu T. (2002) J. Biol. Chem. 277, 16888–16894 [DOI] [PubMed] [Google Scholar]
- 36.Craig D. H., Chapman S. K., Daff S. (2002) J. Biol. Chem. 277, 33987–33994 [DOI] [PubMed] [Google Scholar]
- 37.Konas D. W., Zhu K., Sharma M., Aulak K. S., Brudvig G. W., Stuehr D. J. (2004) J. Biol. Chem. 279, 35412–35425 [DOI] [PubMed] [Google Scholar]
- 38.Feng C., Tollin G., Holliday M. A., Thomas C., Salerno J. C., Enemark J. H., Ghosh D. K. (2006) Biochemistry 45, 6354–6362 [DOI] [PubMed] [Google Scholar]
- 39.Garcin E. D., Bruns C. M., Lloyd S. J., Hosfield D. J., Tiso M., Gachhui R., Stuehr D. J., Tainer J. A., Getzoff E. D. (2004) J. Biol. Chem. 279, 37918–37927 [DOI] [PubMed] [Google Scholar]
- 40.Ilagan R. P., Tiso M., Konas D. W., Hemann C., Durra D., Hille R., Stuehr D. J. (2008) J. Biol. Chem. 283, 19603–19615 [DOI] [PMC free article] [PubMed] [Google Scholar]
- 41.Tiso M., Konas D. W., Panda K., Garcin E. D., Sharma M., Getzoff E. D., Stuehr D. J. (2005) J. Biol. Chem. 280, 39208–39219 [DOI] [PubMed] [Google Scholar]
- 42.Tiso M., Tejero J., Panda K., Aulak K. S., Stuehr D. J. (2007) Biochemistry 46, 14418–14428 [DOI] [PubMed] [Google Scholar]
- 43.Adak S., Ghosh S., Abu-Soud H. M., Stuehr D. J. (1999) J. Biol. Chem. 274, 22313–22320 [DOI] [PubMed] [Google Scholar]
- 44.Adak S., Aulak K. S., Stuehr D. J. (2001) J. Biol. Chem. 276, 23246–23252 [DOI] [PubMed] [Google Scholar]
- 45.Haque M. M., Panda K., Tejero J., Aulak K. S., Fadlalla M. A., Mustovich A. T., Stuehr D. J. (2007) Proc. Natl. Acad. Sci. U.S.A. 104, 9254–9259 [DOI] [PMC free article] [PubMed] [Google Scholar]
- 46.Haque M. M., Fadlalla M., Wang Z. Q., Ray S. S., Panda K., Stuehr D. J. (2009) J. Biol. Chem. 284, 19237–19247 [DOI] [PMC free article] [PubMed] [Google Scholar]
- 47.Gachhui R., Abu-Soud H. M., Ghosha D. K., Presta A., Blazing M. A., Mayer B., George S. E., Stuehr D. J. (1998) J. Biol. Chem. 273, 5451–5454 [DOI] [PubMed] [Google Scholar]
- 48.Wu C., Zhang J., Abu-Soud H., Ghosh D. K., Stuehr D. J. (1996) Biochem. Biophys. Res. Commun. 222, 439–444 [DOI] [PubMed] [Google Scholar]
- 49.Adak S., Santolini J., Tikunova S., Wang Q., Johnson J. D., Stuehr D. J. (2001) J. Biol. Chem. 276, 1244–1252 [DOI] [PubMed] [Google Scholar]
- 50.Adak S., Sharma M., Meade A. L., Stuehr D. J. (2002) Proc. Natl. Acad. Sci. U.S.A. 99, 13516–13521 [DOI] [PMC free article] [PubMed] [Google Scholar]
- 51.Knight K., Scrutton N. S. (2002) Biochem. J. 367, 19–30 [DOI] [PMC free article] [PubMed] [Google Scholar]
- 52.Garnaud P. E., Koetsier M., Ost T. W., Daff S. (2004) Biochemistry 43, 11035–11044 [DOI] [PubMed] [Google Scholar]
- 53.Daff S. (2004) Biochemistry 43, 3929–3932 [DOI] [PubMed] [Google Scholar]
- 54.Konas D. W., Takaya N., Sharma M., Stuehr D. J. (2006) Biochemistry 45, 12596–12609 [DOI] [PubMed] [Google Scholar]
- 55.Jáchymová M., Martásek P., Panda S., Roman L. J., Panda M., Shea T. M., Ishimura Y., Kim J. J., Masters B. S. (2005) Proc. Natl. Acad. Sci. U.S.A. 102, 15833–15838 [DOI] [PMC free article] [PubMed] [Google Scholar]
Associated Data
This section collects any data citations, data availability statements, or supplementary materials included in this article.