Abstract
Adipocyte death has been reported in both obese humans and rodents. However, its role in metabolic disorders, including insulin resistance, hepatic steatosis, and inflammation associated with obesity has not been studied. We now show using real-time reverse transcription-PCR arrays that adipose tissue of obese mice display a pro-apoptotic phenotype. Moreover, caspase activation and adipocyte apoptosis were markedly increased in adipose tissue from both mice with diet-induced obesity and obese humans. These changes were associated with activation of both the extrinsic, death receptor-mediated, and intrinsic, mitochondrial-mediated pathways of apoptosis. Genetic inactivation of Bid, a key pro-apoptotic molecule that serves as a link between these two cell death pathways, significantly reduced caspase activation, adipocyte apoptosis, prevented adipose tissue macrophage infiltration, and protected against the development of systemic insulin resistance and hepatic steatosis independent of body weight. These data strongly suggest that adipocyte apoptosis is a key initial event that contributes to macrophage infiltration into adipose tissue, insulin resistance, and hepatic steatosis associated with obesity in both mice and humans. Inhibition of adipocyte apoptosis may be a new therapeutic strategy for the treatment of obesity-associated metabolic complications.
Keywords: Apoptosis, Lipid, Lipid/Fatty Acid, Metabolism, Metabolism/Lipid, Metabolism/Metabolic syndrome, Metabolism/Regulation
Introduction
Obesity has reached epidemic proportions in most of the Western World. With obesity comes a variety of adverse health outcome such as dyslipidemia, hypertension, glucose intolerance, and hepatic steatosis, which are grouped into the so-call metabolic syndrome (1–3). Insulin resistance is a common central feature of this syndrome (4–6). It has become clear that a state of low grade chronic inflammation typically associated with obesity and characterized by macrophage infiltration of adipose tissue (AT)2 and increased production of pro-inflammatory cytokines plays a crucial role in the development of insulin resistance (7–9). Indeed, in both humans and rodents, adipose tissue macrophages (ATM) accumulate in AT with increasing body weight, and preventing the accumulation of ATM protects against the obesity-associated inflammatory state and development of insulin resistance (10–13).
The pathogenic mechanisms resulting in ATM recruitment are under intense investigation and remain incompletely understood. Increased production and release of certain chemokines by adipocytes potentially as a result of local hypoxia in an expanding adipose tissue bed has been implicated (14, 15). More recently, adipocyte necrotic cell death with formation of “crown-like structures” characterized by dead adipocytes surrounded by macrophages has been described in both adipose tissue from obese mice and humans (16–18). However, whether adipocyte necrosis is a late consequence of the adipose tissue expansion and inflammation or an upstream event that initiates ATM recruitment remain unanswered. Moreover, the molecular signaling events resulting in adipocyte cell death, and the occurrence and significance of apoptosis in this context, remain completely unknown. Here, we tested the hypothesis that increased adipocyte apoptosis results in recruitment of macrophages to adipose tissue and is a key link between obesity, insulin resistance, and hepatic steatosis.
EXPERIMENTAL PROCEDURES
Animal Studies
These experimental protocols were approved by the Institutional Animal Care and Use Committee at the Cleveland Clinic. Male C57BL/6 mice, 20 to 25 g of body weight, were purchased from Jackson Laboratory. C57BL/6 Bid knockout (generously provided by Dr. Xiao-Ming Yin from the University of Pittsburgh) mice were described previously (19). Mice were placed on two different diets that allow us to study the spectrum of human obesity. Mice were fed either a high fat (HFAT) diet (consisting of 42% Kcal from fat, 42.7% carbohydrate, 15.2% protein, 4% mineral mixture, TD 88137, Teklad Mills, Madison, WI), or a high sucrose (HSD) diet (consisting of 65% sucrose, 20% casein, 5% corn oil, 4% mineral mixture, TD 98090, Teklad Mills, Madison, WI) (n = 5–6 in each group) that result in obesity, hepatic steatosis, and systemic insulin resistance (20–22). Control mice were fed a standard diet consisting of 5% fat (TD 2918, Teklad Mills, Madison, WI) (n = 6). Total body weight was measured weekly. Animals in each group were sacrified after 6 weeks on respective diets.
Human Subjects and Materials
The study was approved by the Cleveland Clinic Institutional Review Board, and all patients gave written informed consent for participation in medical research. We examined omental fat biopsies from obese subjects (n = 8) undergoing laparoscopic bariatric surgery at the Cleveland Clinic Bariatric and Metabolic Institute and from lean healthy controls (n = 7) undergoing abdominal surgery for unrelated reasons. Adipose tissue was cut into small pieces and either snap-frozen in liquid nitrogen and stored at −80 °C or fixed in freshly prepared 4% paraformaldehyde in phosphate-buffered saline for 24 h at 4 °C for histological, immunohistochemical analysis. Adipose tissue apoptosis was determined by TUNEL assay, and macrophage infiltration was assessed by CD68 immunostaining. The percentage of TUNEL-positive cells and CD68-positive cells in adipose tissue were determined for each patient and related to the presence of insulin resistance syndrome (BMI, hypertension, hyperlipidemia, and glucose intolerance).
Histopathology, Oil Red O Staining, and Immunohistochemistry
Adipose (epididymal) and liver tissue were collected under deep anesthesia after a 6-h fast as previously described in detail (23). The tissue was fixed in 4% paraformaldehyde and embedded in Tissue Path (Fisher Scientific). Tissue sections (4 μm) were prepared, and hematoxylin and eosin (H&E) staining of adipose and liver sections, as well as Oil Red O-stained liver specimens were evaluated by light microscopy(24). The presence of macrophage infiltration was assessed by immunohistochemistry F4/80 and Mac3 antibodies, two known markers of activated macrophages (10, 11, 25). The total number of nuclei and the number of nuclei of F4/80- and MAC3-expressing cells were counted in 4 random fields (×10) for each adipose specimen. The fraction of F4/80-Mac3-expressing cells was calculated for each sample. Double immunostaining was performed to enable simultaneous detection of apoptotic cells (TUNEL assay) and adipocytes (perilipin). Apoptotic cells were identified using the in situ cell death detection kit (Roche Molecular Biochemicals, Mannheim, Germany) as detailed below. Sections were stained for perilipin A and B using a rabbit anti-perilipin A/B antibody.
Adipocyte Isolation
The epididymal fat pad was isolated and placed in warm (37 °C) KRH/BSA buffer, pH 7.4 (1 mm CaCl2, 1.2 mm MgSO4, 1.2 mm KH2PO4, 1.4 mm KCl, 2 mm pyruvic acid, 20 mm HEPES, 24 mm NaHCO3, 130 mm NaCl, 1% BSA). The tissue was minced until homogenous. The lower medium containing nonfat tissue was removed. Minced fat tissue was placed in KRH/BSA buffer containing 1 mg/ml of CLS type 1 collagenase (Worthington Biochemical Corp, cat. LS004194) and incubated at 37 °C for 20 min. Digested fat tissue was filtered using nylon cloth filter (Fisher Scientific). Filtered adipocytes were washed with KRH/BSA buffer and centrifuged. Cells were then lysed in radioimmune precipitation assay buffer (Cell Signaling, Danvers, MA) containing protease inhibitors (Promega, Madison, WI). Protein concentration was subsequently measured using the BCA protein assay (Pierce).
Real-time PCR Microarrays
After homogenization by TRIzol (Invitrogen) and sonication, total RNA was isolated from adipose tissue of mice on either control or HFAT diet. cDNA was transcribed using an RT2 Reaction Ready First Strand Synthesis kit (SuperArray Bioscience) and was analyzed using the mouse apoptosis PCR array (cat. no. APM-012A, SuperArray Bioscience, Frederick, MD) focusing on gene families relevant to the induction and inhibition of apoptosis, and the RT2 SYBR Green/Rox PCR master mix (cat. no. PA-012, SuperArray Bioscience) on a 7300 Real-time PCR System (Applied Biosystems). Data were normalized using multiple housekeeping genes (β-actin, GAPDH (glyceraldehyde-3-phosphate dehydrogenase), HPRT1, HSP90AB1), and analyzed by comparing 2ΔΔCt of the normalized sample.
Apoptosis Assessment
The TUNEL assay was performed in each sample following the manufacturer's instructions (in situ cell death detection kit; Roche Molecular Biochemicals). Adipocyte apoptosis in adipose tissue sections was quantitated by counting the number of TUNEL-positive cells in 10 random microscopic fields (×40), as previously described (26).
Immunoblot Analysis
Immunoblot analysis was performed using whole cell lysates. Samples were resolved by 12% SDS-PAGE, transferred to nitrocellulose membrane, and blotted with appropriate primary antibodies. The membrane was incubated with peroxidase-conjugated secondary antibody (1:10,000 dilution, BIOSOURCE International, Camarillo, CA), and the bound antibody was visualized using a chemiluminescent substrate (ECL, Amersham Biosciences) and Kodak X-OMAT film (Eastman Kodak, Rochester, NY). The antibodies used included: rabbit anti-Bid (cat. 2003, dilution 1:1000), rabbit anti-caspase 8 (cat. 4927, dilution 1:1000), rabbit anti-Bax (cat. 2772, dilution 1:1000) were purchased from Cell Signaling Technology. Rabbit polyclonal anti-FAS (X-20, dilution 1:1000), goat polyclonal anti-actin (C-11, dilution 1:1000) were purchased from Santa Cruz Biochemicals (Santa Cruz, CA). Rabbit polyclonal anti-FasL (ab15285, dilution 1:1000) was from Abcam (Cambridge, MA). Mouse monoclonal anti-BCL-XL (cat. 556499, dilution 1:1000) was from BD Biosciences (San Jose, CA). Rabbit polyclonal anti-cleaved Bid (Ab-1, cat. PC645, dilution 1:1000) was from EMD Calbiochem.
Real-time PCR
Total RNA was isolated from adipose tissue using RNeasy Lipid Tissue Mini kit (Qiagen, Valencia, CA). The reverse transcript (the cDNA) was synthesized from 1 μg of total RNA using the iScript cDNA Synthesis kit (Bio-Rad). Real-time PCR quantification was performed. Briefly, 25 μl of reaction mix contained: cDNA, Syber Green buffer, Gold Taq polymerase, dNTPs, and primers at final concentrations of 200 μm. The sequences of the primers used for quantitative PCR were as follows: TNF-α 5′-CCCTCACACTCAGATCATCTTCT and 5′-GCTACGACGTGGGCTACAG; IL-6 5′-TAGTCCTTCCTACCCCAATTTCC and 5′-TTGGTCCTTAGCCACTCCTTC; IL-1β 5′-GCAACTGTTCCTGAACTCAACT and 5′-ATCTTTTGGGGTCCGTCAACT; iNOS 5′-GTTCTCAGCCCAACAATACAAGA and 5′-GTGGACGGGTCGATGTCAC; Arginase-1 5′-CTCCAAGCCAAAGTCCTTAGAG and 5′-AGGAGCTGTCATTAGGGACATC; TGF-β 5′-CTCCCGTGGCTTCTAGTGC and 5′-GCCTTAGTTTGGACAGGATCTG. RT-PCR was performed in the Mx3000P cycler (Stratagene): 95 °C for 10 min, 40 cycles of 15 s at 95 °C, 30 s at 60 °C, 30 s at 72 °C followed by 1 min at 95 °C, 30 s at 55 °C and 30 s at 95 °C. The fold change over control samples was calculated using CT, ΔCT, and ΔΔCT values using MxPro software (Stratagene). 18 S ribosomal RNA (Ambion Inc, Austin, TX) was used as an endogenous control.
Metabolic Studies
Mice were fasted overnight and then received an intraperitoneal injection of 2 mg of glucose/g of body weight. Blood was collected from the tail vein in conscious mice at 0-, 15-, 45-, and 120-min postinjection. Glucose was measured using a One Touch Ultra2 blood glucose monitoring system (Johnson & Johnson, Langhorne, PA).
Protein and Lipid Analyses
Serum assays of metabolic and inflammatory mediators, including serum insulin, IL-6, and TNF-α levels (plasma and tissue lysates) were measured after a 6-hour fast using commercially available mouse insulin (Crystal Chem Inc, Downers Grove, IL), IL-6, and TNF-α (R&D Systems Inc, Minneapolis, MN) ELISA kits, respectively. Serum fasting glucose concentrations were measured using a gluco-analyzer (Roche) whereas liver and plasma triglyceride and free fatty acid levels were measured using commercially available assays: triglyceride-SL assay (Diagnostic Chemicals Ltd), and NEFA C (Wako Chemicals).
Data Analysis
All data are expressed as the mean ± S.D. unless otherwise indicated. Differences between groups were compared by analysis of variance (ANOVA). Tukey's adjustment was used for multiple comparisons. Spearman's correlation coefficient was used to estimate the association of TUNEL-positive cells and degree of insulin resistance, steatosis, and ATM infiltration. A type I error rate of 0.05 was used for all analyses. SAS version 9.1 software (SAS Institute, Cary, NC) was used to perform all analyses, and R 2.0.1 software (The R Foundation for Statistical Computing) was used to construct all graphs.
RESULTS
Adipocyte Hypertrophy and ATM Recruitment during Weight Gain Is Associated with a Pro-apoptotic Phenotype in Diet-induced Obesity
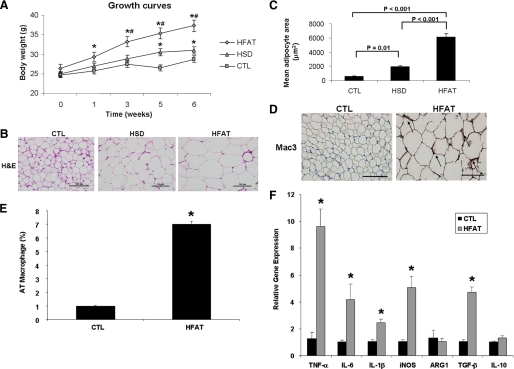
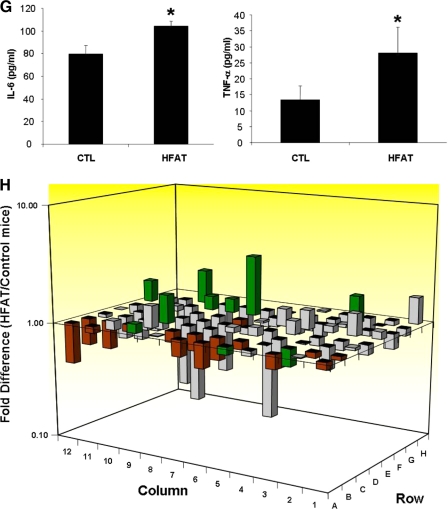
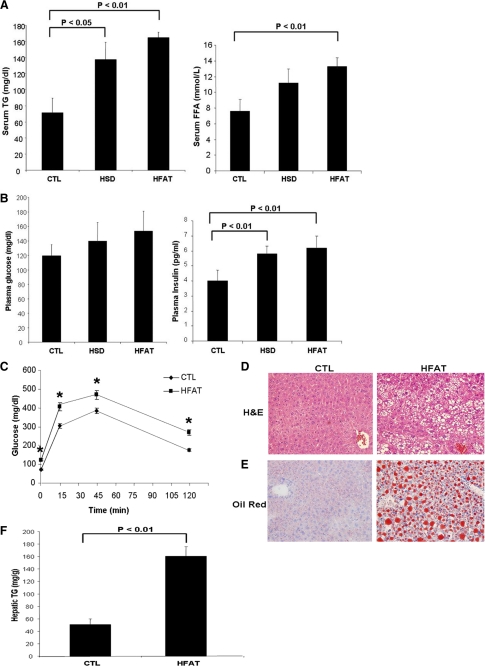
Mice fed either an HFAT or an HSD for 6 weeks developed marked obesity compared with animals kept on a standard control diet (37.3 ± 1.5 versus 31 ± 0.9 versus 28.7 ± 0.8 g body weight, respectively, p < 0.01; Fig. 1A). Histological examination of adipose tissue showed a correlation between the magnitude of weight gain and adipocyte hypertrophy with the mean adipocyte cross-sectional area being significantly higher in those mice fed either the HFAT or HSD compared with mice on the control diet (HFAT > HSD > CTL) (Fig. 1, B and C). As shown in Fig. 1, D and E, feeding mice an HFAT resulted in a significant increase in the percentage of Mac3-positive cells compared with mice fed the CTL diet. These results were similar in the mice on the HSD (data not shown). In agreement with previous reports, clusters of ATM forming the so call “crown-like structures” were noted in AT of animals on HFAT but not in those on the CTL diet (Fig. 1, C and D). The increase in ATM was also associated with macrophage polarization toward a pro-inflammatory M1 phenotype characterized by a significant increase in production of pro-inflammatory cytokines including TNF-α, IL-6, and IL-1β (Fig. 1, F and G), as well as an increase in the ratio of inducible nitric-oxide synthase (iNOS) to arginase 1 (ARG1) (Fig. 1F). We did not detect changes in the expression levels of IL-10; however, TGF-β expression was increased in adipose tissue from mice on the HFD compared with the CTL diet (Fig. 1F). To explore the impact of the changes observed in adipose tissue in obese animals on the transcriptional profile of genes involved in cell survival, proliferation, and apoptosis, we used quantitative real-time PCR microarrays to catalog gene expression levels of a total of 84 genes in epididymal adipose tissue from mice on either the CTL or HFAT diet. Strikingly, mice on the HFAT diet demonstrated a pro-apoptotic gene expression profile characterized by a marked down-regulation of anti-apoptotic genes and up-regulation of pro-apoptotic genes compared with mice on the CTL diet (Fig. 1G). Supplemental Table S1 shows the fold difference in the expression of each gene analyzed between the HFAT and CTL mice. We next examined the effects of the different diets on systemic insulin resistance, lipid profile, and hepatic steatosis. Although the fasting plasma glucose levels were similar in the three groups of mice, the fasting insulin levels were markedly increased in mice on either HFAT or HSD compared with mice on the control diet (HFAT > HSD > CTL) (Fig. 2A). The serum TG and FFA levels were also significantly increased compared with controls (Fig. 2B). The animals on the HFAT manifested glucose intolerance in glucose tolerance tests (Fig. 2C). Finally, the animals on both the HFAT and HSD diets developed marked hepatic steatosis, with increases in hepatic TG levels compared with the mice on the control diet (Fig. 2, D–F).
FIGURE 1.
Adipose tissue expansion, macrophage infiltration, and inflammation during diet-induced obesity are associated with a pro-apoptotic phenotype. A, growth curves of mice on either an HFAT diet, an HSD diet, or a CTL diet (n = 5–6 in each group). B, representative microphotograph of H&E staining of adipose depots from the three groups of animals (magnification ×40). The scale bar represents 100 μm. C, adipocyte size was calculated by determining the mean adipocyte cross-sectional area in adipose tissue depots for each mouse in this study. D, immunohistochemical detection of the macrophage-specific marker Mac3 in epididymal adipose tissue of mice on the CTL and HFAT diet (magnification ×40). E, macrophage infiltration in AT of CTL and HFAT-fed mice was quantitated as the ratio of Mac3-positive cells to total cells. F, expression of genes related to macrophage activation and polarization was measured by quantitative RT-PCR in the AT of CTL and HFAT-fed mice. Results are expressed as mean ± S.D. *, p < 0.001 compared with control diet group. G, protein levels of two key inflammatory cytokines, TNF-α, and IL-6, were measured in adipose tissue lysates from the two groups of mice. Results are expressed as mean ± S.D. *, p < 0.05 compared with control diet group. H, total RNA isolated from adipose tissue of mice on either an HFAT or CTL diet was analyzed using real-time RT-PCR microarrays. Genes related to apoptosis are highlighted in green. Genes associated with anti-apoptotic signaling are highlighted in red. Data are presented as the fold difference from mice on the CTL diet, calculated from average ΔCT normalized to housekeeping genes (β-actin, GAPDH (glyceraldehyde-3-phosphate dehydrogenase), HPRT1, HSP90AB1). Columns pointing up (with z axis values >1) indicate an up-regulation of gene expression, and columns pointing down (with z axis values <1) indicate a down-regulation of gene expression in the test sample relative to the control sample.
FIGURE 2.
Metabolic abnormalities associated with diet-induced obesity. Metabolic parameters were measured after a 6-h fasting in mice on either an HFAT, HSD, or CTL diet (n = 5 in each group) including: (A) plasma glucose and insulin concentrations; (B) triglycerides, and free fatty acid levels; (C) plasma glucose levels during glucose tolerance test in mice on the CTL and HFAT diet (n = 5 in each group). Data are expressed as mean ± S.D. *, p < 0.01 compared with the control diet group. D, representative microphotograph of H&E staining, and E, Oil Red O staining from mice on the CTL and HFAT diet. F, hepatic triglyceride content was determined in livers from mice on the CTL and HFAT diet and expressed as milligrams per gram of liver tissue.
Adipocyte Apoptosis Is Markedly Increased in Diet-induced Obesity
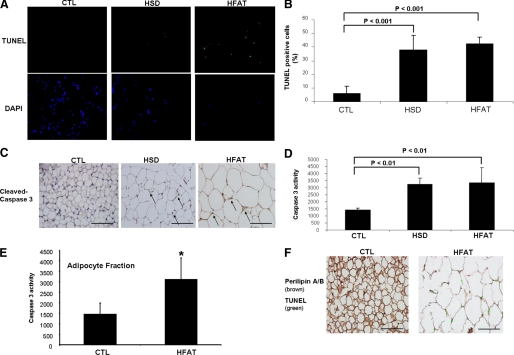
The transcriptional profiling of adipose tissue suggested that during weight gain, adipocytes are subjected to a “pro-apoptotic pressure.” To identify and quantitate the presence of adipocyte apoptosis, we initially performed TUNEL assays in adipose tissue specimens from the three groups of animals. In adipose tissue specimens from lean mice on the CTL diet, only a few isolated TUNEL-positive cells were identified (Fig. 3A). In sharp contrast, TUNEL-positive cells were readily observed in adipose tissue from both HFAT- and HSD-fed animals (Fig. 3A). Quantitation of TUNEL-positive cells showed an 8-fold increase of apoptotic cells in these mice compared with the lean mice on the CTL diet (HFAT: 42 ± 4.9 versus HSD: 38 ± 10.6 versus CTL 6 ± 5% positive cells, p < 0.001) (Fig. 3B). To confirm the presence of apoptosis, we next examined the expression and degree of activation of caspase 3, a key effector caspase that executes the apoptotic program. Immunohistochemistry for activated caspase 3 showed that the immunoreactive product for activated caspase 3 was readily identified in adipocytes from obese animals on both HFAT and HSD but not in lean mice on the CTL diet (Fig. 3C). Caspase 3 activity was also increased by more than 2-fold in the obese animals compared with the lean controls (Fig. 3D).
FIGURE 3.
Adipocyte apoptosis in diet-induced obesity. A, TUNEL staining of adipose tissue sections from C57BL/6 mice on HFAT, HSD, or control diet. The nuclear binding dye DAPI was performed to determine the total number of cells per ×40 field. B, quantitation of TUNEL staining in adipose sections from the three groups of mice by counting the number of TUNEL-positive cells in 10 random microscopic fields. Results are expressed as mean ± S.D. C, representative immunohistochemistry microphotograph of activated caspase 3 in adipose tissue from the three groups of mice. Quantification of caspase activity was determined with Apo-ONE homogeneous caspase 3 fluorometric assay in either (D) whole adipose tissue lysates or (E) lysates from adipocyte fractions following adipocyte isolation as detailed under “Experimental Procedures.” Results are expressed as mean ± S.D. *, p < 0.05 compared with control diet group. F, adipose tissue adipocyte apoptosis was further evaluated in epididymal adipose tissue sections from mice on either CTL or HFAT diet by double immunostaining with perilipin A/B (brown) and with the TUNEL assay to identify apoptotic cells (green).
The morphologic appearance and distribution of TUNEL-positive cells suggested that these were predominantly adipocytes. To further establish adipocyte apoptosis versus apoptosis occurring in other cell types in adipose tissue, we used two different approaches. First, in selective experiments, the epididymal fat pad from CTL and HFAT-fed animals was fractionated into adipocytes and nonadipocytes fractions. Consistent with the results shown above for whole adipose tissue, caspase 3 activity was markedly increased in adipocyte fractions from HFAT-fed animals compared with the CTL mice (Fig. 3E). Second, we performed double staining experiments to identify simultaneously apoptotic cells and adipocytes in epididymal fat sections from mice on the CTL or HFAT diet. Mice on the HFAT diet showed significantly increased apoptosis (Fig. 3F) compared with controls that were mainly adipocyte in origin.
Fas (CD95) and Mitochondrial Pathways of Apoptosis Are Activated in Adipocytes from Obese Mice
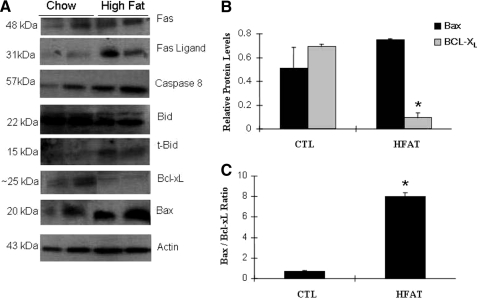
To gain insight into the mechanisms responsible for the increased apoptosis observed in the adipose tissue of obese mice, the expression of key proteins involved in the signal transduction of the two main apoptotic pathways were evaluated in obese and lean mice. By Western blot analysis, we found that Fas and FasL protein expression was significantly increased in the AT of obese animals compared with lean mice (Fig. 4A). This observation was further supported by Fas and FasL immunostaining in adipose tissue of mice on the HFAT and HSD diet (data not shown). These changes were associated with activation of Fas signaling as shown by detection of the activated form of caspase 8 and a marked increase in the cleaved, truncated Bid (tBid), a BH3-only protein of the Bcl-2 family that plays a central role as a regulator of the interaction between the extrinsic (death-receptor mediated) and the intrinsic (mitochondrial) pathways of apoptosis (Fig. 4A). Finally, we also noted changes in two other Bcl-2 family members that play a key role in the initiation of the mitochondrial pathway of apoptosis, including Bax and Bcl-XL, (Fig. 4B). We observed a significant increase in the Bax/Bcl-XL ratio (Fig. 4C), which has been shown in various experimental models to result in mitochondrial permeabilization as well as increased sensitivity to Fas-mediated apoptosis (27).
FIGURE 4.
Extrinsic and intrinsic pathways of apoptosis are activated in adipose tissue from obese mice. A, representative immunoblot analysis for key proteins involved in the signal transduction of the two main apoptotic pathways (extrinsic and intrinsic) in adipose tissue from obese (HFAT) and lean (CTL) mice. β-Actin served as a control for protein loading. B, protein levels were quantified by densitometry analysis and normalized to β-actin. C, BAX/Bcl-XL ratio was calculated (n = 4 in each group of mice) based on the densitometry data. Results are represented as mean ± S.D. *, p < 0.01 compared with CTL.
Inhibition of Adipocyte Apoptosis Protects Obese Animals against ATM Recruitment, Development of Fatty Liver, and Insulin Resistance
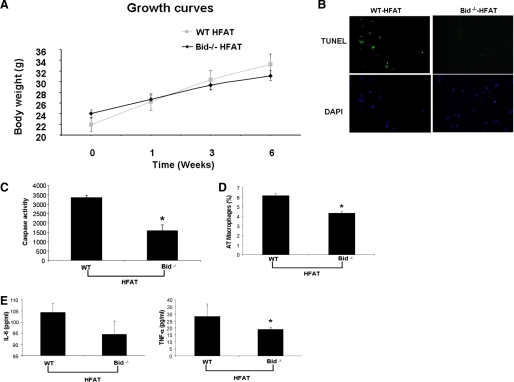
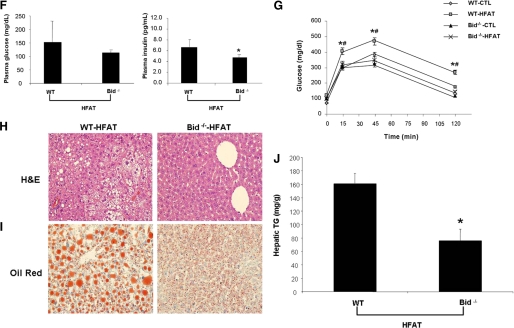
The findings of marked increased adipocyte apoptosis in two models of diet-induced obesity in mice and the activation of two key signaling pathways of apoptosis in these animals led us to further examine the role of adipocyte apoptosis by using Bid-null mice. Bid−/− mice and their wild-type controls were placed on either HFAT or control diet for 6 weeks. Bid knockouts showed similar weight gain as their wild-type littermates when placed on the HFAT diet (Fig. 5A). However, genetic inactivation of Bid proved to protect from caspase 3 activation in adipocytes and significantly reduced the number of apoptotic cells detected in the adipose tissue of these mice (Fig. 5, B and C). These changes were associated with a marked decreased in ATM (Fig. 5D) and inflammatory cytokines (Fig. 5E). Moreover, Bid knockouts were resistant to diet-induced hepatic steatosis and insulin resistance (Fig. 5, F–J). Collectively, these data strongly suggest that adipocyte apoptosis is an early event that results in ATM recruitment and development of hepatic steatosis and insulin resistance.
FIGURE 5.
Inactivation of Bid protects from caspase 3 activation, adipocyte apoptosis, and metabolic complications from diet-induced obesity. A, growth curves of Bid−/− and Bid+/+ mice HFAT diet (n = 5–6 in each group). B, representative microphotograph of TUNEL staining of liver section from Bid−/− and Bid+/+ mice on either the HFAT or control diet. C, quantification of caspase activity was determined with Apo-ONE homogeneous caspase 3 fluorometric assay in adipose tissue lysates. Results are expressed as mean ± S.D. *, p < 0.01 compared with Bid+/+. D, quantification of immunohistochemical detection of the macrophage-specific marker Mac3 in epididymal adipose tissue of Bid−/− and Bid+/+ mice on the HFAT diet. Results are expressed as mean ± S.D. *, p < 0.01 compared with Bid+/+. E, TNF-α and IL-6 protein levels were measured in adipose tissue lysates from Bid−/− and Bid+/+ mice on the HFAT diet. Results are expressed as mean ± S.D. *, p < 0.05 compared with Bid+/+. F, plasma glucose and insulin concentrations from Bid−/− and Bid+/+ mice on the HFAT diet. G, plasma glucose levels during glucose tolerance test in mice on the CTL and HFAT diet (n = 5 in each group). Data are expressed as mean ± S.D. *, p < 0.01 compared with Bid+/+ on the CTL diet. #, p < 0.01 compared with Bid−/− on HFAT diet. Representative microphotograph of (H) H&E staining, and (I) Oil Red O staining from Bid−/− and Bid+/+ mice on HFAT diet. J, hepatic triglyceride content was determined in livers from Bid−/− and Bid+/+ mice on CTL and HFAT diets and expressed as milligrams per gram of liver tissue. Results are expressed as mean ± S.D. *, p < 0.01 compared with Bid+/+ on HFAT diet.
Adipocyte Apoptosis Is Present in Obese Humans and Correlates with ATM Number and Markers of Insulin Resistance
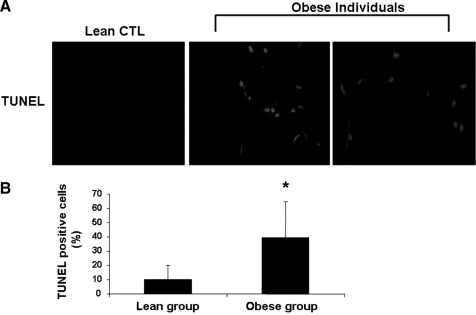
Next, we investigated whether human obesity is also associated with increased adipocyte apoptosis. We assessed apoptosis in AT from a well-characterized group of obese subjects undergoing bariatric surgery and lean controls by TUNEL staining and immunohistochemistry for activated caspase 3. In adipose tissue from control patients, only a few isolated TUNEL-positive cells were noted (Fig. 6A). In contrast, TUNEL-positive cells were readily observed in adipose tissue from obese subjects (Fig. 6A). Quantification of TUNEL-positive cells showed a marked increase in TUNEL-positive cells in obese subjects compared with controls (39.6 ± 25 versus 9.8 ± 10% positive cells p = 0.01) (Fig. 6B). Consistent with previous reports, we found increased infiltration of adipose tissue of obese subjects with macrophages as demonstrated by immunohistochemistry with the macrophage marker CD68 (31 ± 10 versus 6 ± 5% positive cells, p < 0.05). The presence of TUNEL-positive cells positively correlated with percentage of CD68-positive cells (r2 = 0.36, p < 0.05), as well as fasting glucose levels (r2 = 0.35, p = 0.04).
FIGURE 6.
Adipocyte apoptosis is increase in human obesity. A, representative microphotograph of TUNEL staining of section from omental fat biopsies from obese subjects (n = 8) undergoing laprascopic bariatric surgery and from lean healthy controls (n = 7) undergoing abdominal surgery for unrelated reasons. B, quantitation of TUNEL staining in adipose sections from the two groups of patients by counting the number of TUNEL-positive cells in 10 random microscopic fields. Results are expressed as mean ± S.D. *, p < 0.01 compared with lean subjects.
DISCUSSION
The principal findings of this study relate to the mechanisms linking adipose tissue expansion associated with obesity to ATM recruitment, hepatic steatosis, and insulin resistance. Results demonstrate that adipocyte apoptosis is prominent in both obese mice and humans. Two fundamental pathways of apoptosis are activated in adipose tissue of two dietary models of obesity and inhibition of these pathways prevents adipocyte apoptosis and results in protection from macrophage infiltration of adipose tissue, hepatic steatosis, and insulin resistance.
Obesity has reached epidemic proportions in most of the Western World and is strongly associated with insulin resistance and nonalcoholic fatty liver disease (28, 29). Many lines of evidence have shown that a state of chronic low grade inflammation is a key link between obesity and the associated metabolic dysregulation (5, 10, 13, 30). An important initiator of this inflammatory response is the adipose tissue, which actively secretes a variety of products such as cytokines, adipokines, and fatty acids into the circulation (7). Macrophages, that infiltrate the adipose tissue of obese mice and humans, are a major source for some of these products, especially of pro-inflammatory cytokines such as TNF-α and IL-6 (7–9). ATM has been proposed as a link between obesity and insulin resistance; however, the mechanisms that initiate macrophage recruitment to adipose tissue and inflammation remain incompletely understood. In the setting of obesity, the inability to appropriately expand adipose tissue may be a key mechanism responsible for development of inflammation and insulin resistance (31). Increased production and release of certain chemokines by hypertrophied adipocytes potentially as a result of local hypoxia in an expanding adipose tissue bed has been implicated (14,15). Additionally, dying cells might display attraction signals to induce the migration of phagocytes to the site of cell death (32). Consistent with this concept, recent studies have reported the presence of crown-like structures in adipose tissue of obese mice and humans that are formed by clusters of macrophages surrounding what morphologically appeared as “necrotic” adipocytes (16–18). However, it has remained unclear whether adipocyte cell death is a late event and a consequence of inflammation or a process that can actually initiate ATM recruitment. Moreover, the molecular, signaling events resulting in adipocyte cell death remained completely unknown. This issue is of outmost importance as it has become clear that cell death represents a highly heterogeneous process that can follow the activation of distinct biochemical pathways, and thus classical morphologic criteria cannot be used in isolation to classify cell death into clear cut categories (33) We have now shown that the diet-induced hypertrophied adipose tissue of obese C57BL6 mice is under apoptotic pressure as evidenced by a marked pro-apoptotic gene expression profile. The importance of the changes in gene expression observed is supported by the findings that inhibition of adipocyte cell death in Bid knockout mice was sufficient to prevent macrophage infiltration of adipose tissue, and protected against development of insulin resistance and hepatic steatosis associated with diet-induced obesity. The precise contribution to the changes observed in gene expression of the different components of the diet, such as fat amount or composition versus other components of the diet versus genetic susceptibility, will require further study.
We found that feeding mice either a high saturated fat diet or a high sucrose diet, which typically results in obesity, insulin resistance, abnormal lipid profiles, and hepatic steatosis, were also associated with a marked increase in caspase 3 activation in adipocytes and apoptotic cell death. Moreover, we observed increased expression of several proteins that are involved in the two fundamental pathways of apoptosis (27): the extrinsic pathway mediated by death receptors at the cell surface, and the intrinsic or mitochondrial-mediated pathway (34). Indeed, we observed enhanced Fas (CD95 or APO-1), a key death receptor belonging to the TNF receptor family, as well as its specific ligand (FasL). Recent studies have also associated both Fas and FasL with the metabolic state in humans (35, 36). Fas expression is increased in the liver of patients with nonalcoholic fatty liver disease (22, 26, 37). In addition, the serum concentrations of both Fas and FasL were associated with presence of type 2 diabetes, hypertension, and cardiovascular disease (35). Engagement of Fas by FasL triggers the cleavage and activation of the initiator caspase 8, which will then cleave and activate the effector caspases mainly caspase 3 either directly or indirectly through a mitochondrial amplification loop (38). This loop is initiated by caspase 8 cleavage of Bid to generate truncated Bid or tBid. Our results with various mouse models of obesity have shown that Fas signaling pathway is activated in the adipose tissue of these mice. The presence of tBid made us hypothesize that mitochondrial dysfunction plays a role in the apoptotic process observed in the adipose tissue of obese animals. This was further confirmed by the studies on the Bid knockout mice showing almost complete suppression of adipocyte apoptosis associated with both HFAT and HSD diets. Although based on observations on developing animals and in vitro studies in immortalized cell lines, apoptosis has been perceived to be non-inflammatory, it has become apparent that pathological increases in apoptosis in the context of chronic diseases may directly or indirectly promote inflammation (32, 39). The current data extend these observations and demonstrate that the protection from adipocyte apoptosis seen on the Bid knockout mice was associated with a marked decrease in macrophage infiltration and pro-inflammatory cytokines levels in adipose tissue. Because the Bid knockouts used in our studies is a global knockout rather than tissue specific, the possibility that decreases in apoptosis in other tissues may also contribute to the protection observed in these animals cannot be completely ruled out. However, consistent with what has been reported in the literature (21) and with our long experience with these diets as models of hepatic steatosis, no caspase activation or cell death was detected in the livers of our mice on either HFAT or HSD throughout the duration of the experiments. The precise cellular and molecular mechanisms responsible for up-regulation and activation of the apoptotic signaling pathways in adipocytes require further investigation.
The observations in mouse models can be extrapolated to human obesity. Indeed, our results indicate that adipocyte apoptosis was markedly increased in omental fat from obese subjects. Moreover, we further identified a relationship between adipocyte apoptosis, the magnitude of adipose tissue infiltration by macrophages, and systemic markers of insulin resistance.
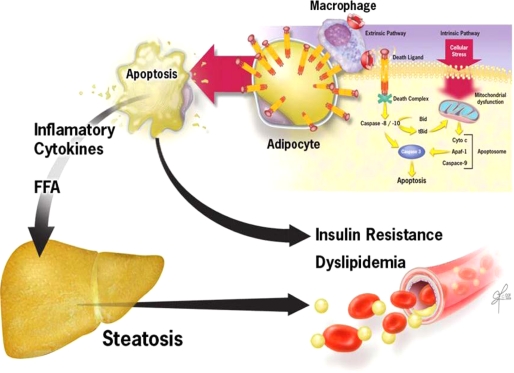
In summary, current studies uncover a key pathogenic role for adipocyte apoptosis in the recruitment of macrophages to adipose tissue, inflammation, and subsequent metabolic disruption resulting in insulin resistance and hepatic lipid accumulation. Results support a model (Fig. 7) in which during the development of obesity, the inability to adequately expand the adipose tissue triggers adipocyte apoptosis, ATM recruitment, and development of insulin resistance, dyslipidemia, and hepatic steatosis. Anti-apoptotic therapy target at inhibiting either the Fas- or mitochondrial-mediated pathways may be a new therapeutic strategy for treatment of obesity-associated metabolic complications.
FIGURE 7.
Proposed model for role of adipocyte apoptosis in metabolic complications of obesity. During the development of obesity, expansion of adipose tissue results in activation of apoptotic signaling including death receptor and mitochondrial pathways. These cytotoxic signaling pathways result in activation of effector caspases and adipocyte apoptosis. Pathologic increase in apoptosis results in ATM recruitment, with subsequent development of insulin resistance, hepatic steatosis, and dyslipidemia. Anti-apoptotic therapy target at inhibiting either the Fas- or mitochondrial-mediated pathways may be a new therapeutic strategy for treatment of obesity-associated metabolic complications.
Supplementary Material
Acknowledgment
We thank Dr. Xia-Ming Yin (University of Pittsburgh) for the generous gift of the Bid-KO mice.
This work was supported, in whole or in part, by National Institutes of Health Grants DK076852 and DK082451 (to A. E. F.).

The on-line version of this article (available at http://www.jbc.org) contains supplemental Table S1.
- AT
- adipose tissue
- ATM
- adipose tissue macrophages
- TUNEL
- terminal deoxynucleotidyltransferase-mediated dUTP nick end-labeling
- BSA
- bovine serum albumin
- SCD
- stearoyl-CoA desaturase
- FFA
- free fatty acids
- NAFLD
- nonalcoholic fatty liver disease
- NASH
- nonalcoholic steatohepatitis
- H&E
- hematoxylin and eosin
- HFAT
- high fat
- HSD
- high sucrose
- CTL
- control
- TG
- triglycerides
- DAPI
- 4′,6-di amidino-2-phenylindole
- IL
- interleukin
- TNF
- tumor necrosis factor.
REFERENCES
- 1.Staels B. (2006) Nat. Med. 12, 54–55 [DOI] [PubMed] [Google Scholar]
- 2.Weiss R., Dziura J., Burgert T. S., Tamborlane W. V., Taksali S. E., Yeckel C. W., Allen K., Lopes M., Savoye M., Morrison J., Sherwin R. S., Caprio S. (2004) N. Engl. J. Med. 350, 2362–2374 [DOI] [PubMed] [Google Scholar]
- 3.Browning J. D., Horton J. D. (2004) J. Clin. Invest. 114, 147–152 [DOI] [PMC free article] [PubMed] [Google Scholar]
- 4.Tilg H., Moschen A. R. (2008) Mol. Med. 14, 222–231 [DOI] [PMC free article] [PubMed] [Google Scholar]
- 5.Tilg H., Moschen A. R. (2008) Trends Endocrinol. Metab. 19, 371–379 [DOI] [PubMed] [Google Scholar]
- 6.Postic C., Girard J. (2008) J. Clin. Invest. 118, 829–838 [DOI] [PMC free article] [PubMed] [Google Scholar]
- 7.Schenk S., Saberi M., Olefsky J. M. (2008) J. Clin. Invest. 118, 2992–3002 [DOI] [PMC free article] [PubMed] [Google Scholar]
- 8.Wellen K. E., Hotamisligil G. S. (2005) J. Clin. Invest. 115, 1111–1119 [DOI] [PMC free article] [PubMed] [Google Scholar]
- 9.Neels J. G., Olefsky J. M. (2006) J. Clin. Invest. 116, 33–35 [DOI] [PMC free article] [PubMed] [Google Scholar]
- 10.Weisberg S. P., McCann D., Desai M., Rosenbaum M., Leibel R. L., Ferrante A. W., Jr. (2003) J. Clin. Invest. 112, 1796–1808 [DOI] [PMC free article] [PubMed] [Google Scholar]
- 11.Weisberg S. P., Hunter D., Huber R., Lemieux J., Slaymaker S., Vaddi K., Charo I., Leibel R. L., Ferrante A. W., Jr. (2006) J. Clin. Invest. 116, 115–124 [DOI] [PMC free article] [PubMed] [Google Scholar]
- 12.Hevener A. L., Olefsky J. M., Reichart D., Nguyen M. T., Bandyopadyhay G., Leung H. Y., Watt M. J., Benner C., Febbraio M. A., Nguyen A. K., Folian B., Subramaniam S., Gonzalez F. J., Glass C. K., Ricote M. (2007) J. Clin. Invest. 117, 1658–1669 [DOI] [PMC free article] [PubMed] [Google Scholar]
- 13.Lumeng C. N., Bodzin J. L., Saltiel A. R. (2007) J. Clin. Invest. 117, 175–184 [DOI] [PMC free article] [PubMed] [Google Scholar]
- 14.Ye J., Gao Z., Yin J., He Q. (2007) Am. J. Physiol. Endocrinol. Metab. 293, E1118–1128 [DOI] [PubMed] [Google Scholar]
- 15.Pang C., Gao Z., Yin J., Zhang J., Jia W., Ye J. (2008) Am. J. Physiol. Endocrinol. Metab. 295, E313–E322 [DOI] [PMC free article] [PubMed] [Google Scholar]
- 16.Strissel K. J., Stancheva Z., Miyoshi H., Perfield J. W., 2nd, DeFuria J., Jick Z., Greenberg A. S., Obin M. S. (2007) Diabetes 56, 2910–2918 [DOI] [PubMed] [Google Scholar]
- 17.Murano I., Barbatelli G., Parisani V., Latini C., Muzzonigro G., Castellucci M., Cinti S. (2008) J. Lipid Res. 49, 1562–1568 [DOI] [PubMed] [Google Scholar]
- 18.Cinti S., Mitchell G., Barbatelli G., Murano I., Ceresi E., Faloia E., Wang S., Fortier M., Greenberg A. S., Obin M. S. (2005) J. Lipid Res. 46, 2347–2355 [DOI] [PubMed] [Google Scholar]
- 19.Yin X. M., Wang K., Gross A., Zhao Y., Zinkel S., Klocke B., Roth K. A., Korsmeyer S. J. (1999) Nature 400, 886–891 [DOI] [PubMed] [Google Scholar]
- 20.Nanji A. A. (2004) Clin. Liver Dis. 8, 559–574, ix [DOI] [PubMed] [Google Scholar]
- 21.Koteish A., Diehl A. M. (2001) Semin. Liver Dis. 21, 89–104 [DOI] [PubMed] [Google Scholar]
- 22.Feldstein A. E., Canbay A., Guicciardi M. E., Higuchi H., Bronk S. F., Gores G. J. (2003) J Hepatol. 39, 978–983 [DOI] [PubMed] [Google Scholar]
- 23.Feldstein A. E., Werneburg N. W., Canbay A., Guicciardi M. E., Bronk S. F., Rydzewski R., Burgart L. J., Gores G. J. (2004) Hepatology 40, 185–194 [DOI] [PubMed] [Google Scholar]
- 24.Li Z. Z., Berk M., McIntyre T. M., Feldstein A. E. (2009) J. Biol. Chem. 284, 5637–5644 [DOI] [PMC free article] [PubMed] [Google Scholar]
- 25.Patsouris D., Li P. P., Thapar D., Chapman J., Olefsky J. M., Neels J. G. (2008) Cell Metab. 8, 301–309 [DOI] [PMC free article] [PubMed] [Google Scholar]
- 26.Feldstein A. E., Canbay A., Angulo P., Taniai M., Burgart L. J., Lindor K. D., Gores G. J. (2003) Gastroenterology 125, 437–443 [DOI] [PubMed] [Google Scholar]
- 27.Green D. R. (2005) Cell 121, 671–674 [DOI] [PubMed] [Google Scholar]
- 28.Angulo P. (2007) Nutr. Rev. 65, S57–S63 [DOI] [PubMed] [Google Scholar]
- 29.Friedman J. M. (2000) Nature 404, 632–634 [DOI] [PubMed] [Google Scholar]
- 30.Diehl A. M., Clarke J., Brancati F. (2003) Endocr. Pract. 9, Suppl. 2, 93–96 [DOI] [PubMed] [Google Scholar]
- 31.Kim J. Y., van de Wall E., Laplante M., Azzara A., Trujillo M. E., Hofmann S. M., Schraw T., Durand J. L., Li H., Li G., Jelicks L. A., Mehler M. F., Hui D. Y., Deshaies Y., Shulman G. I., Schwartz G. J., Scherer P. E. (2007) J. Clin. Invest. 117, 2621–2637 [DOI] [PMC free article] [PubMed] [Google Scholar]
- 32.Lauber K., Bohn E., Kröber S. M., Xiao Y. J., Blumenthal S. G., Lindemann R. K., Marini P., Wiedig C., Zobywalski A., Baksh S., Xu Y., Autenrieth I. B., Schulze-Osthoff K., Belka C., Stuhler G., Wesselborg S. (2003) Cell 113, 717–730 [DOI] [PubMed] [Google Scholar]
- 33.Kroemer G., Galluzzi L., Vandenabeele P., Abrams J., Alnemri E. S., Baehrecke E. H., Blagosklonny M. V., El-Deiry W. S., Golstein P., Green D. R., Hengartner M., Knight R. A., Kumar S., Lipton S. A., Malorni W., Nuñez G., Peter M. E., Tschopp J., Yuan J., Piacentini M., Zhivotovsky B., Melino G. (2009) Cell Death Differ. 16, 3–11 [DOI] [PMC free article] [PubMed] [Google Scholar]
- 34.Green D. R. (1998) Cell 94, 695–698 [DOI] [PubMed] [Google Scholar]
- 35.Cosson E., Bringuier A. F., Paries J., Guillot R., Vaysse J., Attali J. R., Feldmann G., Valensi P. (2005) Diabetes Metab. 31, 47–54 [DOI] [PubMed] [Google Scholar]
- 36.Nolsøe R. L., Hamid Y. H., Pociot F., Paulsen S., Andersen K. M., Borch-Johnsen K., Drivsholm T., Hansen T., Pedersen O., Mandrup-Poulsen T. (2006) Genes Immun. 7, 316–321 [DOI] [PubMed] [Google Scholar]
- 37.Zou C., Ma J., Wang X., Guo L., Zhu Z., Stoops J., Eaker A. E., Johnson C. J., Strom S., Michalopoulos G. K., DeFrances M. C., Zarnegar R. (2007) Nat. Med. 13, 1078–1085 [DOI] [PubMed] [Google Scholar]
- 38.Eugenia Guicciardi M., Gores G. J. (2009) FASEB J. 23, 1625–1637 [DOI] [PMC free article] [PubMed] [Google Scholar]
- 39.Syn W. K., Choi S. S., Diehl A. M. (2009) Clin. Liver Dis. 13, 565–580 [DOI] [PMC free article] [PubMed] [Google Scholar]
Associated Data
This section collects any data citations, data availability statements, or supplementary materials included in this article.


