Abstract
Plant sterols may induce a Th1 shift in humans. However, whether plant stanols have similar effects as well as the underlying mechanism are unknown. We have now shown that (like sitosterol) sitostanol, both 4-desmethylsterols, induces a Th1 shift when added in vitro at physiological concentrations to human PBMCs. This conclusion was based on a higher IFNγ production, with no change in the production of IL-4 and IL-10. α-Amyrin, a 4.4-dimethylsterol, had comparable effects. Because 4.4-dimethylsterols cannot activate transcription factor LXR, this finding indicates that LXR activation was not involved. Sitosterol and sitostanol did not alter the production of IL-12 and IL-18 in PBMCs as well as in monocyte-derived U937 cells, suggesting that plant sterols directly affect T-helper cells, without activating APCs. However, in PBMCs treated with a TLR2 blocker (T2.5), IFNγ production was completely inhibited, whereas blocking TLR4 with HTA125 had no such effect. To confirm these findings, PBMCs from TLR2−/− mice were cultured in the presence of sitosterol and sitostanol. In these cells, no Th1 shift was observed. Our results, therefore, indicate that TLR2 activation is essential to induce a Th1 shift in human PBMCs by plant stanols and plant sterols.
Keywords: Cytokine, Immunology, Interferon, Interleukin, Toll-like Receptors, Th1/Th2 Balance, Sitostanol, Sitosterol
Introduction
The human body responds to infectious challenges by a wide variety of cellular and humoral responses, in which numerous cells and factors play a role. During these responses, CD4+ T-cells develop into distinct T-helper (Th)2 subsets upon antigen presentation, a process strongly influenced by the type of pathogen invading the host. T-helper cells can be divided into Th1 cells, Th2 cells, Th17 cells, and CD4+CD25+ cells, which are also known as Th3 or forkhead box protein P3+ (Foxp3+) regulatory T-cells (Treg). Th1 and Th2 cells are characterized by the excretion of specific cytokine patterns upon stimulation: i.e. IL-2 and IFNγ for Th1 cells, and IL-4, IL-5, and IL-13 for Th2 cells (1, 2). Ideally, Th1 and Th2 cells function in a situation where they maintain mutual balance. Changes in the Th1/Th2 balance toward Th2 dominant immunity induced by Th2 overactivation are associated with conditions like allergies (2) and asthmatic responses (3). An impaired Th1 activity, which may also result in a Th2 dominant response, is a known characteristic of the elderly (4), patients with diabetes mellitus type II (5), and HIV patients (6). Foxp3+ Treg cells can inhibit the activity of either T-helper subset, through cell to cell contact, and by the secretion of the cytokines IL-10 and TGFβ (7).
Immune function is influenced by environmental and genetic factors, which contribute to the variation between individuals in resistance against infections (8). Effects of environmental factors such as changes in dietary habits on the processes underlying Th1/Th2 cell characteristics have not been well studied. However, a few studies have shown that consumption of specific food components may cause a shift in the Th1/Th2 balance to either side (9–12). Among these components are plant sterols, which have been suggested to stimulate Th1 activity (13–16). Till now, plant sterols, of which sitosterol is the most common variant in nature, are mainly known for their LDL cholesterol-lowering activity (17). Their molecular structure is almost identical to that of cholesterol, e.g. for sitosterol there is only an additional ethyl group present at carbon atom 24 located in the side chain of the molecule. Plant stanols are less common in nature, but are made by saturation of plant sterols. Therefore, their structure is comparable to that of plant sterols but lack the double bond in their ring structure. In contrast to plant sterols, the effects of plant stanols on the Th1/Th2 balance have not been studied or even suggested. In this respect, it is important to consider that serum plant stanol concentrations are 10–20-fold lower than those of plant sterols, even after supplementation (18, 19). The earlier human intervention studies in which an effect of plant sterols on Th1 stimulation was suggested (13–15) used mixtures providing daily 60 mg of pinewood-derived sterols plus 0.6 mg of sterolins. Considering the normal daily plant sterol intake, which varies between 300 and 500 mg (20), it is at least unexpected that the effects observed are due to this relatively small increase in plant sterol intake.
Moreover, the mechanism underlying the reported Th1 shift after plant sterol consumption remains unknown. One possible pathway could be that plant sterols activate APCs, which results in a strong Th1 cell activation via elevated IL-12 or IL-18 production (1, 21). A second possibility could be (as also suggested by Calpe-Berdiel et al. (16, 22)) activation of transcription factor LXR, which may play a role in innate immunity (23). Indeed, we among others have shown that plant sterols can activate LXR (24, 25). By using a cell-free ligand sensing assay (LiSA), we have earlier shown that 4-desmethylsterols (e.g. sitosterol, sitostanol) but not 4,4-dimethylsterols (e.g. α-amyrin), which have different effects on cholesterol metabolism (26), activate transcription factor LXR (24). Therefore, these two plant sterol families can be used to examine whether LXR is involved in the plant sterol-induced Th1 shift. A third explanation might relate to activation of pattern recognition receptors such as TLR2 and -4. In this respect, it is known that TLR2 activation increases T-cell activity and inhibits suppressor activity by regulatory T-cells (27). Moreover, inhibition of TLR2 resulted in lower activity of Th1 cells in mice (28). The current perception is that TLR2 responds to lipid-based conserved patterns like peptidoglycan, lipoproteins, and lipopeptides of Gram-positive bacteria (29). Because plant sterols and stanols are also fatty compounds, a novel explanation for the observed Th1 shift could relate to activation of specific TLRs.
In view of these considerations, the aims of the experiments described here were to: 1) determine a dose-response relationship between plant stanols and sterols and the Th1/Th2 balance ex vivo; 2) evaluate a possible effect of plant stanols and sterols on Foxp3+ regulatory T-cells; and 3) unravel whether APCs and/or Toll-like receptors play a role in the plant stanol and sterol-induced effect on the Th1/Th2 balance.
EXPERIMENTAL PROCEDURES
Cell Culture
Blood was drawn from healthy volunteers using heparin tubes (Becton & Dickinson) followed by isolation of peripheral blood mononuclear cells (PBMCs), using Lymphoprep gradient centrifugation as described by the manufacturer (Nycomed). 1 × 10⁶ cells/ml were cultured in 24-well flat bottom plates under standard culture conditions in RPMI 1640 containing l-glutamine and 25 mm HEPES (Invitrogen) supplemented with 1% penicillin/streptomycin (PS), 1% sodium pyruvate (SP), and 1% heat-inactivated human serum pool. Next, the cells were stimulated for 52 h with 50 μg/ml phytohemagglutinin (PHA) (Roche) unless indicated otherwise.
Different concentrations of cholesterol, sitosterol, sitostanol, or α-amyrin (Sigma) were added to the culture, using 2 mm 2-hydroxypropyl-β-cyclodextrin (Sigma-Aldrich) as a carrier. For this, in ethanol-dissolved sterol, stock solutions were evaporated under nitrogen, redissolved in cyclodextrin, as described earlier by Awad et al. (30) and added to the culture medium. Conventional carriers for the plant sterols could not be used because 1) ethanol itself already strongly inhibits IFNγ production even in very low concentrations hereby disturbing the regulation of our main outcome parameter, and 2) lipoprotein carriers are not applicable because enrichment of lipoproteins with tightly controlled specific plant sterol concentrations is not possible, making the model less well controlled. We added 0.6 μm and 6 μm sitostanol and sitosterol, respectively, as these are physiological serum concentrations in humans (31). To evaluate the effects of increased serum plant stanol and sterol concentrations, 1.2 μm sitostanol and 12 μm sitosterol were used to mimic the physiological plant stanol and sterol concentrations after dietary supplementation (31). For all conditions, cholesterol was used in the same concentrations to unravel whether changes were a general sterol effect or a specific plant sterol effect. In all experiments the control condition contained only 50 μg/ml PHA and 2 mm cyclodextrin.
The ligands Pam3Cys-Ser-(Lys)4 hydrochloride (PAM) (1, 2.5, and 5 μg/ml, Calbiochem) and LPS (Escherichia coli 055:B5, 0.1, 1, and 10 ng/ml; Sigma) were used for direct stimulation of, respectively, TLR2 and TLR4 pattern recognition receptors on PBMCs. A TLR2-blocking antibody (clone T2.5, 5 μg/ml, Hycult Biotechnology) and a TLR4-blocking antibody (clone HTA125, 10 μg/ml; Hycult Biotechnology) were used to evaluate the role of TLR2 and TLR4 signaling in the plant sterol-induced effects.
To analyze the effects of plant sterols and stanols on the behavior of APCs, experiments were also performed in a monocyte cell line, i.e. the human-derived U937 cells (ATCC, LGC Promochem, Caucasian). For this, 1 × 10⁶ U937 cells/ml were seeded in 6-well flat bottom plates and cultured in RPMI 1640 (Invitrogen) containing 2 mm l-glutamine supplemented with 10% fetal bovine serum, 1% PS, and 1% SP. Prior to the experiments, U937 cells were stimulated for 24 h with 50 nm PMA (Sigma) for differentiation into macrophages. Afterward, cells were treated with cholesterol, sitosterol, and sitostanol as described for the PBMC experiment, either in the presence or absence of LPS (E. coli 055:B5, 1 ng/ml; Sigma). Effects on IL-12 and IL-18 concentrations in the culture supernatant were measured in time up to 48 h.
Mice
To further evaluate the role of TLR2, we repeated the cell culture experiments described above with PBMCs from TLR2−/− mice on a C57Bl6 background (kindly provided by Dr. Leo Joosten, UMC St Radboud, Nijmegen, The Netherlands). The male mice used in this experiment were 5–7 months old. PBMCs from C57Bl6 mice similar in gender and age were used as a control.
Proliferation Assays
To evaluate whether potential effects of plant sterols and stanols on T-cell-derived cytokine production could be explained by a change in T-cell proliferation, isolated human PBMCs were seeded in 96-well flat bottom culture plates. The cells were cultured in RPMI 1640 containing l-glutamine (Invitrogen), supplemented with 10% fetal calf serum, 2% PS, and 50 μm 2-mercaptoethanol (Merck). T-cell proliferation was stimulated with 5 μg/ml concanavalin A for 72 h. [3H]Thymidine 1mCi/ml, specific activity 74 Gbq/mmol, 2 Ci/mmol (Amersham Biosciences), diluted 1:40 in culture medium before use, was added to the cells (10 μl/well) for the last 24 h. [3H]Thymidine incorporation was measured in cell lysates with a β-scintillation counter (Wallac) as an indicator for proliferation.
Cytokine Assays
The Q-Plex human cytokine screen array (Quansysbio) was used to simultaneously measure in the culture supernatant the Th1-related cytokines IL-2 and IFNγ, and the Th2-related cytokines IL-4, IL-5, and IL-13. The data were analyzed using the Quansys Array software. In addition, we used a sandwich ELISA for the quantification of Treg cytokine IL-10 (Perbio). For the analysis of IFNγ (Perbio), and IL-4 (eBioscience) concentrations, sandwich ELISAs were used, because these cytokines were not measured correctly on the array due to technical imperfections. The main problem was that the coating of the different antibodies overlapped, which made it impossible to distinguish between cytokine spots. In the experiments with murine PBMCs, cytokine concentrations in the culture medium were measured using sandwich ELISAs for IFNγ, IL-4, and IL-10 (Perbio). Finally, in cell culture medium of the U937 cells, concentrations of IL-12 (R&D systems) and IL-18 (BioConnect) were measured by sandwich ELISAs to evaluate the possible change in APC activity.
Treg Cell Population Size
Flow cytometry was used for the evaluation of changes in the size of the Treg cell population. PBMCs cultured for 52 h in the presence of PHA, and the different sterols were labeled with anti-CD4-FITC, anti-Foxp3-PE, anti-CD25-PerCP, and anti-CD3-APC (eBioscience). Fixation and permeabilization were performed after surface staining, using the Foxp3 staining buffer set according to the manufacturer's instructions (eBioscience). All FACS data were acquired on a FACS Calibur flow cytometer (Becton & Dickinson) and analyzed using WinMDI 2.8 software.
Statistics
Statistical significance of differences in cytokine concentrations in the culture medium was assessed using the Mann Whitney U test for non-parametric independent measurements. p values of less than 0.05 were considered to be statistically significant.
RESULTS
Sitosterol and Sitostanol Induce a Th1 Shift in Human PBMCs ex Vivo
We first determined the responses of human PBMCs ex vivo cultured with different concentrations sitosterol, sitostanol, or cholesterol. For this, freshly isolated human PBMCs were cultured up to 56 h in the presence of PHA to determine time kinetics for the analysis of cytokine production.
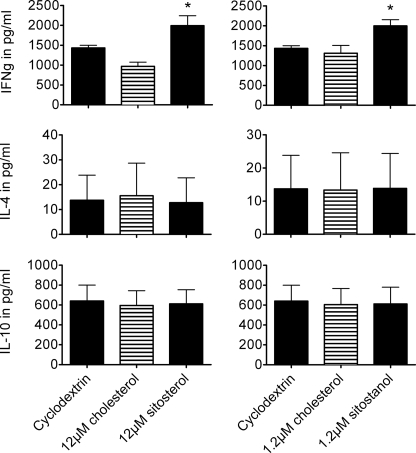
To obtain a broad insight into the effects of sitosterol on the cytokines produced, in general, and cytokines reflecting the Th1/Th2 balance, in particular, we measured the concentrations of different cytokines present in culture medium of the treated cells using the QuansysBio human screen array. Incubation with sitosterol for 16 h resulted in a 47% increase of IL-2 production and a 27 and 73% decrease in the production of IL-5 and IL-13, respectively, as compared with incubation with cholesterol. No changes in IL-10 production were found (data not shown), while IL-4 concentrations were below the detection limit. To complete the array results we measured IFNγ and IL-4 using sandwich ELISAs (Perbio and eBioscience respectively), while IL-10 was measured by sandwich ELISAs (Perbio) to validate the results of the human cytokine screen array. IFNγ concentrations increased with 99.5% (p = 0.009) in the culture medium of the cells cultured with 12 μm sitosterol. Interestingly, in the 1.2 μm sitostanol condition IFNγ concentrations increased as well, with 52.5% (p = 0.028) as compared with cholesterol. At lower concentrations of sitostanol and sitosterol, 0.6 μm and 6 μm respectively, there were no differences in IFNγ concentrations between the cyclodextrin, cholesterol, and plant sterol conditions (data not shown). No changes in IL-4 production were seen after sitosterol incubation (p = 1.000) or sitostanol incubation (p = 0.827) as compared with the cholesterol conditions. The results from the IL-10 ELISA were consistent with the results from the array, and no differences between carrier, cholesterol, sitosterol, and sitostanol conditions were found (Fig. 1). These results are therefore in line with the previously observed Th1 dominant response induced by sitosterol (14–16). Moreover, we show here that this is also evident for sitostanol, although already at 10-fold lower concentrations.
FIGURE 1.
Sitosterol as well as sitostanol increased the production of IFNγ in human PBMCs, but not the production of IL-4 and IL-10. Data are shown as mean ± S.E., n = 5. Human PBMCs were cultured for 52 h in the presence of 50 μg/ml PHA, 2 nm cyclodextrin (carrier), and either 1.2 μm or 12 μm cholesterol or 1.2 μm sitostanol or 12 μm sitosterol. *, p < 0.05.
Sitosterol or Sitostanol Does Not Affect IL-12 or IL-18 Production by Human Macrophages
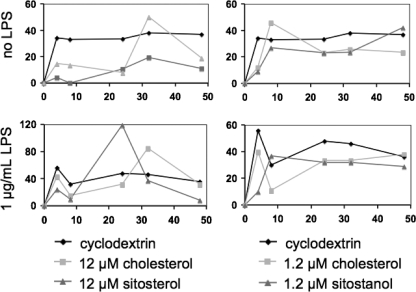
Because it is generally accepted that cytokines produced by APCs influence the shift in T-helper cell subtype (1), we evaluated the effects of sitosterol and sitostanol on the secretion of the cytokines IL-12 and IL-18. Freshly obtained human PBMCs were isolated and cultured as described above, in the presence of each of the sterols and PHA. In the culture medium, no detectable concentrations of the monocyte-derived cytokines IL-12 and IL-18 could be demonstrated after sitosterol and sitostanol incubation. Therefore, to evaluate the specific effects of plant sterols on macrophages, cells from the human monocyte-derived cell line U937 were cultured for 24 h in the presence of 50 nm PMA, which stimulated their differentiation into macrophage cells. In addition, effects of all control and sterol conditions were evaluated in the presence or absence of bacterial LPS, which was given to the cells after 24 h of incubation with PMA. Sitosterol and sitostanol were added to the cells as described under “Experimental Procedures.” Differentiated U937 cells produced no detectable amounts of IL-12, whereas the concentrations of IL-18 were measurable. As shown in Fig. 2, no significant differences in the area under the curve of IL-18 concentrations were observed by addition of sitosterol or sitostanol to the culture medium, either with or without the presence of LPS.
FIGURE 2.
IL-18 production by differentiated U937 cells was not altered by the addition of sitosterol or sitostanol. Results shown are representative of three experiments. The IL-18 production by differentiated U937 cells were measured at different time points up to 48 h as indicated on the x axis. The area under the curve did not differ between carrier control, cholesterol control, and sitosterol or sitostanol. Simultaneous stimulation of the cells with LPS did not show any different effects.
4-Desmethylsterols and 4.4-Dimethylsterols Have Similar Effects on IFNγ, IL4, and IL-10 Production
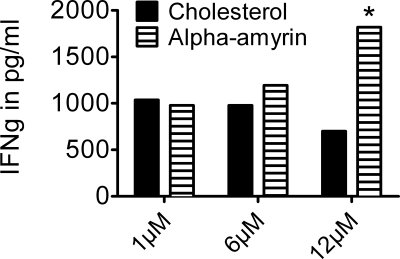
PBMCs were cultured in the presence of α-amyrin, a sterol from the 4,4-dimethyl family. As shown in Fig. 3, incubation of human PBMCs with α-amyrin increased IFNγ production dose-dependently, when compared with cholesterol conditions, with an increase of 160% (p = 0.004) at the highest concentration of α-amyrin (12 μm). The production of IL-4 and IL-10 was not affected by α-amyrin (data not shown). As sitosterol, sitostanol, and α-amyrin have similar effects on cytokine production in human PBMCs, it is unlikely that these effects are caused by activation of transcription factor LXR, as only 4-desmethylsterols are capable of LXR activation (24).
FIGURE 3.
α-Amyrin increased IFNγ production in human PBMCs similar to sitosterol. Results shown are most representative of three experiments. Human PBMCs were cultured for 52 h in the presence of 50 μg/ml PHA, 2 nm cyclodextrin (carrier), and either 12 μm cholesterol or 12 μm α-amyrin. α-Amyrin, a sterol from the 4,4-dimethylsterol family, increases IFNγ production by human PBMCs dose-dependently and similar to sitosterol, a sterol of the 4-desmethylsterol family. *, p < 0.05.
Blocking TLR2 Reverses the Plant Sterol and Stanol Effects on IFNγ Production
As a third possibility to explain the observed Th1 shift after incubation with sitosterol, sitostanol, or α-amyrin, we evaluated the role of Toll-like receptors 2 and 4. Freshly isolated PBMCs were cultured in the presence of a TLR2 blocker (clone T2.5). Moreover, also the effects of PAM (Pam3Cys-Ser-(Lys)4 hydrochloride), a TLR2 ligand, were evaluated.
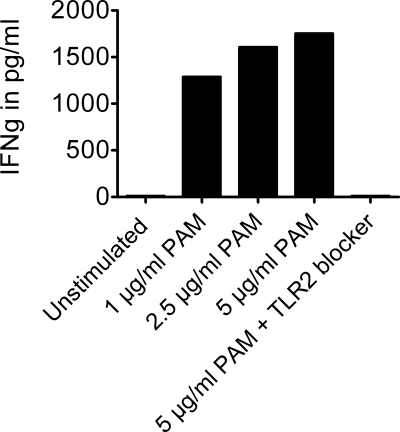
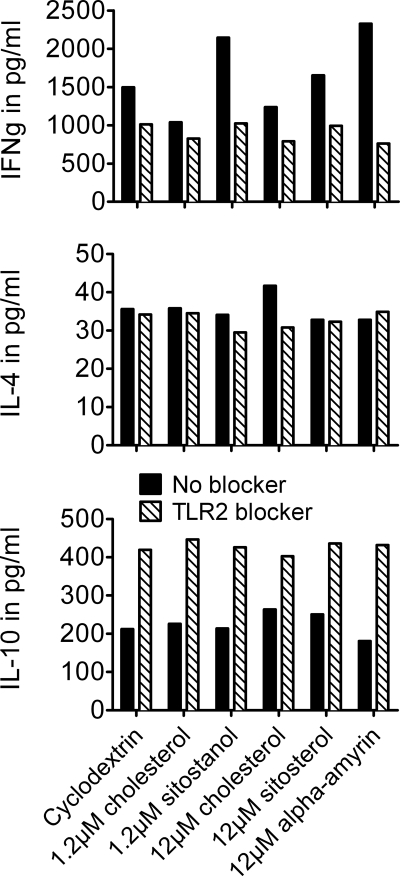
Administration of TLR2 ligand PAM to the cells increased IFNγ production, which was completely reduced after a TLR2 blocker was added to the cells (Fig. 4). Furthermore, blocking TLR2 completely reversed the effects of sitosterol, sitostanol, and α-amyrin on IFNγ production. Without the TLR2 blocker, IFNγ concentrations in the sitostanol condition were 2144 pg/ml and 1037 pg/ml for cholesterol. However, when the TLR2 blocker was added to the cells, the IFNγ concentrations in the sitostanol condition were only 1024 pg/ml, which is similar to the cholesterol condition without a TLR2 blocker (Fig. 5). Blocking TLR2 did not result in different IL-4 concentrations when compared with the conditions without the TLR2 blocker. Unexpectedly, IL-10 concentrations increased after TLR2 blocking, which was independent from sterol treatment (Fig. 5). To evaluate whether the observed Th1 shift was TLR2-specific, TLR4 activity was blocked by a similar approach as used in the above described experiments. However, blocking TLR4 did not interfere with the sitosterol, sitostanol, and α-amyrin induced increases in IFNγ production (data not shown).
FIGURE 4.
TLR2 ligand PAM increased IFNγ production. Addition of increasing concentrations of TLR2 ligand PAM to human PBMCs for 52 h, showed increasing IFNγ production in human PBMCs. After blocking TLR2, IFNγ production was reduced to the same level found in unstimulated PBMCs.
FIGURE 5.
Blocking TLR2 completely reduced the plant sterol- and plant stanol-induced Th1 shift. Results shown are most representative of three experiments. Human PBMCs were cultured for 52 h in the presence of 50 μg/ml PHA, 2 nm cyclodextrin (carrier), and either 1.2 μm or 12 μm cholesterol or 1.2 μm sitostanol or 12 μm sitosterol or 12 μm α-amyrin. After blocking TLR2, the IFNγ production in human PBMCs decreased to the same level seen under cholesterol control conditions. Effects were similar for sitostanol, sitosterol, and α-amyrin. For IL-4 production, no changes were seen after blocking TLR. IL-10 production increased in all conditions after TLR2 was blocked. This effect was independent of the sterol/stanol treatment to cells.
Sitosterol and Sitostanol Do Not Increase IFNγ Production in PBMCs from TLR2−/− Mice
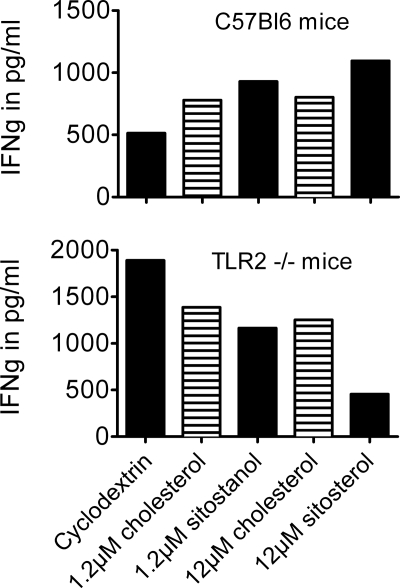
To further confirm the involvement of TLR2 in the effects of plant sterols on the Th1/Th2 balance, we examined the effects of sitosterol and sitostanol on cytokines produced by PHA-stimulated PBMCs isolated from TLR2−/− mice. Freshly isolated PBMCs from these mice were cultured as mentioned under “Experimental Procedures” for 52 h in the presence of 50 μg/ml PHA. Concentrations of the cytokines IFNγ, IL-10, and IL-4 were measured in the culture medium with ELISA assays (Perbio). In contrast to the effects observed in human PBMCs and in PBMCs from C57Bl6 wild-type mice, IFNγ concentrations were lowered in the TLR2−/− PBMC culture, after the addition of either sitosterol or sitostanol. Fig. 6 shows that IFNγ concentrations were decreased by 16.1% in the sitostanol condition and by 31.9% in the sitosterol condition, when compared with similar concentrations of cholesterol. Ambiguous effects were seen on IL-4 production. Unfortunately, IL-10 concentrations were below the assays detection limit.
FIGURE 6.
In PBMCs from C57Bl6 wild-type mice sitosterol and sitostanol induced a Th1 shift, similar as that seen in human PBMCs. This Th1 shift is not seen in PBMCs from TLR2 knock-out mice. Results are shown from pooled samples with four mice in each group. In PBMCs from wild-type mice, an increase in IFNγ production is seen after incubation for 52 h. In contrast, in PBMCs from TLR2 knock-out mice, both sitosterol and sitostanol decreased IFNγ production when compared with carrier control and cholesterol.
No Changes Occur in Regulatory T-cell Population Size after Incubation with Sitosterol, Sitostanol, and α-Amyrin
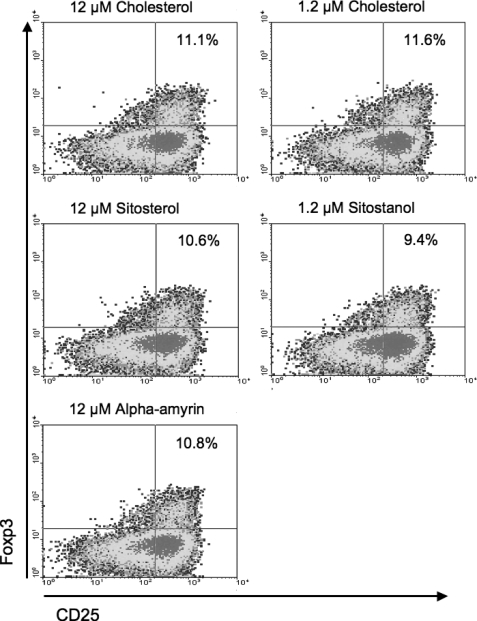
The size of the Treg cell population was measured by flow cytometry. As shown in Fig. 7, we observed that the percentage of CD25++/Foxp3+ cells in human T-cells after the cells were incubated with plant sterols and stanols did not differ from cholesterol conditions. In the 1.2 μm sitostanol condition, there were 9.4% CD25++/Foxp3+ cells as compared with 11.6% in the cholesterol condition. 12 μm sitosterol and α-amyrin conditions showed 10.6% and 10.8% of CD25++/Foxp3+ cells, respectively, compared with 11.1% in the cholesterol condition.
FIGURE 7.
Plant sterols and stanols do not change Treg cell population size. Results shown are most representative of three experiments. Human PBMCs were cultured for 52 h in the presence of 50 μg/ml PHA, 2 nm cyclodextrin (carrier), and either 1.2 μm or 12 μm cholesterol or 1.2 μm sitostanol or 12 μm sitosterol or 12 μm α-amyrin. None of the plant sterols or stanols induced any differences in the percentage of Foxp3+ cells in the total T-cell population when compared with cholesterol.
DISCUSSION
We here present data that sitosterol is able to shift immunity toward a Th1 dominant response, at least ex vivo. A novel finding is that sitostanol has comparable effects, but at 10-fold lower concentrations. Moreover, using different strategies, we showed that the pattern recognition receptor TLR2 may play a crucial role in explaining these effects.
Adding sitosterol or sitostanol to human PBMCs ex vivo increased concentrations of the Th1 cytokines IFNγ and IL-2 when compared with the same concentration of cholesterol. In fact, cholesterol did not show any effects at all. This latter finding indicates that the effect of sitosterol or sitostanol is a plant sterol-specific effect and not a sterol effect in general. On the Th2 side, no differences were seen in IL-4 and IL-10 production in the sitosterol and sitostanol conditions compared with control conditions. Breytenbach et al. (14) showed that a plant sterol/sterolin mixture induced Th1 activity in HIV patients, whereas others reported similar effects for plant sterols in mice (16, 32, 33). Calpe-Berdiel et al. (16) have shown that dietary plant sterol supplementation increased the production of Th1 cytokines IL-2 and IFNγ during acute a-septic inflammation in mice, whereas no changes in the production of IL-4 and IL-10 were observed. They suggested that activation of transcription factor LXR might be the mechanism underlying the plant sterol induced Th1 shift (16, 22). We show here, that both sitosterol and α-amyrin, which belong to respectively the 4-desmethylsterol and 4.4-dimethylsterol family, induce a similar Th1 response. We have earlier shown that only the 4-desmethylsterols like sitosterol and sitostanol can activate LXR but not 4,4-dimethylsterols (24). Therefore, it is not likely that LXR activation is involved.
Blocking TLR2 completely inhibited the effects of sitosterol, sitostanol, and α-amyrin on IFNγ production, but not the production of IL-4 and IL-10. Also, the results with PBMCs isolated from TLR2 knock-out mice suggested that TLR2 was essential in the Th1 response after sitosterol or sitostanol incubations. As reviewed by Sutmuller et al. (27), TLR2 activation increases T-cell activity, as indicated by an increased proliferation and production of different cytokines such as IL-2 and IFNγ. These findings are consistent with our cell culture experiments, as we observed an increased production of these cytokines upon stimulation by sitosterol, sitostanol, and α-amyrin as well as by using the TLR2 ligand PAM. However, we found no changes in CD4+ cell proliferation after plant sterol or stanol addition (data not shown). It is generally accepted that TLRs are abundantly expressed on monocytes and macrophages, but evidence is accumulating that T-cells also express these pattern recognition receptors (27, 34). Because we have used PBMCs, we cannot identify whether the TLR2 that responded to the sitosterol, sitostanol, and α-amyrin was located on monocytes or T-cells. Therefore, the exact role played by APCs in the response to these sterols remains unclear, especially because we found no effects on IL-12 and IL-18 production by APCs after sitosterol or sitostanol treatment. However, Nembrini et al. (35) have shown that communication between APCs and T-cells mainly takes part by cell to cell contact and that cytokine production is of lesser importance and not even necessary to evoke T-cell activity (35). Still, whether plant sterols and stanols activate T-cells by binding to TLR2 on the T-cell itself or to TLR2 present on the APC remains to be evaluated. To examine the actual role of APCs, cell-sorting techniques followed by similar experiments are needed to provide answers. It has also been described that TLR2 activation initiates the proliferation of Treg cells, and inhibits the ability of these cells to suppress the activity of effector T-cells, thereby enhancing the immune response (27, 34, 36). In our experiments, we did not see a change in IL-10 production after sitosterol, sitostanol, or α-amyrin incubation. Flow cytometric analysis of Treg cells stained for intracellular Foxp3 protein showed no changes in the population size of the Foxp3+ cells, when plant sterol and stanol conditions were compared in control conditions. This indicates that changes in Treg population size and the IL-10 production by these cells are not involved in the observed Th1 shift. The absence of an effect of plant sterol on IL-10 production deviates from earlier findings by Nashed et al. (33) and Desai et al. (37). However this might be explained by differences in species, culture time, and mitogen. Moreover, findings by Calpe-Berdiel et al. (16), who also did not find any effect of plant sterol in IL-10 support our results.
Whether the ex vivo or in vitro observations in studies using isolated cell types can be extrapolated to the in vivo situations remains to be established. However, earlier studies have already suggested that dietary enrichment with plant sterols can change the Th1/Th2 balance into a more Th1 dominant direction in vivo in mice (16) and humans (14, 38). Concerning the earlier human studies no plant sterols or stanols in gram amounts have been tested, but very low doses of sitosterol have been used. Therefore, it is unexpected, that Bouic and co-workers (14, 15) found similar results with sitosterol supplements in amounts far below the average daily intake, indicating that the results found in studies from this group are merely a sitosterol-glucoside effect. Interestingly, for plant stanols neither in vitro nor in vivo experiments have been reported. This may be due to the fact that absorption of plant stanols is lower as compared with that of plant sterols (39). Consequently serum concentrations of plant stanols are lower than those of plant sterols making physiological effects less likely. Despite these lower concentrations, our results do indicate that at physiological concentrations, sitostanol is as effective as sitosterol. Therefore, also the effects of dietary plant stanol supplementation might be interesting to explore into more detail in the in vivo situation in future experiments. For α-amyrin we do not know whether the concentrations used in our experiments are physiological, because to the best of our knowledge, data reporting serum concentrations or percent absorption of these 4.4-dimethylsterols have never been published. In human intervention studies, increases of serum sitosterol and sitostanol concentrations up to 40 and 500%, respectively, have been reported upon consumption of plant sterol-enriched products, although baseline concentrations differ between studies (19, 40–42). This indicates that the concentrations of sitosterol and sitostanol we have used in our cell experiments can be reached by dietary intake of plant sterol- and stanol-enriched foods. Although representative for in vivo plant sterol or stanol concentrations and comparing effects with an identical cholesterol concentration, our cell studies lack a condition where these plant sterol and stanol concentrations are combined with physiological cholesterol concentrations. Unfortunately, with our method to dissolve sterols, it was not possible to add this high amount of cholesterol to the cell culture. However, in vivo results from Calpe-Berdiel et al. showed that in ApoE−/− mice with high cholesterol, the observed Th1 shift in the plant sterol-fed mice was more profound than in wild-type mice with normal cholesterol concentrations (16). Although caution is needed when extrapolating results from mice studies to the human situation, these results do suggest that even high concentrations of cholesterol might not have an inhibiting effect on the plant sterol- or stanol-dependent Th1 shift.
What is the physiological relevance of these findings? To our opinion, although it needs to be confirmed in well-controlled intervention studies, our results are at least suggestive that it is possible to alter the Th1/Th2 balance into a more Th1 dominant immune response by increasing plant sterol and stanol consumption in humans. This might suggest that these non-nutrients when incorporated into functional foods and consumed by subjects suffering from a disease caused by a Th2 dominant immune response, may have beneficial health effects. In allergy treatment, this concept of using Th1 skewing, either or not via targeting the Treg or Th1 subfractions, as intervention target has been discussed for many years and only recently used successfully in vivo by Frossard and co-workers (43, 44). Possible beneficial effects of plant sterols on the impaired Th1 response in HIV patients, have been shown by Breytenbach et al. (14). Our data, together with these findings, suggest that plant sterol or stanol supplementation might be beneficial in conditions characterized by Th2 overactivation or an impaired Th1 response.
In conclusion, we have shown that administration of plant sterols or stanols to human PBMCs ex vivo alters the Th1/Th2 balance into a more Th1 dominant direction. IFNγ and IL-2 concentrations increase, while slight decreases were observed in IL-4 and IL-10 concentrations. Plant stanols seem to be more potent because they show these effects already at 10-fold lower concentrations. Activation of TLR 2 by plant sterols and stanols seems essential in the observed Th1 shift.
Acknowledgments
We thank Maria Vroomen for technical assistance in the proliferation assays, Dr. Leo Joosten from UMC St. Radbout for the TLR2 knock-out mice, and Miriam Bovens and Marja Driessen for work on the cytokine arrays.
Footnotes
- Th
- T-helper
- IL
- interleukin
- TLR
- Toll-like receptor
- PBMC
- peripheral blood mononuclear cells
- Treg
- regulatory T-cell
- IFN
- interferon
- ELISA
- enzyme-linked immunosorbent assay
- APC
- antigen-presenting cell
- PHA
- phytohemagglutinin
- FITC
- fluorescein isothiocyanate
- PAM
- Pam3Cys-Ser-(Lys)4 hydrochloride
- LPS
- lipopolysaccharide.
REFERENCES
- 1.O'Garra A. (1998) Immunity 8, 275–283 [DOI] [PubMed] [Google Scholar]
- 2.Kidd P. (2003) Altern. Med. Rev. 8, 223–246 [PubMed] [Google Scholar]
- 3.Roitt I., Brostoff J., Male D. (2000) Immunologie, 2 Ed., Bohn Stafleu Van Loghum, Houten [Google Scholar]
- 4.Lesourd B. (2006) Proc. Nutr. Soc. 65, 319–325 [DOI] [PubMed] [Google Scholar]
- 5.Benfield T., Jensen J. S., Nordestgaard B. G. (2007) Diabetologia 50, 549–554 [DOI] [PubMed] [Google Scholar]
- 6.Shearer G. M., Clerici M. (1998) AIDS Res. Human Retroviruses 14, Suppl. 2, S149–S152 [PubMed] [Google Scholar]
- 7.O'Garra A., Vieira P. (2003) Nat. Immunol. 4, 304–306 [DOI] [PubMed] [Google Scholar]
- 8.Albers R., Antoine J. M., Bourdet-Sicard R., Calder P. C., Gleeson M., Lesourd B., Samartín S., Sanderson I. R., Van Loo J., Vas Dias F. W., Watzl B. (2005) Br. J. Nutr. 94, 452–481 [DOI] [PubMed] [Google Scholar]
- 9.Plat J., Mensink R. P. (2005) Curr. Opin. Lipidol. 16, 31–37 [DOI] [PubMed] [Google Scholar]
- 10.Sato M., Iwakabe K., Kimura S., Nishimura T. (1999) Immunol. Lett. 70, 29–35 [DOI] [PubMed] [Google Scholar]
- 11.Zhang P., Smith R., Chapkin R. S., McMurray D. N. (2005) J. Nutr. 135, 1745–1751 [DOI] [PubMed] [Google Scholar]
- 12.Kew S., Mesa M. D., Tricon S., Buckley R., Minihane A. M., Yaqoob P. (2004) Am. J. Clin. Nutr. 79, 674–681 [DOI] [PubMed] [Google Scholar]
- 13.Bouic P. J. (2002) Drug Disc. Today 7, 775–778 [DOI] [PubMed] [Google Scholar]
- 14.Breytenbach U., Clark A., Lamprecht J., Bouic P. (2001) Cell Biol. Int. 25, 43–49 [DOI] [PubMed] [Google Scholar]
- 15.Bouic P. J., Etsebeth S., Liebenberg R. W., Albrecht C. F., Pegel K., Van Jaarsveld P. P. (1996) Int. J. Immunopharmacol. 18, 693–700 [DOI] [PubMed] [Google Scholar]
- 16.Calpe-Berdiel L., Escolà-Gil J. C., Benitez S., Bancells C., González-Sastre F., Palomer X., Blanco-Vaca F. (2007) Life Sciences 80, 1951–1956 [DOI] [PubMed] [Google Scholar]
- 17.Plat J., Mensink R. P. (2001) Nutr. Metab. Cardiovasc. Dis. 11, 31–40 [PubMed] [Google Scholar]
- 18.Moghadasian M. H. (2000) Life Sciences 67, 605–615 [DOI] [PubMed] [Google Scholar]
- 19.Chan Y. M., Varady K. A., Lin Y., Trautwein E., Mensink R. P., Plat J., Jones P. J. (2006) Nutr. Rev. 64, 385–402 [DOI] [PubMed] [Google Scholar]
- 20.Normén A. L., Brants H. A., Voorrips L. E., Andersson H. A., van den Brandt P. A., Goldbohm R. A. (2001) Am. J. Clin. Nutr. 74, 141–148 [DOI] [PubMed] [Google Scholar]
- 21.Okamura H., Tsutsi H., Komatsu T., Yutsudo M., Hakura A., Tanimoto T., Torigoe K., Okura T., Nukada Y., Hattori K., et al. (1995) Nature 378, 88–91 [DOI] [PubMed] [Google Scholar]
- 22.Calpe-Berdiel L., Escolà-Gil J. C., Blanco-Vaca F. (2007) Atherosclerosis 195, 210–211 [DOI] [PubMed] [Google Scholar]
- 23.Joseph S. B., Bradley M. N., Castrillo A., Bruhn K. W., Mak P. A., Pei L., Hogenesch J., O'Connell R. M., Cheng G., Saez E., Miller J. F., Tontonoz P. (2004) Cell 119, 299–309 [DOI] [PubMed] [Google Scholar]
- 24.Plat J., Nichols J. A., Mensink R. P. (2005) J. Lipid Res. 46, 2468–2476 [DOI] [PubMed] [Google Scholar]
- 25.Yang C., Yu L., Li W., Xu F., Cohen J. C., Hobbs H. H. (2004) J. Clin. Investig. 114, 813–822 [DOI] [PMC free article] [PubMed] [Google Scholar]
- 26.Weststrate J. A., Meijer G. W. (1998) Eur. J. Clin. Nutr. 52, 334–343 [DOI] [PubMed] [Google Scholar]
- 27.Sutmuller R. P., Morgan M. E., Netea M. G., Grauer O., Adema G. J. (2006) Trends Immunol. 27, 387–393 [DOI] [PubMed] [Google Scholar]
- 28.Watanabe T., Kitani A., Murray P. J., Strober W. (2004) Nat. Immunol. 5, 800–808 [DOI] [PubMed] [Google Scholar]
- 29.Kawai T., Akira S. (2005) Curr. Opin. Immunol. 17, 338–344 [DOI] [PubMed] [Google Scholar]
- 30.Awad A. B., Toczek J., Fink C. S. (2004) Prostaglandins, Leukotrienes, Essential Fatty Acids 70, 511–520 [DOI] [PubMed] [Google Scholar]
- 31.Mizoguchi E., Mizoguchi A., Preffer F. I., Bhan A. K. (2000) Int. Immunol. 12, 597–605 [DOI] [PubMed] [Google Scholar]
- 32.Lee J. H., Lee J. Y., Park J. H., Jung H. S., Kim J. S., Kang S. S., Kim Y. S., Han Y. (2007) Vaccine 25, 3834–3840 [DOI] [PubMed] [Google Scholar]
- 33.Nashed B., Yeganeh B., HayGlass K. T., Moghadasian M. H. (2005) J. Nutr. 135, 2438–2444 [DOI] [PubMed] [Google Scholar]
- 34.Sutmuller R., Garritsen A., Adema G. J. (2007) Ann. Rheum. Diseases 66, Suppl. 3, 91–95 [DOI] [PMC free article] [PubMed] [Google Scholar]
- 35.Nembrini C., Abel B., Kopf M., Marsland B. J. (2006) J. Immunol. 176, 7180–7188 [DOI] [PubMed] [Google Scholar]
- 36.Sutmuller R. P., den Brok M. H., Kramer M., Bennink E. J., Toonen L. W., Kullberg B. J., Joosten L. A., Akira S., Netea M. G., Adema G. J. (2006) J. Clin. Invest. 116, 485–494 [DOI] [PMC free article] [PubMed] [Google Scholar]
- 37.Desai F., Ramanathan M., Fink C. S., Wilding G. E., Weinstock-Guttman B., Awad A. B. (2009) Int. Immunopharmacol. 9, 153–157 [DOI] [PubMed] [Google Scholar]
- 38.Bouic P. J. (2001) Curr. Opin. Clin. Nutr. Metab. Care 4, 471–475 [DOI] [PubMed] [Google Scholar]
- 39.Ostlund R. E., Jr., McGill J. B., Zeng C. M., Covey D. F., Stearns J., Stenson W. F., Spilburg C. A. (2002) Am. J. Physiol. Endocrinol. Metab. 282, E911–E916 [DOI] [PubMed] [Google Scholar]
- 40.Naumann E., Plat J., Mensink R. P. (2003) J. Nutr. 133, 2741–2747 [DOI] [PubMed] [Google Scholar]
- 41.Tammi A., Rönnemaa T., Valsta L., Seppänen R., Rask-Nissilä L., Miettinen T. A., Gylling H., Viikari J., Anttolainen M., Simell O. (2001) J. Nutr. 131, 1942–1945 [DOI] [PubMed] [Google Scholar]
- 42.Fransen H. P., de Jong N., Wolfs M., Verhagen H., Verschuren W. M., Lütjohann D., von Bergmann K., Plat J., Mensink R. P. (2007) J. Nutr. 137, 1301–1306 [DOI] [PubMed] [Google Scholar]
- 43.Frossard C. P., Steidler L., Eigenmann P. A. (2007) J. Allergy Clin. Immunol. 119, 952–959 [DOI] [PubMed] [Google Scholar]
- 44.Eigenmann P. A., Asigbetse K. E., Frossard C. P. (2008) Clin. Exp. Immunol. 151, 546–553 [DOI] [PMC free article] [PubMed] [Google Scholar]


