Abstract
We have directly observed the trafficking and fusion of ion channel containing vesicles and monitored the release of individual ion channels at the plasma membrane of live mammalian cells using total internal reflection fluorescence microscopy. Proteins were fused in-frame with green or red fluorescent proteins and expressed at low level in HL-1 and HEK293 cells. Dual color imaging revealed that vesicle trafficking involved motorized movement along microtubules followed by stalling, fusion, and subsequent release of individual ion channels at the plasma membrane. We found that KCNQ1-KCNE1 complexes were released in batches of about 5 molecules per vesicle. To elucidate the properties of ion channel complexes at the cell membrane we tracked the movement of individual molecules and compared the diffusive behavior of two types of potassium channel complex (KCNQ1-KCNE1 and Kir6.2-SUR2A) to that of a G-protein coupled receptor, the A1 adenosine receptor. Plots of mean squared displacement against time intervals showed that mobility depended on channel type, cell type, and temperature. Analysis of the mobility of wild type KCNQ1-KCNE1 complexes showed the existence of a significant immobile subpopulation and also a significant number of molecules that demonstrated periodic stalling of diffusive movements. This behavior was enhanced in cells treated with jasplakinolide and was abrogated in a C-terminal truncated form (KCNQ1(R518X)-KCNE1) of the protein. This mutant has been identified in patients with the long QT syndrome. We propose that KCNQ1-KCNE1 complexes interact intermittently with the actin cytoskeleton via the C-terminal region and this interaction may have a functional role.
Keywords: Biophysics/Single molecule, Cytoskeleton, G-proteins/Coupled Receptors (GPCR), Membrane/Proteins, Protein/Cell Surface, Transport/Potassium
Introduction
Ion channels are the major determinants of cell membrane excitability and in particular potassium channels control the resting membrane potential and govern repolarization. At the molecular level potassium channels represent a large and diverse gene family present in prokaryotes and eukaryotes (1). In this study, we focus on two distinct channels of medical importance (KCNQ1-KCNE1 and Kir6.2-SUR2A) and compare them to an archetypal G-protein coupled receptor, the A1 adenosine receptor. KCNQ1 together with KCNE1 account for an important repolarizing cardiac current, IKs, which characteristically has slow activation kinetics (2, 3). IKs is a complex of four pore forming α KCNQ1 subunits, and probably two β KCNE1 proteins (4). Naturally occurring mutations in these genes lead to the long QT syndrome and predispose patients to sudden arrhythmic death (5). Potassium channels sensitive to the metabolic status of the cell (known as KATP) exist in a number of tissues and, for example, in the pancreas are important determinants of insulin release (6). KATP is an octameric protein complex composed of an inwardly rectifying K+ channel subunit (Kir6.1, Kir6.2), and a sulfonylurea receptor subunit, a member of the ATP binding cassette family of proteins (SUR1, SUR2A, SUR2B) (7). The importance of these channels in clinical medicine has been emphasized by genetic defects that lead to dilated cardiomyopathy (8) and disorders of insulin release (9, 10). Here we have studied the molecular counterpart of the cardiac channel (Kir6.2-SUR2A).
To complement the sophisticated single-channel data obtained through patch clamping, it would be revealing to be able to visualize individual ion channels in their native state using optical methods. It is possible to obtain information about protein mobility, membrane structure, protein-membrane and protein-protein interactions by tracking the motion of individual molecules moving at the plasma membrane. Single molecule tracking is a non-invasive method because the observed perturbations arise simply from thermal agitation. Laser-based, total internal reflection fluorescence microscopy (TIRFM)3 and use of highly sensitive camera systems enables identification of single fluorophores in aqueous solution and on the membrane of living cells (11–14).
Thermal forces (proportional to absolute temperature), drive Brownian motion, and cause particles to diffuse. When particles move in an isotropic medium their trajectory is described by a “random walk” whereby the mean squared displacement is directly proportional to the time between measurements. However, if the medium (e.g. a biological cell membrane) is anisotropic the diffusive path may no longer be described by a random walk and this is called anomalous diffusion. The prevailing view is that intrinsic membrane proteins might undergo anomalous diffusion either because of protein crowding effects (analogous to negotiating buildings as one walks along the streets of a city), due to interactions between membrane proteins and the underlying cytoskeleton (like pausing to climb fences as one walks through the countryside) or due to phase separation of different lipid types within the membrane so that rafts are formed that ensnare certain proteins that then move rapidly within the raft but whose long range mobility is governed by the slow movement of the entire raft structure (15, 16).
In the present study, we use an approach that combines the generation of functional chimeric K+ channels fused in-frame with the green fluorescent protein (GFP) and exploit the high signal-to-noise imaging capabilities of TIRFM in mammalian cells. We have been able, for the first time, to follow the fate of ion channels as they are transported within the cytoplasm and delivered to the plasma membrane. We quantified their diffusive properties after release at the cell membrane and compared the behavior of K+ channels and an archetypal G-protein coupled receptor in the plasma membrane. We studied two different cell types, HL-1 cells, one of the better cell culture models for cardiomyocytes (17), and HEK293 cells, a classic heterologous expression system. Our results reveal that wild type KCNQ1-KCNE1 potassium channel complexes show a stop-start, or transient confinement behavior (18) in HL-1 cells, which is obviated in a human mutation underlying the “long-QT syndrome.”
MATERIALS AND METHODS
Molecular Biology
A fusion between GFP and human KCNQ1 and the deletion mutant KCNQ1(R518X) was created using PCR as previously described (19). eGFP was fused to the C terminus of the channel in both cases. The two plasmids (KCNQ1-GFP and KCNE1) were expressed at a 1:1 concentration ratio for transfection. Kir6.2-GFP was a gift from Dr. B. Ribalet (20). SUR2A was expressed in pcDNA3 and was expressed in a 1:2 (Kir6.2-GFP and SUR2A) concentration ratio for transfection. A1-GFP was generated by releasing the A1 fragment from A1-YFP (21) using a KpnI/HindIII digest and cloning into eGFP-N1. Tubulin-mRFP was a gift from Dr. T. Carter.
Cell Culture
HEK293 cells were cultured and transfected with Lipofectamine or Lipofectamine 2000 as previously described (22). The HL-1 cells were a generous gift from Prof. William C. Claycomb and were grown in Claycomb medium supplemented with 10% fetal bovine serum (Sigma), 2 mm l-glutamine, 100 units/ml of penicillin, 100 μg/ml of streptomycin, and 0.1 mm norepinephrine (Sigma). The medium was replaced every day, and cells were grown on T75 flasks pre-coated with gelatin/fibronectin. For TIRF microscopy and confocal imaging, HL-1 cells were seeded at a lower density (1:20) on 25-mm glass coverslips (BDH) or glass-bottom Petri dishes (Mattek). HL-1 cells were transfected using FuGENE HD transfection reagent (Roche Applied Science). Cells were plated 48–72 h before transfection. The transfection complex contained 97 μl of Claycomb medium (no supplement), 5 μl of FuGENE HD, and the DNA. The transfection complex was added to the cell culture and left for 24 h. Experiments were performed 48 h after transfection. Under our standard transfection conditions with cells in 35-mm dishes we used 800–1600 ng of DNA for both cell types. However, in single molecule experiments with TIRFM we titrated this downwards to 25–160 ng in total (25–80 ng of each individual construct for cotransfections but generally 40 ng for each construct) for both cell types. This led to high efficiency transfection but relatively low-level protein expression in individual cells and so made single-particle tracking easier. The plasmid expressing KCNE1 is smaller (∼5 kb) than that expressing KCNQ1-GFP (∼8 kb) thus the molar ratio approached 1:2.
Microscopy
Laser Scanning Confocal Microscopy
Live cells were imaged using a Bio-Rad Radiance 2100 laser scanning confocal system attached to a Nikon TE300 inverted microscope (Bio-Rad). Cells were imaged through a Plan Apo ×60 oil objective with a NA of 1.4 in HEPES-buffered Opti-MEM (containing no phenol red) at room temperature. EGFP was excited using an argon 488-nm laser and emission recorded using a LP500-nm filter.
TIRFM
Cells were grown on circular No. 1 coverslips and placed into sealed imaging chambers for TIRFM experiments. The cell medium was replaced with balanced Hanks' salts solution containing 10% fetal calf serum and 20 mm HEPES (pH 7.4). All chemicals were obtained from Sigma. The microscope (Axiovert-S100, Zeiss, Germany) was equipped with a temperature-controlled incubator (Solent Scientific, UK) that allowed us to conduct experiments at between 23 and 37 °C. The TIRFM imaging system has been described (13). A brief description follows; blue and green laser beams (488 nm, 20 milliwatt, Protera 488, Novalux, Sunnyvale, CA; 532 nm, 50 milliwatt, Suwtech 532–50 with 1500 LDC controller, SP3-Plus Tunbridge Wells, Kent, UK) were expanded using a Galilean beam expander and focused at a small silvered mirror located at the back focal plane of an objective lens (AlphaPlan, ×100, NA 1.45, Zeiss, Jena, Germany). Incident laser beams were adjusted to 64° to create the evanescent field at the glass-water interface. A digital EMCCD camera (iXon897BV, Andor, UK) was used to acquire video sequences that were stored directly on a computer hard drive using a computer frame grabber card and proprietary software. To visualize green and red fluorescent proteins in the same specimen, appropriate laser excitation (488 or 532 nm) and emission filter (ET525/50M for GFP; HQ590/50 M for mRFP; Chroma Technology Corp., Rockingham, VT) was selected.
Patch Clamping
Currents were recorded from transfected cells as previously described in Ref. 19. Steady-state relative activation was measured as previously described and data analyzed using Clampfit and Microcal Origin software (19, 23).
Single Molecule Identification and Tracking
Analysis of video sequences was performed using custom-written image processing software that automatically detects individual objects of the correct size, intensity, and temporal characteristics to identify them uniquely as single fluorophores (24). All tracks used for the analysis had a minimal trajectory length of 20 points. Mean squared displacement (MSD) values were derived from the behavior of many hundreds of individual objects over a range of time intervals (ΔT). The slope of MSD versus ΔT plots gives an estimate of the coefficient of lateral diffusion, Dlat (because MSD = 4DlatΔT), and the shape of the plot indicates the type of diffusive mechanism.
RESULTS
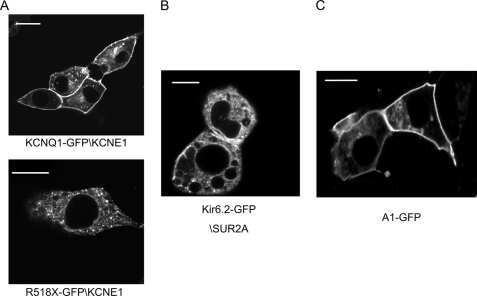
Using confocal microscopy we found that KCNQ1-GFP-KCNE1 and A1-GFP show membrane localization in HL-1 cells (Fig. 1). However, there was significant intracellular fluorescence with a deletion mutant KCNQ1(R518X)-GFP-KCNE1 (see below) as previously described (19) and Kir6.2-GFP-SUR2A despite the generation of membrane currents (Fig. 1). We and others have previously established that the functional behavior of these GFP-fused proteins is comparable with their wild-type counterparts (19, 20, 25).
FIGURE 1.
Imaging with confocal microscopy in live HL-1 cells. A (upper), KCNQ1-GFP-KCNE1 localizes to the plasma membrane and (lower) the mutant KCNQ1(R518X)-GFP-KCNE1 shows diffuse punctate localization and weak localization to the plasma membrane. B, Kir6.2-GFP-SUR2A localizes partially to the cytoplasm. C, A1-GFP localizes to the plasma membrane. Scale bars are 10 μm.
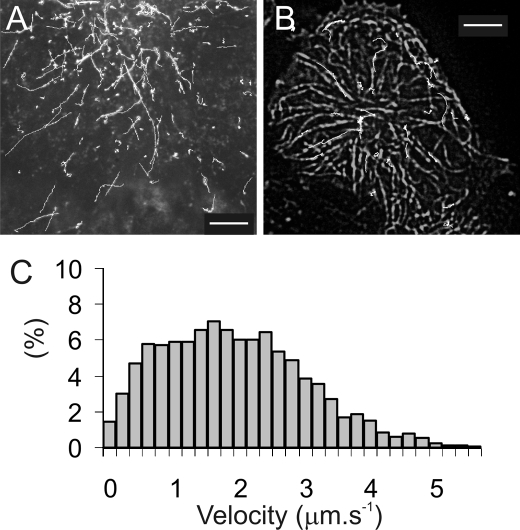
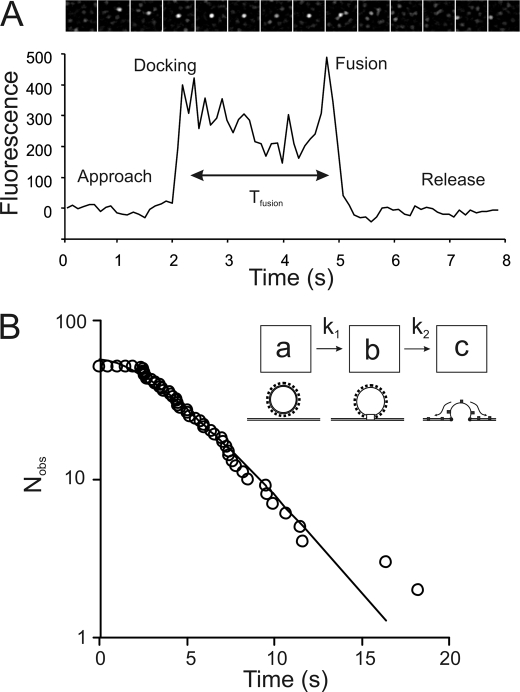
Using TIRFM imaging we observed HL-1 and HEK293 cells 24–48 h after transfection with KCNQ1-GFP-KCNE1 and observed directed movement of bright, punctate objects along straight trajectories (Fig. 2A and supplemental Movie 1) over a distance of ∼10 μm and at an average speed of 1.8 μm s−1 (Fig. 2C). Kir6.2-GFP-SUR2A and A1-GFP were also observed to be transported in similar vesicles (not shown). Dual-color imaging using HEK293 cells were co-transfected with both mRFP-tagged tubulin and KCNQ1-GFP-KCNE1 potassium channels. The trajectories overlapped exactly with the underlying microtubule structures and the trajectory of some particles showed abrupt changes in direction as they switched from one microtubule track to another (Fig. 2B and supplemental Movie 2). We studied the particle movement in greater detail by time-lapse TIRFM imaging (10 frames s−1 with 30-ms exposure/illumination time) of KCNQ1-GFP-KCNE1 expressed in HEK293 cells. On many occasions we observed particles fusing at the cell membrane and it became clear that we were observing the process of vesicle trafficking and fusion at the plasma membrane. Fusion events were characterized by vesicles moving steadily toward the cell membrane, pausing for a brief period (Fig. 3A and supplemental Movie 3) during which time the fluorescence intensity would suddenly increase and then rapidly decrease again as individual molecules rapidly diffused away from the release point.
FIGURE 2.
The delivery of KCNQ1-GFP containing vesicles to the plasma membrane of HEK-293 cells visualized by TIRFM at 37 °C. A, shows trajectories (white lines) of KCNQ1-GFP containing vesicles moving within HL1 cells. The initial frame in the video sequence is shown overlaid and illustrates how the low background imaging provided by TIRM allows individual vesicles to be tracked as they move toward the cell periphery. B, dual color TIRF imaging of HL-1 cells co-transfected with KCNQ1-GFP-KCNE1 and mRFP-tubulin shows that vesicle tracks (white lines) follow closely the path of microtubules shown as the overlaid image. Scale bars are 5 μm. C, a histogram showing the distribution of velocities measured for the vesicles tracked above indicates a mean velocity of 1.8 μm s−1.
FIGURE 3.
A, the characteristic time course of KCNQ1-GFP-KCNE1 vesicle fusion consisting of approach, docking, fusion, and then release of ion channels from an individual vesicle. Fluorescence intensity at the fusion zone (0.5 × 0.5 μm2 region) is plotted against time. The panel of images above shows a film strip of an area (3.5 × 3.5 μm2) around the fusion site. The images are aligned roughly to correspond to the intensity versus time plot below. The graph shows how intensity rises abruptly when the vesicle arrives at the fusion site (“docking” at t = 2 s), declines slightly due to photobleaching and rises again shortly before ion channel release (“fusion” at t = 5 s). TIRFM imaging of HEK-293 cells were recorded at 37 °C. B, to investigate the kinetics of the fusion process, the distribution of “docked” vesicle lifetimes (time, Tfusion, in panel A) were plotted as a cumulative frequency plot (i.e. number of intact vesicles remaining after each time interval) against time. The lifetimes do not fit to a single exponential process but instead fit moderately well to a two-step kinetic process. The kinetic scheme (inset) shows how two sequential processes might be required for the docking and fusion process (schematic). The least squares fitted line is given by the solution to such a two-step sequential scheme. The fitted line here and elsewhere in the paper was obtained by iterative, least squares error minimization based on a generalized reduced gradient method (using the ExcelTM, “Solver” option). The goodness to fit (given by χ2 value) is better than 95% here and for all other fitted lines except where indicated otherwise. The functional form of the fitted line is of a two-step, sequential, biochemical process: At= A0 (e−k1t + ((k1)/(k2 − k1) e−k1t − (k1)/(k2 − k1) e−k2t), where A0 = 57; k1 = 0.33 s−1; k2 = 0.34 s−1.
The entire fusion process took several seconds to complete (Fig. 3A) and led to the production of ∼5 KCNQ1-GFP-KCNE1 visible complexes (average of 58 fusion events, minimum = 3 maximum = 8) at the cell membrane. The number of individual GFP-tagged molecules that were counted moving away from the fusion site was directly proportional to the integrated intensity of the vesicle immediately prior to the release event. The fusion process took a number of seconds to complete (Fig. 3, A and B) and the simplest kinetic scheme to explain the distribution of vesicle lifetimes, Tfusion, prior to ion channel release, consists of a two-step process (schematic inset in Fig. 3B). The model implies that vesicles require about 3 s to become fusion competent or fully docked (Fig. 3B, inset process “a → b”) and then a further ∼3 s before the ion channels are released (Fig. 3B, process “b → c”). The fluorescence intensity of the vesicles identified in Figs. 1–3 were 5–20-fold brighter than individual channel complexes (see below) and their intensity decayed in a relatively smooth, exponential, fashion as expected for an object consisting of multiple (e.g. >10) fluorophores.
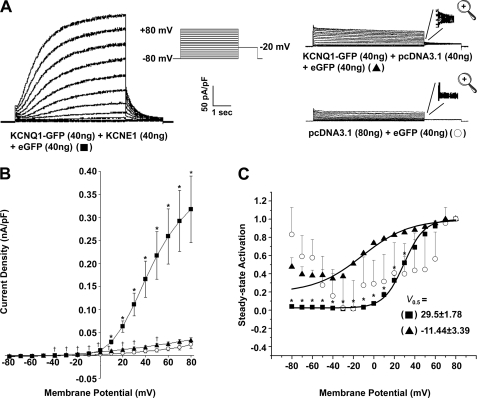
To study the diffusion of individual molecular complexes at the plasma membrane we used cells (HL-1 and HEK293) that expressed GFP-tagged proteins at low levels. Our expression levels yielded less than 0.2 molecules/μm2 of basal cell membrane, which is below that used for our confocal imaging work (above and see “Materials and Methods”). We first patch clamped these cells to check for channel expression by measuring the characteristic currents encoded by these potassium channel cDNAs. The expression of KCNQ1-GFP alone led to a small increase in outward K+ currents and the presence of a small tail current. Co-expression of KCNQ1-GFP with KCNE1 led to a substantial increase in outward currents that showed characteristically slowed activation kinetics and a rightward shift in the steady-state activation curve (Fig. 4). The fluorescence of KCNQ1-GFP was too faint to be detected with our standard epifluorescence setup on the patch clamping microscope so we co-transfected 40 ng of cDNA encoding eGFP to enable identification of transfected cells.
FIGURE 4.
Patch clamp characterization of low-level expression of KCNQ1-GFP and KCNE1 in HEK293 cells. A, representative traces of currents produced by HEK293 cells that are transfected with KCNQ1-GFP (40 ng) and KCNE1 (40 ng), KCNQ1-GFP (40 ng) and pcDNA3.1 (40 ng), or pcDNA3.1 alone (80 ng). To identify transfected cells eGFP (40 ng) was co-transfected and the transfected cells identified by epifluorescence. The currents displayed are normalized to cell capacitance. The voltage protocol used is shown in the inset. B, maximal current density normalized to cell capacitance (nA/pF). * indicates a significant difference (p < 0.05) between the current density values for KCNQ1-GFP (40 ng) + KCNE1 (40 ng) + eGFP (40 ng) compared with those for KCNQ1-GFP (40 ng) + pcDNA3.1 (40 ng) + eGFP (40 ng). † indicates a significant difference (p < 0.05) between the current density values for KCNQ1-GFP (40 ng) + pcDNA3.1 (40 ng) + eGFP (40 ng) compared with those for pcDNA3.1 (80 ng) + eGFP (40 ng). C, normalized voltage-dependent activation curves of KCNQ1-GFP (40 ng) expressed with or without KCNE1 (40 ng). The activation curves are fitted with Boltzmann functions (y = [1 + exp(V0.5 − V)/(slope factor)]−1, solid lines) using non-linear regression. For KCNQ1-GFP (40 ng) + KCNE1 (40 ng), V0.5 = 29.5 ± 1.8 mV and slope factor = 9.86 ± 0.93 mV. For KCNQ1-GFP (40 ng) alone, V0.5 = −11.44 ± 3.39 mV and slope factor = 23.0 ± 2.28 mV. The residual steady-state activation with KCNQ1-GFP hyperpolarized potentials reflects endogenous current expression. Despite this the relationship is obviously rightward shifted with coexpression of KCNE1. Data are presented as mean ± S.E. (n = 5). The V0.5 values shown in C are significantly different (p < 0.05) from each other. * indicates a significant difference (p < 0.05) between the steady-state activation values for KCNQ1-GFP (40 ng) + KCNE1 (40 ng) + eGFP (40 ng) compared with those for KCNQ1-GFP (40 ng) + pcDNA3.1 (40 ng) + eGFP (40 ng).
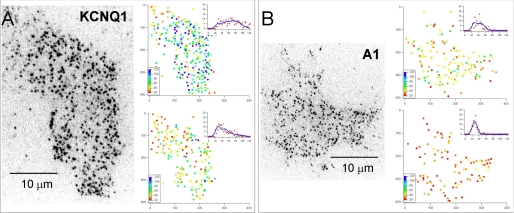
Given the results in Fig. 4 that suggest even under these transfection conditions there are significant numbers of fully assembled and functional KCNQ1-GFP-KCNE1 complexes present in the membrane we undertook further TIRFM imaging studies. Under low expression conditions we were able to visualize individual molecules as separate spots of light and could track them as they diffused at the basal plasma membrane (left-hand panels of Fig. 5, A and B, and supplemental Movies 4–6). We confirmed that they were single molecular complexes using the so-called “DISH” criteria requiring that objects be diffraction limited size, have an appropriate intensity (compared with control samples consisting of immobilized single GFP molecules), show stepwise photobleaching and have a half-life proportional to excitation power (14). To generate large data sets, we collected video images from a region of the cell for about 8 s and then turned off the laser illumination for 3 min to allow new, fluorescently tagged, molecules to diffuse from the unilluminated part of the cell into the observation region. This protocol was repeated about 6 times to gather 500–2000 identified objects for each cell studied. An automatic single particle tracking algorithm was used to detect and track the trajectories (i.e. the x-y coordinates and intensity over time) of individual fluorophores with subpixel resolution (24). The mean intensity of every spot, which was tracked for >10 frames, was plotted as a single dot, color-coded to represent the mean pixel intensity over a 5 × 5 pixel area about the x-y centroid coordinate (right-hand panels of Fig. 5, A and B, and supplemental Movies 7–10).
FIGURE 5.
Individual molecular complexes were visualized using TIRF microscopy. A and B, left-hand panels show single video frames captured at the start of experiments in which KCNQ1-GFP and A1-GFP adenosine receptors were imaged using TIRFM. The images are displayed using an inverted grayscale lookup table so that individual fluorescent spots appear black on a white background. The two panels on the right of each figure show individual spots as a color-coded dot plot that represents the mean pixel intensity, integrated over a 5 × 5 pixel region. A histogram of the spot intensities and a least-squares fit to the sum of four Gaussian curves (see Fig. 6 for description) is show as an inset graph. The upper panels are data obtained at the start of the recording period and the lower panels are data collected toward the end of the recording (about 3 s later). The entire video sequence, the corresponding dot-plot representations, and intensity histograms are shown animated in supplemental Movies 7–10.
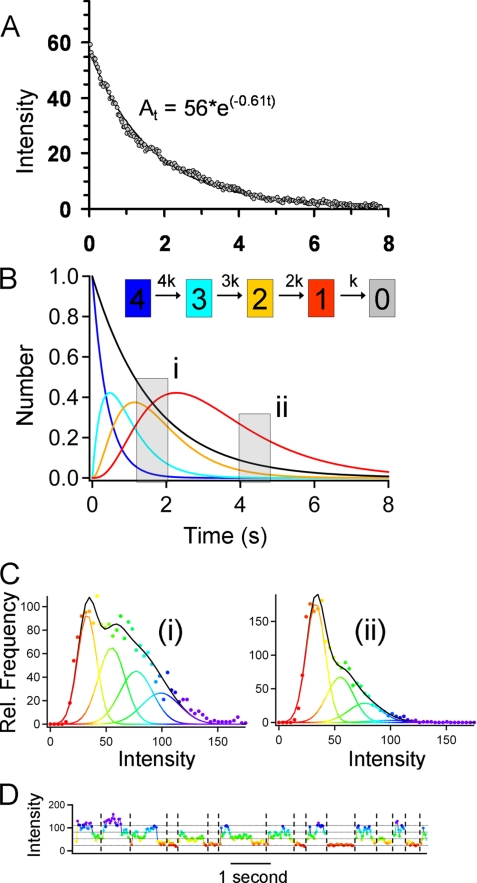
Because the KCNQ1 channel is a homotetrameric complex (26) there should be four GFPs per channel, whereas the A1 adenosine receptor probably exists either as a monomer or dimer (25, 27). So, we expect photobleaching of the individual complexes to exhibit several stepwise drops in intensity as they bleach (28). However, because the channels and receptors diffuse rapidly at the plasma membrane it is not easy to follow their intensity over time and observe multiple photobleaching events and thereby simply count the number of GFP fluorophores (28). To monitor the intensity of an individual complex it must be tracked from one frame to the next as it diffuses at the plasma membrane. This requires video acquisition at 30 frames/s and high laser excitation power so that the fluorescent spots can be identified above the background noise in each video frame. Consequently, the photobleaching rate is high (0.6 s−1) and also the GFP fluorophores tend to blink on and off (29). This means that the expected two- or four-step sequential photobleaching is rarely observed. However, we can show that both A1 receptors and KCNQ1 channels exhibit the expected multilevel fluorescence, characteristic of fully formed molecular complexes, by monitoring the distribution of intensity levels for the population of spots as a function of time. The intensity distribution for KCNQ1 channels and A1 receptors at the start and end of a record are shown in Fig. 5, A and B (right-hand panels) (and as animated histograms in supplemental Movies 8 and 10). The intensity of a cluster of GFP fluorophores will be proportional to the number of fluorophores, whereas the noise is proportional to the square root of the average intensity. So, the distribution of intensities for a population of complexes can be modeled as the sum of Gaussian terms. Because we can measure the photobleaching rate (Fig. 6A) and the intensity and noise level for an individual GFP monomer we can model the system over time in terms of a sequential reaction pathway (e.g. 4 → 3 → 2 → 1 → 0 fluorophores) with a single amplitude scaling parameter (Fig. 6B). The simple model presented here ignores blinking (which can be modeled by including reversible steps in the pathway) because we found that the change in intensity distribution with time is similar for more complex pathways (data not shown). The intensity distribution measured for a population of spots toward the start and end of a single recording (Fig. 6C, labeled i and ii, respectively) is consistent with there being 4 GFP fluorophores per complex (also see supplemental Movies 7 and 8). The intensity histograms for A1 receptors are consistent with a mixture of dimers and monomers (Fig. 5B, right-hand panel, and supplemental Movies 9 and 10). The intensity trajectories measured for individual spots plotted as a function of time (Fig. 6D) show complicated patterns of behavior. Some spots show obvious, single or multiple, stepwise bleaching but most do not. A frequent observation is where a spot suddenly becomes darker and then brighter again (Fig. 6D). This could result from a combination of GFP blinking (29) or spots diffusing close to one another causing an apparent transient rise and fall in their intensity trajectories.
FIGURE 6.
Analysis of the spot intensities reveals that KCNQ1-GFP-KCNE1 exists as a homotetramer. A, the bulk photobleaching rate was determined experimentally by measuring the summed intensity over the entire cell area over time. The photobleaching rate shown here (0.6 s−1) is typical for all our experiments. B, sequential photobleaching of a tetrameric molecule with four GFP tags can be modeled as an irreversible, 4-step process; this is shown in the kinetic scheme. The evolution of differently labeled species (4 →3 → 2 → 1 → 0) over time was modeled by the numerical solution of the differential equations (using a Runge-Kutta approximation in IgorProTM, Wavemetrics, Lake Oswego, OR). The intensity of an individual GFP fluorophore was determined from immobilized monomeric GFP in control specimens (5 × 5 pixel area gave an average of 20 counts/pixel/image frame). The intensity distribution measured for a population of individual spots over time can be modeled as the sum of four Gaussian terms, corresponding to complexes with 4, 3, 2, and 1 labels. C, the experimentally observed distributions measured over the time periods shown in gray (labeled i and ii) are plotted for an experiment with KCNQ1. D, when the intensity of individual spots is plotted against time we find that there is a complicated pattern of behaviors. Some spots show multistep sequential photobleaching. On the chosen color scale they change from blue to green to yellow to red and then disappear. However, many spots show sudden drops and rises in intensity consistent with GFP blinking or because spots merge and then move apart again on the video images. See supplemental Movies 7–10. By definition, at the end of each track the intensity falls to zero (the background level). The plotted line is color-coded identically to Fig. 5 so as to emphasize transitions between different intensity levels and shows that the chosen color lookup table corresponds closely to the discrete intensity levels.
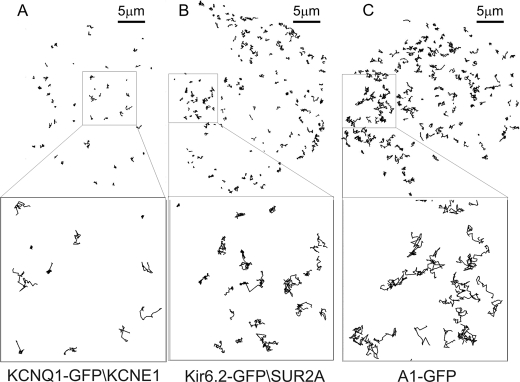
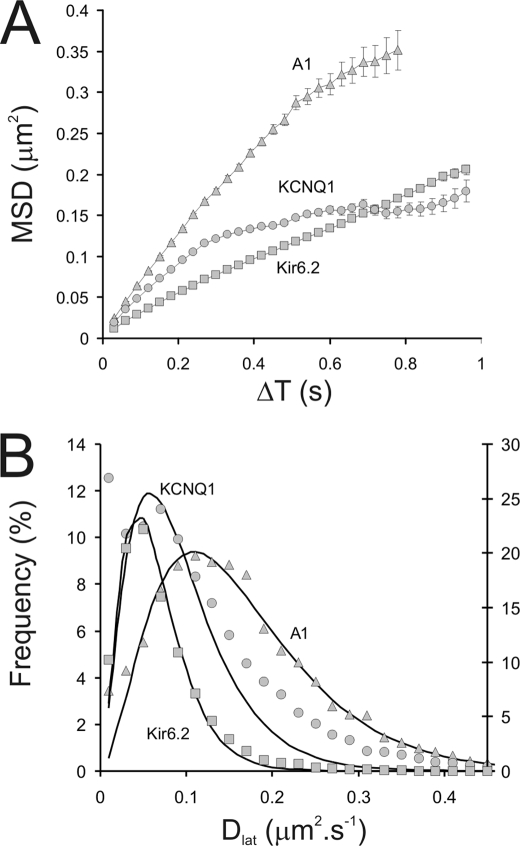
The lateral mobility of an individual fluorescent particle was measured by tracking its position over time (Fig. 7). If the particle motion follows a random walk then a plot of MSD against time interval (ΔT) (15) will be linear with a gradient proportional to the lateral diffusion coefficient, Dlat (Fig. 8A). Deviations from linearity imply that particle mobility is anomalous and mobility is either length or time scale dependent. Because the movement of each particle gives an independent estimate, Dlat values can be histogrammed to show how they are distributed (Fig. 8 B) or averaged to give a mean estimate for Dlat (Table 1). The shape of the distribution can confirm if the population behaves in a homogenous fashion or if some particles behave in an aberrant way. We find that for particles tracked over a limited period of time the histogram of estimated Dlat values exhibits a smooth, γ distribution. However, if there is a fast or slow moving subpopulation then the distribution deviates significantly from a simple γ function (15). This behavior is evident when we compare data obtained for both A1 and Kir 6.2 with that of KCNQ1 (Fig. 8B).
FIGURE 7.
Imaging of single ion channels using TIRFM in live HL1 cells at 37 °C (see supplemental movies) allows individual molecular trajectories to be followed in space and time. Custom image analysis software analyses the tracks of individual, diffraction limited spots corresponding to the location of each molecule. The diagrams show tracks determined for different proteins over a 15-s interval. A, trajectories of individual KCNQ1-GFP-KCNE1 ion channels is shown with the inset below showing a zoomed area. B, Kir6.2-GFP-SUR2A, lower inset shows the zoomed area. C, A1-GFP, lower inset shows the zoomed area.
FIGURE 8.
Graphs describing the diffusive motion of KCNQ1-GFP-KCNE1, Kir6.2-GFP-SUR2A, and A1-GFP at the plasma membrane of HL-1 cells measured at 37 °C using TIRFM. A, plots of the averaged MSD versus ΔT are shown for KCNQ1-GFP-KCNE1 (○) and Kir6.2-GFP-SUR2A (□) and A1 receptors (Δ). Note the deviation from linearity found for KCNQ1 at time intervals above 0.2 s. B, distribution of estimates of Dlat for the population of molecules studied shown as a histogram (symbols as for panel A). The solid lines are least-squares fits to a γ probability density function. Where y =(1)/(baÃ(a))xa−1 · e(−x)/(b), in which b determines scale and a shape (note: Γ(a) is the γ function of a). Note that the function fits the data for A1-GFP and Kir6.2-GFP (χ2 ≫ 95%) but is a very poor fit to the data obtained for KCNQ1-GFP (χ2 ∼ 0%) (the data are summarized in Table 1). The right y axis refers to the Dlat distribution for Kir6.2-GFP-SUR2A.
TABLE 1.
Average lateral diffusion coefficients (±S.E.) of integral membrane proteins in HL1 and HEK293 cells measured at 37 °C, sample sizes (number of objects and number of cells) is shown
A more detailed version of this is given in supplemental Table S1.
| Protein |
KCNQ1-KCNE1 |
KCNQ1(R518X)-KCNE1, HL1 | Kir6.2-SUR2A, HL1 | A1 |
||
|---|---|---|---|---|---|---|
| Cell type | HL1 | HEK | HL1 | HEK | ||
| Dlat (μm2 s−1) | 0.11 ± 0.008 | 0.19 ± 0.01 | 0.14 ± 0.04 | 0.07 ± 0.004 | 0.16 ± 0.01 | 0.41 ± 0.016 |
| n (n-cell) | 16,081 (11) | 11,436 (10) | 6,174 (4) | 15,906 (13) | 5,542 (6) | 6,222 (8) |
The average lateral diffusion coefficient of KCNQ1-GFP-KCNE1 in HL-1 cardiomyocytes was significantly greater than that of Kir6.2-GFP-SUR2A (using a Student's t test statistic, where n = number of cells, p < 1% see supplemental Table S2) but less than that of the A1 adenosine receptor (p < 1%, see supplemental Table S2 and Fig. 8). We found that mobility of the membrane proteins was cell context dependent in that the lateral diffusion coefficients for KCNQ1-GFP-KCNE1 and A1 adenosine receptors were significantly higher in HEK293 cells compared with HL-1 cells (p < 1%, see supplemental Table 3). For the rest of this study we focused our attention on HL-1 cells. We found that Kir6.2-GFP-SUR2A and A1-GFP showed a linear MSD versus ΔT relationship, characteristic of an unrestricted random walk, expected for freely diffusing molecules (Fig. 8A). However, the MSD versus ΔT plot for KCNQ1-GFP-KCNE1 indicated reduced mobility at large distances and longer time intervals (Fig. 8A). We found that a histogram of the individual estimates of Dlat for KCNQ1-GFP-KCNE1 molecules showed a population of molecules with very restricted mobility (13% of molecules had Dlat < 0.02 μm2 s−1) (Fig. 8B). In contrast to the other two proteins examined, the shape of the distribution did not fit well to a simple γ function as expected for freely diffusing molecules. When we excluded the slow-moving or essentially immobile subpopulation of molecules from the KCNQ1-GFP-KCNE1 data set we found that the MSD versus ΔT plot became linear and the apparent restriction at longer time intervals disappeared, indicating that the curvature in the plot is due to this subpopulation of molecules that dominate the data set at longer, ΔT, time intervals. We investigated the temperature dependence of channel movements at the cell membrane by lowering the incubator system temperature from 37 to 23 °C. Mobility of Kir6.2-GFP-SUR2A decreased more than 2-fold but the distribution of Dlat values remained unimodal (supplemental Fig. S2).
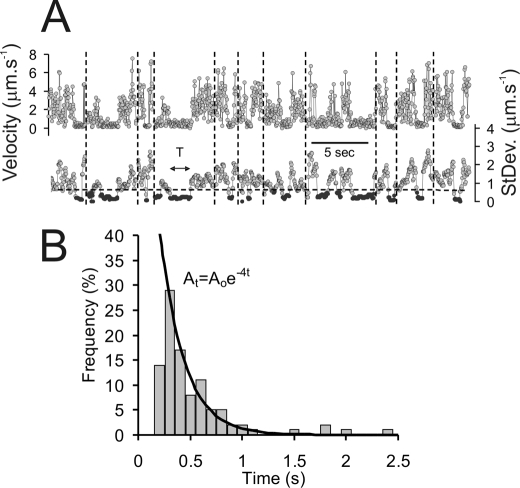
When we examined the individual molecular trajectories for KCNQ1-GFP-KCNE1 we noted that some molecules underwent periodic “stop-start” diffusive motions, in which periods of rapid diffusion were interspersed with intervals of highly restricted motion. Such behavior was not seen in Kir6.2-GFP-SUR2A or in the A1-GFP records. The intermittent stop-start motions were identified both in HL-1 and HEK293 cells (Fig. 9A) with about 0.5% of all detected molecules showing this behavior. Lifetimes of the immobile intervals were stochastic and the distribution of event lifetimes fitted well to a single exponential process (termination rate constant of ∼4 s−1) (Fig. 9B) consistent with a single kinetic process (e.g. an unbinding event).
FIGURE 9.
Analysis of the diffusion of KCNQ1 channels (in HEK293 cells, 37 °C) indicates a transient, stop-start, behavior. A, velocity and variance of molecular displacements are plotted against time for 11 molecules concatenated into a single data series. The vertical dotted lines indicate where data for each molecule starts and ends. The horizontal dotted line indicates the variance threshold used to discriminate periods of paused movement. B, histogram showing the distribution of the lifetimes of paused intervals. The solid black line is a least-squares fit to a single exponential, At = Aoe−rt, where r = 4 s−1.
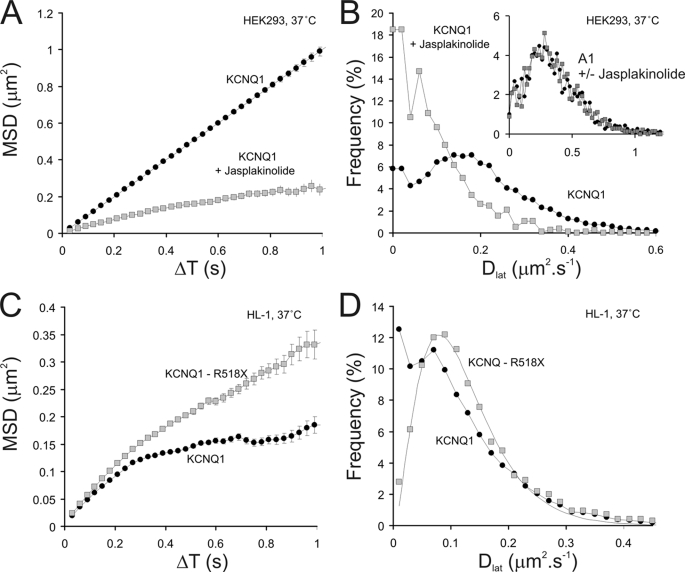
To explore this observation further and specifically test if KCNQ1 was binding to the actin cytoskeleton we used the actin-polymerizing drug jasplakinolide (3 μm) to increase the density of the cortical actin meshwork (30). In these experiments we used HEK293 cells as they had a smaller immobile fraction of KCNQ1-GFP-KCNE1 under control conditions. Recordings were made from the same cell immediately before and after 40 min of jasplakinolide treatment at 37 °C (3 experiments). We found that Dlat fell from 0.19 to 0.09 μm2 s−1 and the immobile fraction (Dlat < 0.02 μm2 s−1) increased dramatically from 6 to 19% (Fig. 10, A and B). This effect was specific for KCNQ1-GFP-KCNE1 as when we performed analogous experiments with A1-GFP mobility was unaltered (Fig. 10B, inset).
FIGURE 10.
The effect of jasplakinolide treatment on the mobility of KCNQ1-GFP-KCNE1 ion channels and the effect of artificially truncating the molecule (mutant R518X) to remove its C-terminal protein kinase A anchoring protein domain. A, plot of MSD versus ΔT for KCNQ1-GFP-KCNE1 (○) in HEK293 cells is fairly linear over the full range of the plot. Following treatment with 3 μm jasplakinolide (□) for 40 min mobility is reduced and restricted (or anomalous) diffusion occurs at times greater than 0.4 s. B, histograms showing the distributions of Dlat for the above data (panel A) reveals that the anomalous behavior seen after jasplakinolide treatment is due to a significant population of slow moving molecules (peak near to zero Dlat). The lines between data points simply connect them to aid visualization. An analogous experiment performed with A1-GFP shows that the addition of 3 μm jasplakinolide (filled squares show after treatment) for 40 min did not affect mobility (inset). The x and y axis labels for the inset are the same as for the main figure. C, mobility of wild type KCNQ1-GFP (○) was compared with that of a C-terminal truncated mutant (R518X) (□) (HL1 cells, 37 °C), the mutant was more mobile and the plot more linear than the parent, wild type molecule. The lines between data points simply connect them to aid visualization. The control KCNQ1-GFP-KCNE1 data are the same as that shown in Fig. 6. D, histograms showing the distribution of Dlat show that the mutant (KCNQ-R518X) data fits well to a simple γ function (see Fig. 5B, legend), whereas the wild type data does not fit to the function (the lines drawn simply connect the data points to aid visualization) and reveals a significant (13% of the data) slow-moving or immobile subpopulation (total trajectories analyzed; 12,198). The control KCNQ1-GFP-KCNE1 data are the same as that shown in Fig. 6.
The intracellular C terminus of KCNQ1 contains an important coiled-coil protein interaction motif responsible for channel assembly and governs interaction with the protein kinase A anchoring protein (AKAP) “yotiao” (31–33). To investigate whether this region is important in restricting the diffusion of the channels we studied a truncated mutant of KCNQ1 called R518X (KCNQ1(R518X)-GFP-KCNE1) in HL-1 cells. The mutation underlies some cases of the Jervell-Lange-Nielsen variant of the long QT syndrome (19, 23). We found that the R518X channel complex showed an average Dlat similar to the full-length parent molecule (KCNQ1-GFP-KCNE1), however, the immobile fraction was virtually absent (Fig. 10D) and the distribution of Dlat was well described by a simple γ function (compare with Fig 10B). Also, the MSD-ΔT plot for R518X was more linear, again suggesting free diffusion without any anomalous behavior (Fig. 10C). Together our findings with jasplakinolide treatment and the properties of the truncated mutant R518X imply that the coiled-coil domain in KCNQ1 is involved in arresting diffusion by interacting directly or indirectly with the underlying actin cytoskeleton.
DISCUSSION
We have been able to observe in detail the fusion of ion channel containing vesicles and subsequent release of individual channel complexes at the plasma membrane. Fusion events were seen as a distinctive process involving motorized movement of channel-containing vesicles within the cytoplasm toward a site of fusion at the plasma membrane. The distance (>10 μm), speed (∼2 μm/s), and linearity of the vesicle trajectories argue strongly that transport is occurring on microtubules, which was confirmed by direct observation of vesicle movements in cells containing fluorescently labeled microtubules. Kir6.2-GFP-SUR2A and A1-GFP were also observed to be transported in similar vesicles suggesting that such behavior was not specific for KCNQ1-GFP-KCNE1. The directionality (toward the cell periphery) implies it would be due to a plus-end directed motor, probably of the kinesin family. A direct interaction of the N terminus of KCNQ1 with β-tubulin has been observed but the authors concluded that this interaction was important for channel regulation by protein kinase A and not transit of channel containing vesicles (34).
Prior to fusion, vesicle movement suddenly ceased and there was a pause of ∼3 s after which fluorescence intensity transiently increased and then rapidly decreased to background levels as individual fluorescent objects diffused away from the fusion site. On average, 5 objects diffused away from the fusion site and their summed fluorescence intensity was equal to that of the vesicle measured immediately prior to release. The average intensity of the released objects corresponded to that of individual fluorophores measured in control experiments. So, the conclusion is that each vesicle carries at least 5 ion channels and all are released in a single fusion event. Earlier studies showed that the summed intensity of dye released from secretory granules was greater than the intensity of the granule immediately prior to fusion (35). Because the secretory granules are spherical the excited volume is distributed across the decaying evanescent field and they are therefore exposed to lower average energy than the dye on the plasma membrane. The improved time resolution of the current study (100 versus 500 ms) has allowed us to measure the intensity of a fusion vesicle after it collapsed and fused with the membrane. This process gives rise to a transient fluorescence rise immediately prior to objects diffusing from the fusion point. Because some GFP molecules are photobleached (photobleaching rate was about 0.3 s−1 in these experiments) during the docking process, we estimate the total number of channels released is about twice the number of observed fluorescent spots.
The distribution of waiting times between arrested vesicle motion and fusion is not well described by a single exponential process. There were no events occurring with less than a 2.5-s pause. The probability of missing short-lived events (<2.5 s) is low because the time resolution of the imaging system is 100 ms (×25 faster). The observed kinetics can be explained by a two-step process. After a vesicle arrives at the fusion site, a process lasting about 3 s occurs before the vesicle becomes competent to fuse with the plasma membrane. The model implies that the fusion-competent vesicle structure has an average lifetime of a further 3 s before it releases the channels into the plasma membrane. Generally, ion channels are assumed to be delivered to the plasma membrane via bulk constitutive transport in the secretory pathway even in cells with prominent regulated exocytosis (26, 36). It is also becoming apparent that surface delivery of ion channels is regulated by cell signaling pathways (37). O'Connell and co-workers (38, 39) observed delivery of Kv2.1 potassium channels containing vesicles to the plasma cell membrane of HEK293 and cultured hippocampal neurons at 37 °C. The actual delivery of GFP-Kv2.1 channels to the plasma membrane took place in 10–15 s, which is 50 times slower the fusion rate of KCNQ1 containing vesicles reported here. At the same time the degree of vesicle mobility (0.3–1 μm s−1) was similar to our observations of 1.8 μm s−1 for KCNQ1 containing vesicles. Zhao et al. (40) studied constitutive exocytosis of vesicles containing a truncated version of the Kir6.2-eGFP potassium channel in HEK293 cells. They did not observe any delays between vesicle docking and channel release but found a significant increase in vesicle fluorescence at the beginning of the fusion event. They attribute this phenomenon to a change in GFP fluorescence as it moves from the relatively acidic intravesicular environment to the neutral pH of the external medium during fusion pore opening. In our case, the GFP was fused to the intracellular domain of the KCNQ1 molecule, which is located on the cytoplasmic face of the vesicular membrane and therefore is not affected by intravesicle pH changes during the fusion event.
By tracking the movement of single fluorophores using TIRF microscopy we have found that the diffusion of A1-GFP adenosine receptor, Kir6.2, KCNQ1(R518X) mutant, and the majority of wild type KCNQ1, channels at the plasma membrane was well described by a simple Brownian walk. This is consistent with the work of Nechyporuk-Zloy et al. (41) showing that a calcium-activated potassium channel, KCa3.1, exhibited linear MSD versus ΔT plots and the average Dlat that they determined was close to values for Kir6.2 and KCNQ1 reported here.
We found that the cell context has a strong influence on lateral diffusion coefficient: HEK293 cells, a commonly used, immortalized cell line for the heterologous expression of proteins display relatively rapid diffusion of proteins, whereas HL-1 cells, derived from mouse atrial cardiac myocytes that closely resemble acutely isolated adult cardiomyocytes (17), show slower rates of diffusion. This result is not surprising given the differing membrane environment, particularly lipid composition and potential differences in the cytoskeleton below the membrane. Within a particular cell type for the three proteins examined there is a substantial difference in mobility. In HL-1 cells where we have examined all three proteins these differences scale with the differing number of transmembrane domains in the complexes and their molecular mass. Kir6.2-GFP-SUR2A is an octamer with a total of 76 transmembrane chains and a molecular mass of ∼992 kDa (7). This large protein complex has the slowest diffusion. The KCNQ1-GFP-KCNE1 K+ channel is a tetramer of the pore forming subunit and a probable dimer of the modulatory KCNE1 subunit (4). This complex has 26 transmembrane chains and a molecular mass of ∼438 kDa and intermediate mobility in the plasma membrane. Traditionally, G-protein coupled receptors have been thought of as monomeric proteins, however, recently there has been a revision of this view with evidence for dimers and even higher order oligomers (42). Assuming a dimeric arrangement this gives a total of 14 transmembrane chains and a molecular mass of 128 kDa. It is the fastest moving of the intrinsic membrane proteins we have studied and our measurements are in approximate agreement with those determined from fluorescence correlation spectroscopy (43). In K+ channels, ATP binding cassette transporters, and G-protein coupled receptors the transmembrane amino acid chains are predominantly arranged as α helices that probably pack into roughly cylindrical shapes and each individual transmembrane helix is likely to have the same mass resident in the membrane (44–46). We expect the radius (R) of the packed cylinder to scale with the square root of the number helices. Modeling membrane proteins as cylindrical objects moving in a continuous viscous medium Saffmann and Delbruck (47) predicted that the diffusion coefficient would only depend weakly on the protein radius (specifically D ∝ ln (1/R)). In contrast, a recent experimental study showed that in practice the diffusion coefficient was more critically dependent on the molecular size (D ∝ 1/R) (48) and our data (Table 1) support this finding. A third physicochemical variable we examined is the influence of temperature on the diffusion coefficient. Our Q10 values are ∼1.5–2.0, which is consistent with there being a radical change in membrane viscosity at temperatures below physiological. One expects the rate of lateral diffusion to be directly proportional to absolute temperature, whereas we see a >2-fold change in diffusion coefficient for a 10 °C change in temperature (see supplemental Fig. S2).
The most striking aspect of the present study is the anomalous diffusive behavior of the wild type KCNQ1-KCNE1 complex. O'Connell et al. and others (39) also found that a population of Kv2.1 potassium channels showed anomalous diffusion, which they attributed to channels becoming trapped within heterogeneous lipid microdomains. In our study, we found that a significant population of wild type KCNQ1-KCNE1 molecules were either immobile throughout the experimental observation period or exhibited “stops,” with a half-life of 0.25 s. We found that a truncated form of KCNQ1, R518X, lacking the C-terminal region of the molecule, showed many fewer incidences of stop-start diffusive behavior and the totally arrested population of molecules (found with the wild type protein) was absent. We know that some of the mutations that cause autosomal recessive long QT syndrome delete or alter part of the C-terminal region. The relationship between the phenomena we have observed with R518X in this study and the pathogenesis of the long QT syndrome is not clear. We have previously shown that the R518X mutant is largely retained intracellularly and that there are no membrane currents when this mutant is expressed in a heterologous expression system (19, 23). It is likely, however, that the intracellular retention is not absolute: the single molecule detection capabilities of TIRFM shows there is some leakage of these mutant channels to the plasma membrane. More tentatively it is plausible that the interaction of the wild type channel with the actin cytoskeleton as evidenced by the immobile fraction may stabilize it at the plasma membrane. We were unable to determine whether the channels were monomers from the pattern of photobleaching as we did not detect multiple step photobleaching for either mutant or wild type KCNQ1-GFP-KCNE1. However, there is indirect evidence that KCNQ1(R518X) can form multimers albeit less efficiently than wild type molecules (23). Patch clamping the cells expressing low cDNA concentrations of KCNQ1-GFP and KCNE1 revealed significant membrane currents with slow activation kinetics characteristic of IKs. This suggests that a significant proportion of the molecules we observe are probably fully formed complexes. Ulbrich and Isacoff (28) recently used stepwise photobleaching to determine stoichiometry of channel protein complexes. However, we observed multistep photobleaching only rarely even when we looked specifically at very early times after the start of laser exposure. In addition, we did not see endogenous expression of KCNQ1 in HL-1 or HEK293 cells (supplemental Fig. S3). However, we found that the distribution of spot intensities was consistent with KCNQ1 complexes being functional tetramers and A1 adenosine receptors being a mixture of monomers and dimers. The intensity of individual particles showed complicated changes in intensity because of a combination of factors: when objects diffuse close to one another their apparent intensity transiently rises and falls as images merge; if a particle is lost by the tracking algorithm intensity will seemingly fall immediately to background levels. GFP blinking means that the intensity recorded from a cluster of fluorophores will fall and rise as a fluorophore blinks off and on. Our analysis shows that the distribution of intensities can be approximated to the sum of Gaussian terms that are multiples of that recorded from a single fluorophore (with standard deviation proportional to square root of intensity level). The spot intensity distributions measured over time is well described by sequential loss of GFP fluorophores from a multisubunit complex as they photobleach. However, the intensity changes measured for any individual complex is often more complicated than expected and reported for other systems (28).
Part of the C-terminal domain of KCNQ has recently been crystallized and shown to form a coiled-coil structure known to be a protein-protein interaction module (33). This domain is responsible for channel assembly into tetramers (23, 31) and interaction with yotiao, a protein kinase A anchoring protein critical for the sympathetically mediated activation of the current (32). Our data are consistent with the idea that this domain undergoes intermittent association with the actin cytoskeleton: Jasplakinolide, an actin polymerizing agent, increased the immobile pool of KCNQ1 molecules, whereas the mutant R518X decreased the immobile pool. Our observation that wild type KCNQ1 molecules exhibit intermittent pauses during their diffusive motion might reflect transient association with the cortical cytoskeleton (half-life of about 250 ms) (15). Such transient confinement behavior has been seen with other proteins and attributed to confinement within lipid microdomains or the assembly of macromolecular signaling complexes that may be transiently linked to the cytoskeleton (49, 50). A physical link between the cytoskeleton and the channel could be functionally important as there is evidence that changes in cell volume (and therefore movement between the underlying cytoskeleton and the plasma membrane) can influence the function of KCNQ1 in both the heart and epithelia (51, 52). A mechanical connection between the ion channel and the cytoskeleton might give rise to a strain sensing mechanism. In summary, we have used TIRFM and single molecule imaging to observe the fusion of vesicles and release of individual K+ channels at the plasma membrane and have also discovered a unique diffusive behavior for KCNQ1 and identified important factors determining intrinsic membrane protein mobility.
Supplementary Material
This work was supported by a Grant-in-aid from the Medical Research Council, UK (to G. M. and J. M.) and a grant from the British Heart Foundation (to M. N., S. H., and A. T.).

The on-line version of this article (available at http://www.jbc.org) contains supplemental Figs. S1–S3, Tables S1–S3, and Movies 1–10.
- TIRFM
- total internal reflection fluorescence microscopy
- MSD
- mean squared displacement
- HEK
- human embryonic kidney
- eGFP
- enhanced green fluorescent protein.
REFERENCES
- 1.Salkoff L., Jegla T. (1995) Neuron 15, 489–492 [DOI] [PubMed] [Google Scholar]
- 2.Barhanin J., Lesage F., Guillemare E., Fink M., Lazdunski M., Romey G. (1996) Nature 384, 78–80 [DOI] [PubMed] [Google Scholar]
- 3.Sanguinetti M. C., Curran M. E., Zou A., Shen J., Spector P. S., Atkinson D. L., Keating M. T. (1996) Nature 384, 80–83 [DOI] [PubMed] [Google Scholar]
- 4.Chen H., Kim L. A., Rajan S., Xu S., Goldstein S. A. (2003) Neuron 40, 15–23 [DOI] [PubMed] [Google Scholar]
- 5.Priori S. G., Barhanin J., Hauer R. N., Haverkamp W., Jongsma H. J., Kleber A. G., McKenna W. J., Roden D. M., Rudy Y., Schwartz K., Schwartz P. J., Towbin J. A., Wilde A. M. (1999) Circulation 99, 518–528 [DOI] [PubMed] [Google Scholar]
- 6.Ashcroft S. J., Ashcroft F. M. (1990) Cell Signal. 2, 197–214 [DOI] [PubMed] [Google Scholar]
- 7.Seino S. (1999) Annu. Rev. Physiol 61, 337–362 [DOI] [PubMed] [Google Scholar]
- 8.Bienengraeber M., Olson T. M., Selivanov V. A., Kathmann E. C., O'Cochlain F., Gao F., Karger A. B., Ballew J. D., Hodgson D. M., Zingman L. V., Pang Y. P., Alekseev A. E., Terzic A. (2004) Nat. Genet. 36, 382–387 [DOI] [PMC free article] [PubMed] [Google Scholar]
- 9.Dunne M. J., Cosgrove K. E., Shepherd R. M., Aynsley-Green A., Lindley K. J. (2004) Physiol. Rev. 84, 239–275 [DOI] [PubMed] [Google Scholar]
- 10.Gloyn A. L., Pearson E. R., Antcliff J. F., Proks P., Bruining G. J., Slingerland A. S., Howard N., Srinivasan S., Silva J. M., Molnes J., Edghill E. L., Frayling T. M., Temple I. K., Mackay D., Shield J. P., Sumnik Z., van Rhijn A., Wales J. K., Clark P., Gorman S., Aisenberg J., Ellard S., Njølstad P. R., Ashcroft F. M., Hattersley A. T. (2004) N. Engl. J. Med. 350, 1838–1849 [DOI] [PubMed] [Google Scholar]
- 11.Funatsu T., Harada Y., Tokunaga M., Saito K., Yanagida T. (1995) Nature 374, 555–559 [DOI] [PubMed] [Google Scholar]
- 12.Sako Y., Ichinose J., Morimatsu M., Ohta K., Uyemura T. (2003) J. Pharmacol. Sci. 93, 253–258 [DOI] [PubMed] [Google Scholar]
- 13.Mashanov G. I., Tacon D., Knight A. E., Peckham M., Molloy J. E. (2003) Methods 29, 142–152 [DOI] [PubMed] [Google Scholar]
- 14.Mashanov G. I., Tacon D., Peckham M., Molloy J. E. (2004) J. Biol. Chem. 279, 15274–15280 [DOI] [PubMed] [Google Scholar]
- 15.Kusumi A., Nakada C., Ritchie K., Murase K., Suzuki K., Murakoshi H., Kasai R. S., Kondo J., Fujiwara T. (2005) Annu. Rev. Biophys. Biomol. Struct. 34, 351–378 [DOI] [PubMed] [Google Scholar]
- 16.Suzuki K., Ritchie K., Kajikawa E., Fujiwara T., Kusumi A. (2005) Biophys. J. 88, 3659–3680 [DOI] [PMC free article] [PubMed] [Google Scholar]
- 17.White S. M., Constantin P. E., Claycomb W. C. (2004) Am. J. Physiol. Heart Circ. Physiol. 286, H823–H829 [DOI] [PubMed] [Google Scholar]
- 18.Dietrich C., Yang B., Fujiwara T., Kusumi A., Jacobson K. (2002) Biophys. J. 82, 274–284 [DOI] [PMC free article] [PubMed] [Google Scholar]
- 19.Wilson A. J., Quinn K. V., Graves F. M., Bitner-Glindzicz M., Tinker A. (2005) Cardiovasc. Res. 67, 476–486 [DOI] [PubMed] [Google Scholar]
- 20.John S. A., Monck J. R., Weiss J. N., Ribalet B. (1998) J. Physiol. 510, 333–345 [DOI] [PMC free article] [PubMed] [Google Scholar]
- 21.Benians A., Nobles M., Hosny S., Tinker A. (2005) J. Biol. Chem. 280, 13383–13394 [DOI] [PubMed] [Google Scholar]
- 22.Giblin J. P., Leaney J. L., Tinker A. (1999) J. Biol. Chem. 274, 22652–22659 [DOI] [PubMed] [Google Scholar]
- 23.Huang L., Bitner-Glindzicz M., Tranebjaerg L., Tinker A. (2001) Cardiovasc. Res. 51, 670–680 [DOI] [PubMed] [Google Scholar]
- 24.Mashanov G. I., Molloy J. E. (2007) Biophys. J. 92, 2199–2211 [DOI] [PMC free article] [PubMed] [Google Scholar]
- 25.Nobles M., Benians A., Tinker A. (2005) Proc. Natl. Acad. Sci. U.S.A. 102, 18706–18711 [DOI] [PMC free article] [PubMed] [Google Scholar]
- 26.Tinker A. (2002) in The Assembly and Targeting of Ion Channels (Henley J., Moss S. J. eds) pp. 28–57, Oxford University Press, Oxford [Google Scholar]
- 27.Ciruela F., Casadó V., Mallol J., Canela E. I., Lluis C., Franco R. (1995) J. Neurosci. Res. 42, 818–828 [DOI] [PubMed] [Google Scholar]
- 28.Ulbrich M. H., Isacoff E. Y. (2007) Nat. Methods 4, 319–321 [DOI] [PMC free article] [PubMed] [Google Scholar]
- 29.Dickson R. M., Cubitt A. B., Tsien R. Y., Moerner W. E. (1997) Nature 388, 355–358 [DOI] [PubMed] [Google Scholar]
- 30.Bubb M. R., Spector I., Beyer B. B., Fosen K. M. (2000) J. Biol. Chem. 275, 5163–5170 [DOI] [PubMed] [Google Scholar]
- 31.Schmitt N., Schwarz M., Peretz A., Abitbol I., Attali B., Pongs O. (2000) EMBO J. 19, 332–340 [DOI] [PMC free article] [PubMed] [Google Scholar]
- 32.Marx S. O., Kurokawa J., Reiken S., Motoike H., D'Armiento J., Marks A. R., Kass R. S. (2002) Science 295, 496–499 [DOI] [PubMed] [Google Scholar]
- 33.Howard R. J., Clark K. A., Holton J. M., Minor D. L., Jr. (2007) Neuron 53, 663–675 [DOI] [PMC free article] [PubMed] [Google Scholar]
- 34.Nicolas C. S., Park K. H., El Harchi A., Camonis J., Kass R. S., Escande D., Mérot J., Loussouarn G., Le B. F., Baró I. (2008) Cardiovasc. Res. 79, 427–435 [DOI] [PMC free article] [PubMed] [Google Scholar]
- 35.Steyer J. A., Horstmann H., Almers W. (1997) Nature 388, 474–478 [DOI] [PubMed] [Google Scholar]
- 36.Yang S. N., Wenna N. D., Yu J., Yang G., Qiu H., Yu L., Juntti-Berggren L., Köhler M., Berggren P. O. (2007) Cell Metab. 6, 217–228 [DOI] [PubMed] [Google Scholar]
- 37.Hu K., Huang C. S., Jan Y. N., Jan L. Y. (2003) Neuron 38, 417–432 [DOI] [PubMed] [Google Scholar]
- 38.O'Connell K. M., Tamkun M. M. (2005) J. Cell Sci. 118, 2155–2166 [DOI] [PubMed] [Google Scholar]
- 39.O'Connell K. M., Rolig A. S., Whitesell J. D., Tamkun M. M. (2006) J. Neurosci. 26, 9609–9618 [DOI] [PMC free article] [PubMed] [Google Scholar]
- 40.Zhao P., Li W., Dong Y. M., Zhu D., Qu A. L., Xu T., Wu Z. X. (2006) Acta Biochim. Biophys. Sin. 38, 136–141 [DOI] [PubMed] [Google Scholar]
- 41.Nechyporuk-Zloy V., Dieterich P., Oberleithner H., Stock C., Schwab A. (2008) Am. J. Physiol. Cell Physiol. 294, C1096–C1102 [DOI] [PubMed] [Google Scholar]
- 42.Angers S., Salahpour A., Bouvier M. (2002) Annu. Rev. Pharmacol. Toxicol. 42, 409–435 [DOI] [PubMed] [Google Scholar]
- 43.Briddon S. J., Middleton R. J., Cordeaux Y., Flavin F. M., Weinstein J. A., George M. W., Kellam B., Hill S. J. (2004) Proc. Natl. Acad. Sci. U.S.A. 101, 4673–4678 [DOI] [PMC free article] [PubMed] [Google Scholar]
- 44.Kuo A., Gulbis J. M., Antcliff J. F., Rahman T., Lowe E. D., Zimmer J., Cuthbertson J., Ashcroft F. M., Ezaki T., Doyle D. A. (2003) Science 300, 1922–1926 [DOI] [PubMed] [Google Scholar]
- 45.Stenham D. R., Campbell J. D., Sansom M. S., Higgins C. F., Kerr I. D., Linton K. J. (2003) FASEB J. 17, 2287–2289 [DOI] [PubMed] [Google Scholar]
- 46.Palczewski K., Kumasaka T., Hori T., Behnke C. A., Motoshima H., Fox B. A., Le Trong I., Teller D. C., Okada T., Stenkamp R. E., Yamamoto M., Miyano M. (2000) Science 289, 739–745 [DOI] [PubMed] [Google Scholar]
- 47.Saffman P. G., Delbrück M. (1975) Proc. Natl. Acad. Sci. U.S.A. 72, 3111–3113 [DOI] [PMC free article] [PubMed] [Google Scholar]
- 48.Gambin Y., Lopez-Esparza R., Reffay M., Sierecki E., Gov N. S., Genest M., Hodge R. S., Urbach W. (2006) Proc. Natl. Acad. Sci. U.S.A. 103, 2098–2102 [DOI] [PMC free article] [PubMed] [Google Scholar]
- 49.Sheets E. D., Lee G. M., Simson R., Jacobson K. A. (1997) Biochemistry 36, 12449–12458 [DOI] [PubMed] [Google Scholar]
- 50.Suzuki K., Fujiwara T. K., Sanematsu F., Iino R., Edidin M., Kusumi A. (2007) J. Cell Biol. 177, 717–730 [DOI] [PMC free article] [PubMed] [Google Scholar]
- 51.vanTol B. L., Missan S., Crack J., Moser S., Baldridge W. H., Linsdell P., Cowley E. A. (2007) Am. J. Physiol. Cell Physiol. 293, C1010–C1019 [DOI] [PubMed] [Google Scholar]
- 52.Calloe K., Nielsen M. S., Grunnet M., Schmitt N., Jorgenson N. K. (2007) Biochim. Biophys. Acta 1773, 764–773 [DOI] [PubMed] [Google Scholar]
Associated Data
This section collects any data citations, data availability statements, or supplementary materials included in this article.


