

Abstract
Sleep pressure and rebound comprise the two compensatory or “homeostatic” responses to sleep deprivation. Although sleep pressure is expressed by infant rats as early as postnatal day (P)5, sleep rebound does not appear to emerge until after P11. Here we reexamine the developmental expression of these sleep-regulatory processes in P2 and P8 rats by depriving them of sleep for 30 min using a cold, arousing stimulus delivered to a cold-sensitive region of the snout. This method effectively increased sleep pressure over the 30-min period, defined as increases in the number of arousing stimuli presented over time. Moreover, sleep rebound, defined as increased sleep during the recovery period, is demonstrated here for the first time at these ages. Next, we show that precollicular transections in P2 rats prevent sleep rebound without affecting sleep pressure, thus suggesting that the brainstem is sufficient to support sleep pressure, but sleep rebound depends upon neural mechanisms that lie rostral to the transection. Finally, again in P2 rats, we used c-fos immunohistochemistry to examine neural activation throughout the neuraxis during sleep deprivation and recovery. Sleep deprivation and rebound were accompanied by significant increases in neural activation in both brainstem and hypothalamic nuclei, including the ventrolateral preoptic area and median preoptic nucleus. This early developmental expression of sleep pressure and rebound and the apparent involvement of brainstem and hypothalamic structures in their expression further solidifies the notion that sleep-wake processes in newborns – defined at these ages without reference to state-dependent EEG activity – provide the foundation upon which the more familiar processes of adults are built.
Keywords: Development, c-fos, active sleep, sleep homeostasis, infant
Sleep pressure and rebound comprise the two compensatory or “homeostatic” responses to sleep deprivation (Bonnet, 2000; Rechtschaffen, 1979; Rechtschaffen, Bergmann, Gilliland, & Bauer, 1999). Sleep pressure is defined as an increase in the number of attempts to enter sleep during deprivation and can be quantified as the number of times an arousing stimulus must be presented to maintain wakefulness. In contrast, sleep rebound is defined as an increase in sleep duration or intensity once the arousing stimulus is discontinued and the subject is allowed to resume sleep (Borbely & Achermann, 1999; Rechtschaffen et al., 1999).
Although both sleep pressure and rebound are well established in adult rats, these phenomena have been studied only rarely in infants. When infants have been examined, investigators have typically focused on ages when state-dependent differentiation of the neocortical electroencephalogram (EEG), particularly delta activity, is expressed (Alfoldi, Tobler, & Borbely, 1990; Feng, Ma, & Vogel, 2001; Frank, Morrissette, & Heller, 1998). For example, in rats, in which delta activity is not expressed until after postnatal day (P)11 (Gramsbergen, 1976; Seelke & Blumberg, 2008), evidence of sleep regulation exists as early as P12 (Frank et al., 1998), the youngest age examined in that study.
However, in infant rats before the onset of delta activity, sleep is discernible on the basis of behavioral and electrographic measures, including nuchal electromyographic (EMG) activity (Blumberg, 2010). Using such measures, it was recently reported that 30 min of total sleep deprivation in P5 rats, induced by delivering flank shock whenever nuchal atonia (indicative of sleep) was detected, resulted in increased sleep pressure but not sleep rebound (Blumberg, Middlemis-Brown, & Johnson, 2004). These results seemed to concur with the view that sleep rebound is not expressed until after the emergence of delta activity (Frank et al., 1998). However, the effectiveness of the shock as an arousing stimulus diminished over time such that shock intensity needed to be increased to maintain arousal. Moreover, the use of shock created artifacts in the EMG signal that made it difficult to directly assess the effectiveness of the sleep deprivation procedure. As a consequence, the shock procedure, although sufficient to increase sleep pressure, may not have been sufficient to produce the level of sleep debt necessary to produce sleep rebound.
In the present study, we reexamine the issue of sleep pressure and rebound in neonatal rats using a method that consistently and reliably evokes arousal and also does not interfere with the collection of EMG data. This method consists of gently applying a chilled metal spatula to the snout immediately above the mouth whenever nuchal atonia is detected; this region contains a high density of cold receptors (Dickenson, Hellon, & Taylor, 1979). Most importantly, the stimulus does not interfere with the EMG signal, thereby allowing verification of the loss of sleep throughout the deprivation period. We found that P2 and P8 rats exhibit increased sleep pressure and, surprisingly, sleep rebound as well. We also found that sleep pressure and rebound are modulated by dissociable neural mechanisms as early as P2, as precollicular transections abolish sleep rebound but not pressure. Finally, to determine which areas of the brain are activated at P2 during sleep deprivation and rebound, we performed c-fos immunohistochemistry, a method for detecting neural activation that has been used in similar studies of sleep regulation in adults (Gvilia, Xu, McGinty, & Szymusiak, 2006; Tononi & Cirelli, 2001).
Materials and Methods
All experiments were performed in accordance with the National Institutes of Health Guide for the Care and Use of Laboratory Animals and were approved by the Institutional Animal Care and Use Committee of the University of Iowa. All efforts were made to minimize the number of animals used.
Subjects
A total of 72 P2 (n = 60) and P8 (n = 12) Sprague Dawley Norway rats (Rattus norvegicus) from 25 litters were used. Males and females were equally distributed among experimental groups and ages. When littermates were used they were always assigned to different experimental groups. All pups were housed with their mother in the animal colony at the University of Iowa. Litters were culled to 8 pups within 3 days of birth (day of birth = Day 0). Mothers and litters were housed in standard laboratory cages (48 × 20 × 26 cm) and received food and water ad libitum. All rats were maintained on a 12-hr light-dark cycle, with lights on at 7:00 h. All tests were performed during the lights-on phase to minimize possible circadian effects.
Experiment 1: Effects of sleep deprivation on pressure and rebound
Surgery
Twelve P2 (body weights: 7.0-9.3 g) and 12 P8 (body weights: 15.7-23.8 g) rats were used. Under isoflourane anesthesia, bipolar stainless steel hook electrodes (50 um diameter; California Fine Wire, Grover Beach, CA) were implanted bilaterally in the nuchal muscle and secured with flexible collodion. The pup was then placed on a felt pad, secured to polyethylene mesh, in a supine position and lightly restrained with soft pipe cleaners placed over the thorax and abdomen. A hole in the felt pad allowed for the passage of EMG wires. This positioning allowed for easy application of the arousing stimulus. The pup was then transferred into the testing chamber and allowed 45 min to recover and acclimate.
Apparatus
The testing environment consisted of an electrically shielded, double-walled glass chamber (height = 17 cm, i.d. = 12.5 cm) with a Plexiglas lid. An access hole in the side of the chamber allowed for the passage of humidified air (flow rate: 300 ml/min) and nuchal EMG electrodes, and an opening in the lid allowed for presentation of the arousing stimulus. Heated water circulated through the walls of the chamber to maintain air temperature at approximately 35°C, which is within the thermoneutral range for pups at these ages (Blumberg, 2001; Spiers & Adair, 1986).
Procedure
The deprivation method consisted of the gentle application of a cold, metal spatula to the snout immediately above the mouth in a region that is highly sensitive to cold stimulation (Figure 1A). The stimulus was applied whenever the subject exhibited electrographic and behavioral signs of sleep, including nuchal atonia, behavioral quiescence (i.e., absence of high-amplitude movements), or myoclonic twitching (Karlsson, Gall, Mohns, Seelke, & Blumberg, 2005; Seelke & Blumberg, 2008). Application of the spatula was repeated as often as necessary to maintain wakefulness. Spatulas were chilled in a beaker of ice water before each application. The water temperature in the beaker ranged from 4°C to 7°C. To record the number of stimulus presentations during the deprivation procedure, each application was keyed into the data acquisition system simultaneously with its occurrence.
Figure 1.
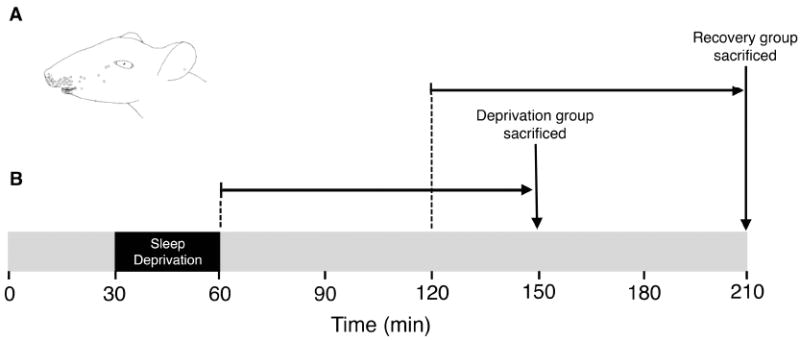
(A) Location of thermal receptive fields (denoted by circles) responsive to cold stimulation on the face in rats. Adapted from Dickenson et al., 1979. (B) Timeline depicting the procedure for Experiment 3. After a 30-min baseline period, the 30-min deprivation period began. To allow for c-fos induction so as to detect changes in neural activation in response to sleep deprivation, pups in the Deprivation group were sacrificed 90 min after the end of the deprivation period. Similarly, pups in the Recovery group were sacrificed 90 min after they were allowed 60 min of recovery sleep. Sham pups were also sacrificed at these times but were never deprived of sleep.
Each test consisted of 4 consecutive 30-min periods: a baseline period, a deprivation period, and 2 successive recovery periods. During the baseline and recovery periods, pups were allowed to cycle undisturbed between sleep and wakefulness while EMG data were recorded. Same-sex littermates, serving as control subjects, were prepared identically except they were allowed to cycle undisturbed between sleep and wakefulness throughout all 4 30-min periods.
Data Analysis
Nuchal EMG data were analyzed as described previously (Blumberg, Seelke, Lowen, & Karlsson, 2005; Karlsson et al., 2005; Seelke & Blumberg, 2008). Briefly, EMG signals were digitized at 2 kHz, integrated, and full-wave rectified using a data acquisition system (BioPac Systems, Inc., Santa Barbara, CA). The records were then dichotomized into bouts of sleep and wakefulness as follows: For each rat, the amplitudes of 5 1-s segments of both atonia and high-tone were averaged and the midpoint between the two was determined. Periods of at least 1 s in which muscle tone was below this point were defined as atonia (indicative of sleep) while those above were defined as high tone (indicative of wakefulness).
Mean sleep and wake durations for each pup were determined for each 30-min period of the experiment by dividing the subject’s total amount of time spent in both states by the total number of sleep-wake cycles during that period, with one cycle being defined as a sleep bout and its succeeding wake bout. For analysis of sleep pressure, the number of stimulus presentations was quantified for the 6 continuous 5-min segments during the 30-min deprivation period.
All data were imported into Statview 5.0 (SAS, Cary, NC) and a repeated-measures ANOVA was performed to test for group effects. When appropriate, paired t tests (within subject or between littermates) were used for post hoc analysis. Alpha was set at .05.
Experiment 2: Effect of precollicular decerebration on sleep pressure and rebound
Subjects and Surgery
Twenty-four P2 rats (body weights: 7.1-8.9 g) were used. Under isoflourane anesthesia, a small incision was made in the scalp and a precollicular transection was performed as described previously (Mohns, Karlsson, & Blumberg, 2006). Briefly, a 23-gauge needle was used to puncture the skull, creating an access hole approximately 3 mm caudal to lambda. A blunted needle was then manually inserted to the base of the brain and rotated using a side-to-side motion. Sham pups underwent the same procedure except the blunted needle was not inserted into the brain. The scalp was closed using a cyanoacrylate adhesive gel. Nuchal EMG electrodes were then implanted and the pups were restrained in the same manner as in Experiment 1. All pups were allowed 2-3 hr to recover in a humidified incubator, maintained at 35°C, and were then transferred to the testing chamber and allowed another 45 min for acclimation.
Procedure and Data Analysis
The testing protocol was the same as that used for Experiment 1. However, there were now 2 sleep-deprived groups (Transected+Deprived and Sham+Deprived) and a control group in which pups were transected but not deprived of sleep (Transected+Undeprived). Pups assigned to these 3 groups were again same-sex littermates. Data were recorded and quantified using the same method as in Experiment 1, and were again analyzed using a repeated-measures ANOVA to test for group effects. Fisher’s PLSD was used for post hoc tests and alpha was set at .05.
Histology
After the test, transected pups were given an overdose of Nembutal and perfused transcardially with phosphate buffer saline (PBS) followed by 3% formalin. The anterior–to-posterior range of all transections was determined.
Experiment 3: Neural activation associated with sleep deprivation, pressure, and rebound
Subjects and Procedure
Twenty-four P2 rats (body weights: 6.9-9.6 g) were used. Pups were prepared in the same manner as in Experiment 1. After surgery and acclimation, each subject was allowed 30 min of undisturbed baseline recording followed by 30 min of sleep deprivation (see Figure 1B). Four same-sex littermates were each assigned to 1 of 4 experimental groups: Deprivation, Recovery, Sham Deprivation, and Sham Recovery. Pups assigned to the Deprivation group were sacrificed 90 min after the end of the deprivation period, thus providing sufficient time for the expression of c-fos and the production of the Fos protein (Cirelli & Tononi, 2000; Morgan & Curran, 1991). Pups assigned to the Recovery group were sacrificed 150 min after the deprivation period, that is, 90 min after the end of the 60-min sleep recovery period. The 2 control littermates (i.e., Sham Deprivation and Sham Recovery) were sacrificed at one of these 2 times after being left undisturbed throughout the test. In counterbalanced fashion, littermates assigned to each of the 4 groups were tested in pairs at P2 and P3.
Immunohistochemistry
Animals were killed with an overdose of Nembutal and perfused transcardially with PBS followed by 4% paraformaldehyde. Brains were removed and post-fixed overnight in 4% paraformaldehyde before being transferred to 30% sucrose solution. Using a freezing microtome, 40 μm coronal sections were cut and placed in wells with PBS.
Sections were pretreated with normal goat serum for 1 h, rinsed with PBS, and then incubated at room temperature overnight in a primary antibody solution (1:2000, sc-7202, in .01 M PBS and 0.3% Triton X; Santa Cruz Biotechnology, Santa Cruz, CA). The next day, the sections were thoroughly rinsed with PBS and then incubated at room temperature in a biotinylated goat anti-rabbit IgG secondary antibody (1:200; Vector Laboratories, Burlingame, CA) for 1 h in .01 M PBS and .3% Triton X. After rinsing with PBS, tissues were reacted with an avidin-biotin peroxidase complex (Vector Laboratories) for 1 h. The sections were again rinsed with PBS before reaction with .02% diaminobenzidine solution with 30% hydrogen peroxide added just before the reaction. The reaction was terminated with PBS. Sections were mounted and coverslipped with Depex.
Analysis
Images of brain sections were captured at 20x magnification using a Leica DM/LS microscope and imaging system. Images were imported into ImageJ (National Institutes of Health) and adjusted to binary values. Using methods similar to those described elsewhere (Na, Morris, Johnson, Beltz, & Johnson, 2007), cells positive for Fos immunoreactivity (Fos-ir) were identified as comprising 20-200 pixels. For each subject, one section from each area was selected for analysis and Fos-ir positive cells were counted unilaterally. A counting box of known dimensions was placed around each area. In order to control for sampling area, the number of cells within a given section was divided by the surface area of the counting box, providing an estimate of the number of active cells per mm2. Brain nuclei were identified using a stereotaxic atlas of the rat brain (Paxinos & Watson, 1998). Although cell bodies were not counterstained, nuclei were determined on the basis of adjacent anatomical structures (e.g., ventricles, optic chiasm), as described by others using similar methods (Gong et al., 2004; Gvilia, Turner, McGinty, & Szymusiak, 2006; Verret, Leger, Fort, & Luppi, 2005). After examination of the entire brain for evidence of Fos labeling, the following areas and nuclei were selected for quantification: barrel cortex, locus coeruleus (LC), laterodorsal tegmentum (LDT), nucleus pontis oralis (PnO), dorsomedial hypothalamus (DMH), suprachiasmatic nucleus (SCN), median preoptic nucleus (MnPO), ventrolateral preoptic nucleus (VLPO), medial preoptic area (MPA), basal forebrain (BF), and paraventricular nucleus (PVN). ANOVA was used to analyze group differences for each area sampled and Fisher’s PLSD was used for post hoc tests. Alpha was set at .05 and a Bonferroni correction procedure was used to adjust alpha for multiple comparisons.
Results
Experiment 1: Effects of sleep deprivation on pressure and rebound at P2 and P8
Sleep Pressure
Figure 2 presents, for a P2 rat, representative data from the first and last 5 min of the deprivation period. As seen in the figure, subjects returned to sleep more quickly after each stimulus presentation, indicative of increased sleep pressure. In addition, stimulus presentations elicited lower-amplitude EMG responses by the end of the deprivation period. This was observed in all subjects and could reflect peripheral sensory adaptation and/or central changes in sensory threshold. Regardless, after 30 min of deprivation, pups continued to exhibit robust behavioral responses to each orofacial stimulus presentation, indicative of effective arousal and consequent sleep deprivation.
Figure 2.
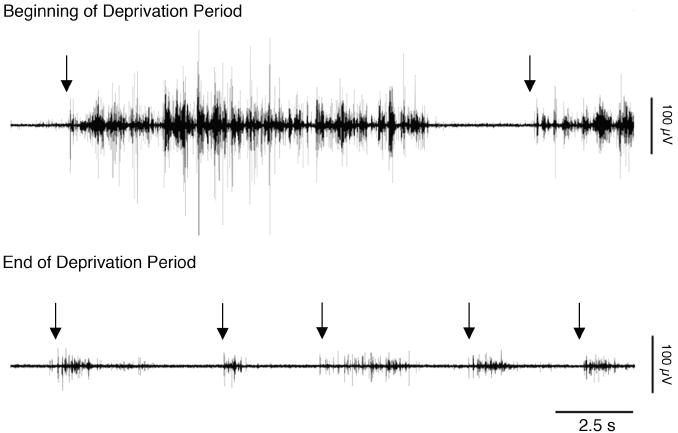
Representative data from a P2 rat at the beginning and end of the deprivation period in Experiment 1. Top: Nuchal EMG from the first 5 min of the deprivation period. Bottom: Nuchal EMG from the last 5 min of the deprivation period. Arrows denote manual presentation of the arousing orofacial stimulus.
The number of stimulus presentations delivered to the pups throughout the deprivation procedure increased significantly (Figure 3A). A repeated-measures ANOVA did not reveal a significant effect of age, F(1, 10) = .7, but did reveal a significant effect of time, F(5, 50) = 37.0, P < .001, as well as a significant age x time interaction, F(5, 50) = 8.9, P < .001. Post hoc tests confirmed that pups at each age received significantly more stimulus presentations during the last 5-min period in relation to the first.
Figure 3.
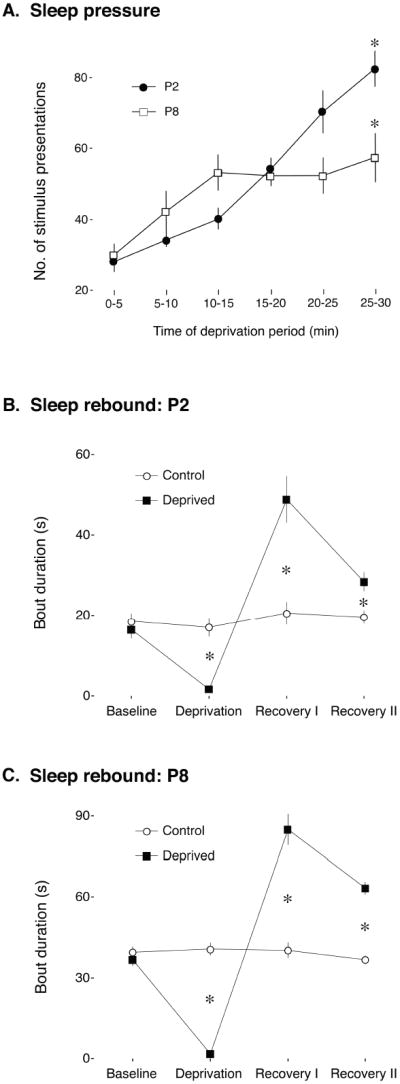
(A) Mean number of presentations of the arousing stimulus for each 5-min interval of the deprivation period in Experiment 1 for P2 (filled circles) and P8 (open squares) rats. At both ages, the number of presentations increased significantly over the 30-min deprivation period, indicative of sleep pressure. * significant difference from the first 5-min interval. Mean sleep bout durations of (B) P2 and (C) P8 rats for each 30-min period of the experiment for Control (open circles) and Deprived (filled squares) groups. Mean bout durations were significantly reduced in Deprived subjects during the deprivation period, but significantly increased during the recovery periods, indicative of sleep rebound. * significant difference from the Control group. All means are presented with standard errors.
Sleep Rebound
Figures 3B and 3C present mean sleep bout duration for each 30-min period for the P2 and P8 subjects, respectively. As expected, at both P2 and P8, the deprivation procedure effectively reduced mean sleep bout duration in the Deprived group in relation to the Control group. Importantly, indicative of sleep rebound, mean sleep bout duration increased significantly during the first 30-min recovery period and returned toward baseline levels during the second 30-min recovery period. A repeated-measures ANOVA did not reveal significant effects of group at either P2 or P8, F(1,10)s < 3.0, but did reveal significant effects of time, F(3,30)s ≥ 19.1, Ps < .001, as well as significant group x time interactions, F(3,30)s > 20.5, Ps < .001, at both ages.
Measures of mean total sleep time per 30-min period yielded findings that mirror those for mean sleep bout duration (data not shown). A repeated-measures ANOVA revealed, at both ages, significant effects of group, F(1,10)s > 6.3, Ps < .05, and time, F(3,30)s > 31.8, Ps < .0001, and significant group x time interactions, F(3,30)s > 37.4, Ps < .0001. Mean total sleep time significantly decreased during the deprivation period (Deprived: 8.4 ± 0.6 min; Control: 21.9 ± 1.0 min; t(5) = 16.0, P < .0001) and significantly increased during the first (Deprived: 26.5 ± 0.8 min; Control: 23.1 ± 0.6 min; t(5) = 3.0, P < .05) and second (Deprived: 25.9 ± 0.5 min; Control: 22.7 ± 0.8 min; t(5) = 5.0, P < .01) recovery periods.
Experiment 2: Effect of precollicular decerebration on sleep pressure and rebound at P2
Having demonstrated that sleep pressure and rebound can occur as early as P2, we next aimed to determine whether sleep pressure and rebound are dissociable, as has been shown in adults (de Andres, Garzon, & Villablanca, 2003). Accordingly, we performed precollicular transections at P2 and assessed sleep pressure and rebound using methods identical to those used in Experiment 1.
Sleep Pressure
The anterior-to-posterior range of all transections is depicted in Figure 4A. Transections always began dorsally just anterior to the superior colliculus and extended ventrally, terminating between the mammillary and interpeduncular nuclei, similar to previous reports using this procedure (Karlsson, Kreider, & Blumberg, 2004; Mohns et al., 2006). For both Sham+Deprived and Transected+Deprived groups, it was necessary to increase the number of stimulus presentations throughout the deprivation period to maintain arousal (Figure 4B). A repeated-measures ANOVA did not reveal a significant effect of group, F(1, 14) = 7.8, or a significant group x time interaction, F(5, 50) = 1.3, but did reveal a significant effect of time, F(5, 70) = 64.5, P < .001. Thus, the brainstem alone appears sufficient to support sleep pressure at P2.
Figure 4.

(A) Location of precollicular decerebrations in the P2 rats in Experiment 2. Black lines indicate the anterior-to-posterior range of the transections across all subjects. (B) Mean number of presentations of the arousing stimulus for each 5-min interval during the deprivation period for Sham+Deprived (filled squares) and Transected+Deprived (open circles) groups. In both groups, the number of presentations increased significantly over the 30-min deprivation period, indicative of sleep pressure. * significant difference from the first 5-min interval. (C) Mean sleep bout durations for the Sham+Deprived (filled squares), Transected+Deprived (open circles), and Transected+Undeprived (filled triangles) groups. Mean bout duration was significantly reduced in both Deprived groups during the deprivation period, but only the Sham+Deprived group exhibited a significant increase in bout duration during the recovery periods. † significant difference from Transected+Undeprived. * significant difference from Sham+Deprived and Transected+Undeprived. All means are presented with standard errors.
Sleep Rebound
Figure 4C presents the sleep bout duration data for each 30-min period. Both Sham+Deprived and Transected+Deprived groups showed a significant decrease in mean sleep bout duration, whereas the Transected+Undeprived group did not. Consistent with the results of Experiment 1, the Sham+Deprived group exhibited a significant increase in mean sleep bout duration during the recovery period, indicative of sleep rebound. In contrast, the Transected+Deprived group failed to show evidence of rebound. A repeated-measures ANOVA revealed a significant effect of group, F(2,21) = 7.3, P < .005, and a significant effect of time, F(3,63) = 62.8, P < .001, as well as a significant group x time interaction, F(6, 63) = 20.6, P < .001.
Again, measures of mean total sleep time per 30-min period yielded findings that mirror those for mean sleep bout duration (data not shown). A repeated-measures ANOVA revealed a significant effect of group, F(2,21) = 14.4, P < .0001, a significant effect of time, F(3,63) = 230.9, P < .0001, and a significant group x time interaction F(6,63) = 61.4, P < .0001. Importantly, during the deprivation period, mean total sleep times decreased to less than 8.3 min for the Sham+Deprived and Transected+Deprived groups, compared to 22.7 min for the Transected+Undeprived group. In contrast, mean total sleep time during the first recovery period increased significantly in the Sham+Deprived group (25.2 ± 0.6 min) in relation to both the Transected+Deprived (22.7 ± 0.9 min) and Transected+Undeprived (22.0 ± 0.6 min) groups.
Experiment 3: Neural activation associated with sleep deprivation, pressure, and rebound at P2
Experiment 2 showed that precollicular decerebration dissociates sleep pressure and rebound in P2 rats and suggested that brain areas rostral to the transection are necessary for the expression of sleep rebound. Next, using c-fos immunohistochemistry, we examined the activation patterns of specific nuclei in response to sleep deprivation and recovery sleep at P2.
Confirmation of sleep pressure and rebound
As in Experiments 1 and 2, stimulus presentations and sleep bout durations were quantified to confirm sleep pressure and rebound, respectively. In all respects, the results were similar to those presented in Experiments 1 and 2.
Cellular activity associated with stimulus presentation
In both Deprivation and Recovery groups (see Figure 1B for timeline of the experiment and definitions of groups), cells expressing the Fos protein were seen in areas that receive projections from the whisker pad and orofacial region, including the primary sensory nucleus of the trigeminal nerve, the ventroposterior medial thalamus, and a highly discrete region within barrel cortex (Petersen, 2007). Sham Deprivation and Sham Recovery groups did not show Fos-ir in these areas.
We quantified Fos-ir in barrel cortex during the deprivation and recovery periods in order to determine whether levels of Fos protein persisted beyond the period of orofacial stimulation. ANOVA revealed a significant effect of group on Fos-ir, F(3, 20) = 13.8, P < 0.001. Importantly, as shown in Figure 5, the Deprivation and Recovery groups exhibited significantly higher Fos-ir than both of the Sham groups. Therefore, the elevated levels of the Fos protein did not return toward baseline during the 1-h recovery period even though orofacial stimulation had ceased.
Figure 5.

Mean number of Fos-ir positive cells per mm2 for each area sampled in the P2 rats in Experiment 3. Data are clustered into 3 groups reflecting nuclei that exhibited wake-active (left), sleep-active (middle), and state-indifferent (right) responses to sleep deprivation and recovery. See Figure 1B for the timeline for this experiment and the designation of experimental groups. * significant difference from Sham groups. † significant difference from Sham and Deprivation groups. All means are presented with standard errors. LC, locus coeruleus; LDT, laterodorsal tegmental nucleus; DMH, dorsomedial hypothalamus; PnO, nucleus pontis oralis; MnPO, median preoptic nucleus; VLPO, ventrolateral preoptic nucleus; SCN, suprachiasmatic nucleus; MPA, median preoptic area; BF, basal forebrain; PVN, paraventricular nucleus.
Cellular activity associated with sleep pressure and rebound
After surveying the entire brain for evidence of consistent Fos-ir positive cells, 10 nuclei were chosen for quantitative analysis. As shown in Figure 5, these nuclei exhibited Fos-ir profiles that clustered into 3 distinct patterns: wake-related, sleep-related, and state-indifferent. First, indicative of wake-related activity, the LC, LDT, and DMH exhibited significantly higher mean Fos-ir counts in both the Deprivation and Recovery groups in relation to the 2 sham groups, F(3, 20)s ≥13.3, Ps < 0.001. Second, indicative of sleep-related activity, the PnO, MnPO, and VLPO exhibited significant increases in mean Fos-ir counts in the Recovery group only, F(3,20)s ≥ 9.4, Ps < 0.001; the photomicrographs in Figure 6 illustrate Fos-ir patterns in the hypothalamus and brainstem for Recovery and Sham subjects. Finally, indicative of state-indifference, the SCN, MPA, BF, and PVN did not exhibit any significant differences in mean Fos-ir counts, F(3,20)s ≤ 2.2.
Figure 6.
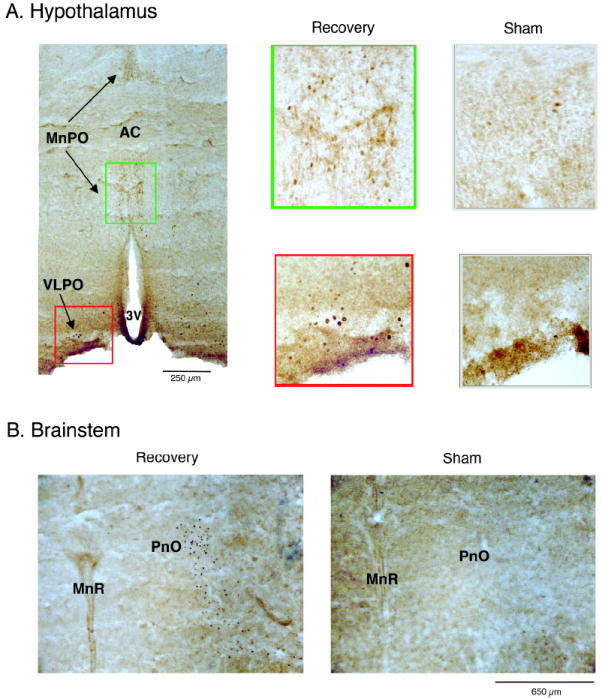
Representative examples of Fos labeling in (A) hypothalamic and (B) brainstem sections from P2 rats in Experiment 3. (A) Left: coronal section depicting median preoptic nucleus (MnPO; green box) and ventrolateral preoptic nucleus (VLPO; red box) for a Recovery P2 subject. Middle: Enlarged sections illustrating Fos labeling in the MnPO (top) and VLPO (bottom). Right: Corresponding sections from the MnPO (top) and VLPO (bottom) in a Sham subject. (B) Representative coronal brainstem sections from Recovery (left) and Sham (right) pups. AC, anterior commissure; 3V, third ventricle; PnO, nucleus pontis oralis; MnR, median raphe nucleus.
Discussion
Here we report for the first time in rats that, in addition to sleep pressure, sleep rebound is expressed in early infancy. Additionally, we show that sleep pressure and rebound are dissociable, as precollicular decerebrations abolish rebound but not pressure at P2. Finally, at P2, we show that deprivation-induced wakefulness and recovery sleep are associated with differential Fos-ir in brainstem and hypothalamic structures. In previous studies in infant rats (Blumberg et al., 2004) and newborn rhesus monkeys (Berger & Meier, 1966), it was suggested that the failure to find evidence of sleep rebound might be due to insufficient neural circuitry or to a ceiling effect whereby sleep durations could not be increased further. The present results obviate the need for either explanation in the case of infant rats.
Our method of deprivation – which entailed the application of a cold stimulus to a thermally sensitive region of the snout – proved reliable and effective. In contrast with electric shock (Berger & Meier, 1966; Blumberg et al., 2004), in which stimulus intensity must be increased over time to maintain arousal, the delivery of the cold stimulus to the snout – and the subsequent activation of the trigeminal system – evoked robust behavioral arousal throughout the 30-min deprivation period. Importantly, this method did not prevent the continuous measurement of nuchal EMG during the deprivation period, thus allowing us to confirm the effectiveness of the sleep deprivation protocol.
Under ideal circumstances, a yoked control group would have been included to control for all aspects of the sleep deprivation procedure (Rechtschaffen, Gilliland, Bergmann, & Winter, 1983). However, such a yoking procedure was not possible in the present study because of the disproportionately long sleep periods and rapid sleep–wake cycling characteristic of early infancy (Blumberg et al., 2004; Blumberg et al., 2005); in other words, yoked-control pups would unavoidably experience nearly as much sleep deprivation as would sleep-deprived pups. Thus, in the absence of such a control group, it remains possible that stress associated with some aspect of the sleep-deprivation procedure contributed to the present findings. First, it should be noted that any stress associated with maternal separation is unlikely to have been a factor here, as even 8 h of maternal separation at thermoneutrality in P8 rats does not significantly alter sleep-wake organization (Seelke & Blumberg, 2005). Second, we examined Fos-ir in the PVN, a nucleus that exhibits increased corticotropin-releasing hormone immunoreactivity in response to sleep deprivation in adult rats (Galvao Mde, Sinigaglia-Coimbra, Kawakami, Tufik, & Suchecki, 2009) and increased c-fos mRNA levels in P12 rats when mildly stressed with a saline injection (Smith, Kim, van Oers, & Levine, 1997). As shown in Figure 5, we found no evidence of increased Fos-ir in the PVN in response to sleep deprivation.
Although we did not differentiate between active sleep (AS) and quiet sleep (QS) in this study, it is known that infant rats spend the majority of their time in AS (Gramsbergen, Schwartze, & Prechtl, 1970; Jouvet-Mounier, Astic, & Lacote, 1970; Seelke & Blumberg, 2008). Interestingly, in adult rats, total sleep deprivation results in significant AS and QS rebounds, with the former exhibiting relatively greater rebound than the latter (Everson et al., 1989; Rechtschaffen et al., 1983). Therefore, we suspect that total sleep deprivation in infants results in recovery sleep that is composed largely of AS.
It is interesting that sleep pressure increases significantly within only 30 min in infants. Similar procedures in adults typically require hours or days to produce detectible increases in sleep pressure (Borbely & Achermann, 1999; Ocampo-Garces, Molina, Rodriguez, & Vivaldi, 2000; Rechtschaffen & Bergmann, 1995). Whereas infants spend the majority of their time asleep, their sleep bouts are relatively fragmented compared to adults, resulting in more rapid cycling between sleep and wakefulness (Blumberg et al., 2005). Consequently, these results support the conjecture that animals that cycle faster accumulate sleep need more quickly during deprivation (Rechtschaffen et al., 1999). It may be that rapid cycling is indicative of a strong drive for sleep, but this notion remains unproven at this time.
Since the results of Experiment 2 showed that the dissociation between sleep pressure and rebound after precollicular decerebrations is expressed similarly in infants and adults (de Andres et al., 2003), they suggest that similar neural mechanisms are involved in these processes throughout the lifespan. Consistent with the adult data, our results suggest that the brainstem is sufficient to support sleep pressure, and that areas rostral to the transection are necessary to support sleep rebound. In Experiment 3, we used c-fos immunohistochemistry to identify nuclei associated with the production of sleep pressure and rebound.
Consistent with findings in adults during periods of prolonged wakefulness induced by sleep deprivation (Cirelli, Pompeiano, & Tononi, 1995; Maloney, Mainville, & Jones, 1999), we found increased Fos-ir in LC, LDT, and DMH in our sleep-deprived P2 subjects. These results are also consistent with recording and lesion studies, performed in P8 rats, that demonstrate brainstem contributions to spontaneous sleep and wakefulness (Gall, Poremba, & Blumberg, 2007; Karlsson et al., 2005). Thus, at least some of the neural mechanisms that underlie deprivation-induced wakefulness in adults are functional as early as P2.
The increased Fos-ir exhibited by LC, LDT, and DMH as a result of sleep deprivation persisted into the recovery period. This raises the question as to whether these nuclei maintained high levels of activity during the recovery period or whether the Fos protein simply did not degrade during the interval separating the times of sacrifice. It is known that stimulation-induced increases in Fos protein levels persist for as long as 4-8 hours (Cirelli & Tononi, 2000). Indeed, as shown in Figure 5, barrel cortex exhibited elevated Fos-ir levels during the recovery period even though orofacial stimulation ceased at the end of the deprivation period. Given that the barrel cortex exhibited a similar pattern of activation as LC, LDT, and DMH, we conclude that the sustained elevation of Fos-ir in those areas reflects the slow degradation of the Fos protein, not continued activity in those areas during the recovery period. All together, these results suggest that one or more of these nuclei, in early infancy, contribute to the maintenance of arousal during sleep deprivation and, perhaps, also play a role in the production of sleep pressure.
Of particular interest was the finding that Fos-ir increases in two hypothalamic nuclei – the MnPO and VLPO – during sleep rebound. Based on immunohistochemical (Gong, Szymusiak, King, Steininger, & McGinty, 2000; Sherin, Shiromani, McCarley, & Saper, 1996) and single-unit recording (Suntsova, Szymusiak, Alam, Guzman-Marin, & McGinty, 2002; Szymusiak, Alam, Steininger, & McGinty, 1998) studies in adult rats, the MnPO and VLPO have been shown to contain distinct populations of sleep-active neurons. Fos-ir positive neurons in these nuclei are associated with recovery sleep, as measured by increases in sleep duration and delta power (Gong et al., 2004). As already discussed, the absence of delta activity at the ages examined here meant that we had to rely on sleep duration as a measure of sleep rebound. Clearly, although several hypotheses of sleep function focus on delta activity as a marker of sleep homeostasis (Porkka-Heiskanen, 1999; Tononi & Cirelli, 2003), the present findings indicate that there is no necessary relationship between sleep rebound and delta activity. Furthermore, building on a previous study of the development of delta activity (Seelke & Blumberg, 2008), our results suggest that the regulation of delta activity becomes integrated developmentally with an already-existing sleep-regulatory system.
The present findings further validate our methodological approach – which relies on behavior and nuchal EMG – for measuring sleep and wakefulness in neonates. Using these methods in neonatal rats, we have shown that brainstem (Gall et al., 2007; Karlsson et al., 2005) and forebrain (Karlsson et al., 2004; Mohns et al., 2006) mechanisms modulate sleep and wakefulness and that these mechanisms appear identical to those identified in adults. Here we further demonstrate that brainstem and hypothalamic nuclei associated with sleep pressure and rebound – regulatory processes that are considered among the defining features of sleep (Campbell & Tobler, 1984; Hendricks, Sehgal, & Pack, 2000) – are already functioning in infants as young as P2. Future studies can use these findings as a foundation for investigating the developmental elaboration of the neural circuits controlling sleep-wake processes throughout ontogeny and the functions of sleep for the developing animal.
Acknowledgments
This study was supported by a grant (MH50701) and an Independent Scientist Award (MH66424) from the National Institutes of Health (M.S.B.). We thank Ralph Johnson, Gordon Barr, and Kathryn Lenz for valuable technical advice.
Footnotes
Publisher's Disclaimer: The following manuscript is the final accepted manuscript. It has not been subjected to the final copyediting, fact-checking, and proofreading required for formal publication. It is not the definitive, publisher-authenticated version. The American Psychological Association and its Council of Editors disclaim any responsibility or liabilities for errors or omissions of this manuscript version, any version derived from this manuscript by NIH, or other third parties. The published version is available at www.apa.org/pubs/journals/bne
References
- Alfoldi P, Tobler I, Borbely AA. Sleep regulation in rats during early development. American Journal of Physiology. 1990;258:R634–644. doi: 10.1152/ajpregu.1990.258.3.R634. [DOI] [PubMed] [Google Scholar]
- Berger RJ, Meier GW. The effects of selective deprivation of states of sleep in the developing monkey. Psychophysiology. 1966;2:354–371. [Google Scholar]
- Blumberg MS. The developmental context of thermal homeostasis. In: Blass EM, editor. Handbook of Behavioral Neurobiology. Vol. 13. New York: Plenum Press; 2001. pp. 199–228. [Google Scholar]
- Blumberg MS. The form and function of infant sleep: From muscle to neocortex. In: Blumberg MS, Freeman JH, Robinson SR, editors. The Oxford handbook of developmental behavioral neuroscience. New York: Oxford; 2010. pp. 391–423. [Google Scholar]
- Blumberg MS, Middlemis-Brown JE, Johnson ED. Sleep homeostasis in infant rats. Behavioral Neuroscience. 2004;118:1253–1261. doi: 10.1037/0735-7044.118.6.1253. [DOI] [PMC free article] [PubMed] [Google Scholar]
- Blumberg MS, Seelke AM, Lowen SB, Karlsson KA. Dynamics of sleep-wake cyclicity in developing rats. Proceedings of the National Academy of Sciences. 2005;102:14860–14864. doi: 10.1073/pnas.0506340102. [DOI] [PMC free article] [PubMed] [Google Scholar]
- Bonnet MH. Sleep deprivation. In: Kryger MH, Roth T, Dement WC, editors. Principles and practice of sleep medicine. Philadelphia: W. B. Saunders Company; 2000. pp. 53–71. [Google Scholar]
- Borbely AA, Achermann P. Sleep homeostasis and models of sleep regulation. Journal of Biological Rhythms. 1999;14:557–568. doi: 10.1177/074873099129000894. [DOI] [PubMed] [Google Scholar]
- Campbell SS, Tobler I. Animal sleep: A review of sleep duration across phylogeny. Neuroscience & Biobehavioral Reviews. 1984;8:269–300. doi: 10.1016/0149-7634(84)90054-x. [DOI] [PubMed] [Google Scholar]
- Cirelli C, Pompeiano M, Tononi G. Sleep deprivation and c-fos expression in the rat brain. Journal of Sleep Research. 1995;4:92–106. doi: 10.1111/j.1365-2869.1995.tb00157.x. [DOI] [PubMed] [Google Scholar]
- Cirelli C, Tononi G. On the functional significance of c-fos induction during the sleep-waking cycle. Sleep. 2000;23:453–469. [PubMed] [Google Scholar]
- de Andres I, Garzon M, Villablanca JR. The disconnected brain stem does not support rapid eye movement sleep rebound following selective deprivation. Sleep. 2003;26:419–425. doi: 10.1093/sleep/26.4.419. [DOI] [PubMed] [Google Scholar]
- Dickenson AH, Hellon RF, Taylor CM. Facial thermal input to the trigeminal spinal nucleus of rabbits and rats. Journal of Comparative Neurology. 1979;185:203–210. doi: 10.1002/cne.901850112. [DOI] [PubMed] [Google Scholar]
- Everson CA, Gilliland MA, Kushida CA, Pilcher JJ, Fang VS, Refetoff S, Bergmann BM, Rechtschaffen A. Sleep deprivation in the rat: IX. Recovery. Sleep. 1989;12:60–67. [PubMed] [Google Scholar]
- Feng P, Ma Y, Vogel GW. Ontogeny of REM rebound in postnatal rats. Sleep. 2001;24:645–653. doi: 10.1093/sleep/24.6.645. [DOI] [PubMed] [Google Scholar]
- Frank MG, Morrissette R, Heller HC. Effects of sleep deprivation in neonatal rats. American Journal of Physiology. 1998;44:R148–R157. doi: 10.1152/ajpregu.1998.275.1.R148. [DOI] [PubMed] [Google Scholar]
- Gall AJ, Poremba AL, Blumberg MS. Brainstem cholinergic modulation of muscle tone in infant rats. European Journal of Neuroscience. 2007;25:3367–3375. doi: 10.1111/j.1460-9568.2007.05566.x. [DOI] [PMC free article] [PubMed] [Google Scholar]
- Galvao Mde O, Sinigaglia-Coimbra R, Kawakami SE, Tufik S, Suchecki D. Paradoxical sleep deprivation activates hypothalamic nuclei that regulate food intake and stress response. Psychoneuroendocrinology. 2009;34:1176–1183. doi: 10.1016/j.psyneuen.2009.03.003. [DOI] [PubMed] [Google Scholar]
- Gong H, McGinty D, Guzman-Marin R, Chew KT, Stewart D, Szymusiak R. Activation of c-fos in GABAergic neurones in the preoptic area during sleep and in response to sleep deprivation. Journal of Physiology. 2004;556:935–946. doi: 10.1113/jphysiol.2003.056622. [DOI] [PMC free article] [PubMed] [Google Scholar]
- Gong H, Szymusiak R, King J, Steininger T, McGinty D. Sleep-related c-Fos protein expression in the preoptic hypothalamus: effects of ambient warming. American Journal of Physiology. 2000;279:R2079–2088. doi: 10.1152/ajpregu.2000.279.6.R2079. [DOI] [PubMed] [Google Scholar]
- Gramsbergen A. The development of the EEG in the rat. Developmental Psychobiology. 1976;9:501–515. doi: 10.1002/dev.420090604. [DOI] [PubMed] [Google Scholar]
- Gramsbergen A, Schwartze P, Prechtl HFR. The postnatal development of behavioral states in the rat. Developmental Psychobiology. 1970;3:267–280. doi: 10.1002/dev.420030407. [DOI] [PubMed] [Google Scholar]
- Gvilia I, Turner A, McGinty D, Szymusiak R. Preoptic area neurons and the homeostatic regulation of rapid eye movement sleep. Journal of Neuroscience. 2006;26:3037–3044. doi: 10.1523/JNEUROSCI.4827-05.2006. [DOI] [PMC free article] [PubMed] [Google Scholar]
- Gvilia I, Xu F, McGinty D, Szymusiak R. Homeostatic regulation of sleep: a role for preoptic area neurons. Journal of Neuroscience. 2006;26:9426–9433. doi: 10.1523/JNEUROSCI.2012-06.2006. [DOI] [PMC free article] [PubMed] [Google Scholar]
- Hendricks JC, Sehgal A, Pack A. The need for a simple animal model to understand sleep. Progress in Neurobiology. 2000;61:339–351. doi: 10.1016/s0301-0082(99)00048-9. [DOI] [PubMed] [Google Scholar]
- Jouvet-Mounier D, Astic L, Lacote D. Ontogenesis of the states of sleep in rat, cat, and guinea pig during the first postnatal month. Developmental Psychobiology. 1970;2:216–239. doi: 10.1002/dev.420020407. [DOI] [PubMed] [Google Scholar]
- Karlsson KÆ, Gall AJ, Mohns EJ, Seelke AMH, Blumberg MS. The neural substrates of infant sleep in rats. PLoS Biology. 2005;3:891–901. doi: 10.1371/journal.pbio.0030143. [DOI] [PMC free article] [PubMed] [Google Scholar]
- Karlsson KÆ, Kreider JC, Blumberg MS. Hypothalamic contribution to sleep-wake cycle development. Neuroscience. 2004;123:575–582. doi: 10.1016/j.neuroscience.2003.09.025. [DOI] [PubMed] [Google Scholar]
- Maloney KJ, Mainville L, Jones BE. Differential c-Fos expression in cholinergic, monoaminergic, and GABAergic cell groups of the pontomesencephalic tegmentum after paradoxical sleep deprivation and recovery. Journal of Neuroscience. 1999;19:3057–3072. doi: 10.1523/JNEUROSCI.19-08-03057.1999. [DOI] [PMC free article] [PubMed] [Google Scholar]
- Mohns EJ, Karlsson KÆ, Blumberg MS. The preoptic area and basal forebrain play opposing roles in the descending modulation of sleep and wakefulness in infant rats. European Journal of Neuroscience. 2006;23:1301–1310. doi: 10.1111/j.1460-9568.2006.04652.x. [DOI] [PMC free article] [PubMed] [Google Scholar]
- Morgan JI, Curran T. Stimulus-transcription coupling in the nervous system: involvement of the inducible proto-oncogenes fos and jun. Annual Review of Neuroscience. 1991;14:421–451. doi: 10.1146/annurev.ne.14.030191.002225. [DOI] [PubMed] [Google Scholar]
- Na ES, Morris MJ, Johnson RF, Beltz TG, Johnson AK. The neural substrates of enhanced salt appetite after repeated sodium depletions. Brain Research. 2007;1171:104–110. doi: 10.1016/j.brainres.2007.07.033. [DOI] [PMC free article] [PubMed] [Google Scholar]
- Ocampo-Garces A, Molina E, Rodriguez A, Vivaldi EA. Homeostasis of REM sleep after total and selective sleep deprivation in the rat. Journal of Neurophysiology. 2000;84:2699–2702. doi: 10.1152/jn.2000.84.5.2699. [DOI] [PubMed] [Google Scholar]
- Paxinos G, Watson C. The rat brain in stereotaxic coordinates. 4. San Diego, CA: Academic Press; 1998. [DOI] [PubMed] [Google Scholar]
- Petersen CC. The functional organization of the barrel cortex. Neuron. 2007;56:339–355. doi: 10.1016/j.neuron.2007.09.017. [DOI] [PubMed] [Google Scholar]
- Porkka-Heiskanen T. Adenosine in sleep and wakefulness. Annals of Medicine. 1999;31:125–129. doi: 10.3109/07853899908998788. [DOI] [PubMed] [Google Scholar]
- Rechtschaffen A. The function of sleep: methodological issues. In: Drucket R, Shkurovich M, Sterman MB, editors. Functions of Sleep. New York: Academic Press; 1979. pp. 1–17. [Google Scholar]
- Rechtschaffen A, Bergmann BM. Sleep deprivation in the rat by the disk-over-water method. Behavioural Brain Research. 1995;69:55–63. doi: 10.1016/0166-4328(95)00020-t. [DOI] [PubMed] [Google Scholar]
- Rechtschaffen A, Bergmann BM, Gilliland MA, Bauer K. Effects of method, duration, and sleep stage on rebounds from sleep deprivation in the rat. Sleep. 1999;22:11–31. doi: 10.1093/sleep/22.1.11. [DOI] [PubMed] [Google Scholar]
- Rechtschaffen A, Gilliland MA, Bergmann BM, Winter JB. Physiological correlates of prolonged sleep deprivation in rats. Science. 1983;221:182–184. doi: 10.1126/science.6857280. [DOI] [PubMed] [Google Scholar]
- Seelke AM, Blumberg MS. The microstructure of active and quiet sleep as cortical delta activity emerges in infant rats. Sleep. 2008;31:691–699. doi: 10.1093/sleep/31.5.691. [DOI] [PMC free article] [PubMed] [Google Scholar]
- Seelke AMH, Blumberg MS. Thermal and nutritional modulation of sleep in infant rats. Behavioral Neuroscience. 2005;19:603–611. doi: 10.1037/0735-7044.119.2.603. [DOI] [PMC free article] [PubMed] [Google Scholar]
- Sherin JE, Shiromani PJ, McCarley RW, Saper CB. Activation of ventrolateral preoptic neurons during sleep. Science. 1996;271:216–219. doi: 10.1126/science.271.5246.216. [DOI] [PubMed] [Google Scholar]
- Smith MA, Kim SY, van Oers HJ, Levine S. Maternal deprivation and stress induce immediate early genes in the infant rat brain. Endocrinology. 1997;138:4622–4628. doi: 10.1210/endo.138.11.5529. [DOI] [PubMed] [Google Scholar]
- Spiers DE, Adair ER. Ontogeny of homeothermy in the immature rat: Metabolic and thermal responses. Journal of Applied Physiology. 1986;60:1190–1197. doi: 10.1152/jappl.1986.60.4.1190. [DOI] [PubMed] [Google Scholar]
- Suntsova N, Szymusiak R, Alam MN, Guzman-Marin R, McGinty D. Sleep-waking discharge patterns of median preoptic nucleus neurons in rats. Journal of Physiology. 2002;543:665–677. doi: 10.1113/jphysiol.2002.023085. [DOI] [PMC free article] [PubMed] [Google Scholar]
- Szymusiak R, Alam N, Steininger TL, McGinty D. Sleep-waking discharge patterns of ventrolateral preoptic/anterior hypothalamic neurons in rats. Brain Research. 1998;803:178–188. doi: 10.1016/s0006-8993(98)00631-3. [DOI] [PubMed] [Google Scholar]
- Tononi G, Cirelli C. Modulation of brain gene expression during sleep and wakefulness: a review of recent findings. Neuropsychopharmacology. 2001;25(5 Suppl):S28–35. doi: 10.1016/S0893-133X(01)00322-0. [DOI] [PubMed] [Google Scholar]
- Tononi G, Cirelli C. Sleep and synaptic homeostasis: a hypothesis. Brain Research Bulletin. 2003;62:143–150. doi: 10.1016/j.brainresbull.2003.09.004. [DOI] [PubMed] [Google Scholar]
- Verret L, Leger L, Fort P, Luppi PH. Cholinergic and noncholinergic brainstem neurons expressing Fos after paradoxical (REM) sleep deprivation and recovery. European Journal of Neuroscience. 2005;21:2488–2504. doi: 10.1111/j.1460-9568.2005.04060.x. [DOI] [PubMed] [Google Scholar]